

The DOI matches its Crossref record; 23 of the 23 references it cites were found in a registry or an index.
Interpreting the concordance statistic of a logistic regression model: relation to the variance and odds ratio of a continuous explanatory variable
Open accessAbstract
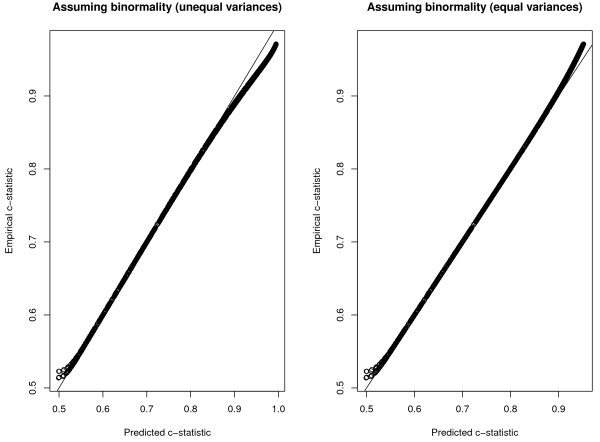
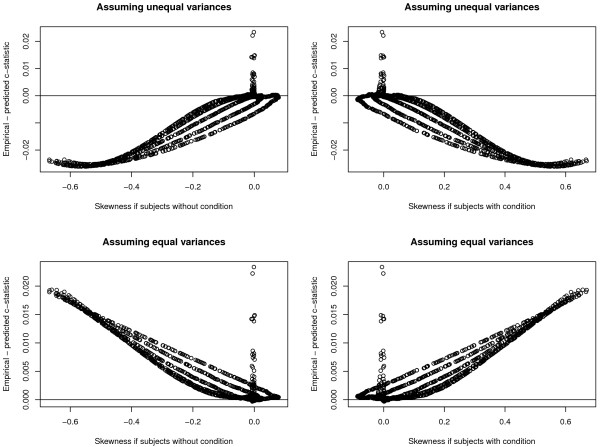
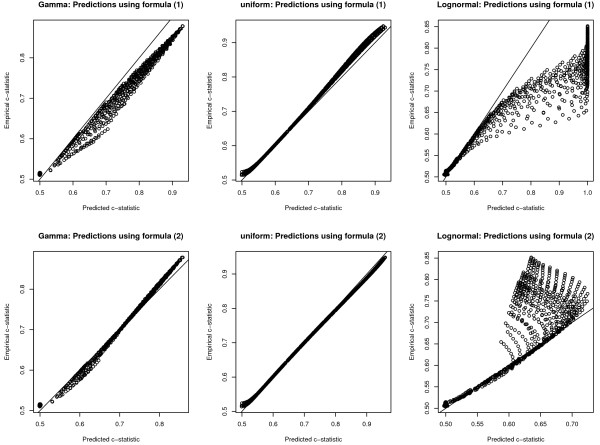
BACKGROUND: When outcomes are binary, the c-statistic (equivalent to the area under the Receiver Operating Characteristic curve) is a standard measure of the predictive accuracy of a logistic regression model. METHODS: An analytical expression was derived under the assumption that a continuous explanatory variable follows a normal distribution in those with and without the condition. We then conducted an extensive set of Monte Carlo simulations to examine whether the expressions derived under the assumption of binormality allowed for accurate prediction of the empirical c-statistic when the explanatory variable followed a normal distribution in the combined sample of those with and without the condition. We also examine the accuracy of the predicted c-statistic when the explanatory variable followed a gamma, log-normal or uniform distribution in combined sample of those with and without the condition. RESULTS: Under the assumption of binormality with equality of variances, the c-statistic follows a standard normal cumulative distribution function with dependence on the product of the standard deviation of the normal components (reflecting more heterogeneity) and the log-odds ratio (reflecting larger effects). Under the assumption of binormality with unequal variances, the c-statistic follows a standard normal cumulative distribution function with dependence on the standardized difference of the explanatory variable in those with and without the condition. In our Monte Carlo simulations, we found that these expressions allowed for reasonably accurate prediction of the empirical c-statistic when the distribution of the explanatory variable was normal, gamma, log-normal, and uniform in the entire sample of those with and without the condition. CONCLUSIONS: The discriminative ability of a continuous explanatory variable cannot be judged by its odds ratio alone, but always needs to be considered in relation to the heterogeneity of the population.
Overview
The claims and statistics of this paper haven’t been checked yet.
Run the check — free, no account needed. It reads the open-access text and checks the sources it cites.
Integrity signals
Registry
Cites
Statistics
Figures
Verification
Claims the paper makes
The claims and statistics of this paper haven’t been checked yet.
Run the check — free, no account needed. It reads the open-access text and checks the sources it cites.
Claims other papers make about this one
Each is checked against this paper’s own text: does it say what the citing paper says it does?
The cited source says what the claim attributes to it.
In the citing paper
“Although ROC analysis is mathematically related to logistic regression (Austin & Steyerberg, 2012)”
From Stress, stress-induced cortisol responses, and eyewitness identification performance (2016) · cites this paper as Austin & Steyerberg, 2012
In the citing paper
“For instance, it is well known that a model’s discrimination performance tends to deteriorate when it is applied to populations or subgroups with a more homogeneous case-mix, as there is less separation of predicted risks across individuals.”
From A framework for meta-analysis of prediction model studies with binary and time-to-event outcomes (2019) · cites this paper as [20]
In the citing paper
“For instance, for prediction models with a binary outcome, the c-statistic is a reparameterization of Somer’s D,19 and can also be derived from the distribution of the linear predictor,20 Cohen’s effect size,20 or several correlation indices.21”
From A framework for meta-analysis of prediction model studies with binary and time-to-event outcomes (2019) · cites this paper as [20]
Self-check
Percentages, sums and reported differences re-computed from the paper’s own numbers.
The self-check needs the paper’s full text.
Citations
Cites
R: A Language and Environment for Statistical Computing
R Core Team (2000) · doi:10.32614/r.manuals · Cited by 355,893
(1990) · Choice Reviews Online · doi:10.5860/choice.27-3338 · Cited by 35,305
The meaning and use of the area under a receiver operating characteristic (ROC) curve.
Hanley, J. A., & McNeil, B. J. (1982) · Radiology · doi:10.1148/radiology.143.1.7063747 · Cited by 21,856
Regression Modeling Strategies
Harrell, F. E. (2001) · Springer series in statistics · doi:10.1007/978-1-4757-3462-1 · Cited by 9,270
Kupper, L. L., Hosmer, D. W., & Lemeshow, S. A. (1990) · Journal of the American Statistical Association · doi:10.2307/2290035 · Cited by 7,690
Harrell (2015) · Springer Series in Statistics · doi:10.1007/978-3-319-19425-7 · Cited by 6,878
Austin, P. C. (2009) · Statistics in Medicine · doi:10.1002/sim.3697 · Cited by 6,758
Self-citationAssessing the Performance of Prediction Models: A Framework for Traditional and Novel Measures
Steyerberg, E. W., Vickers, A. J., Cook, N. R., Gerds, T., Gonen, M., Obuchowski, N., Pencina, M. J., & Kattan, M. W. (2010) · Epidemiology · doi:10.1097/ede.0b013e3181c30fb2 · Cited by 5,170
Self-citationClinical Prediction Models: A Practical Approach to Development, Validation, and Updating
Steyerberg, E. W. (2019) · Statistics for Biology and Health · doi:10.1007/978-3-030-16399-0 · Cited by 3,281
Self-citationDeeks, J. J., Macaskill, P., & Irwig, L. (2005) · Journal of Clinical Epidemiology · doi:10.1016/j.jclinepi.2005.01.016 · Cited by 2,910
Statistical Methods in Diagnostic Medicine
Zhou, X., Sun, J., Pennello, G. A., Obuchowski, N. A., & McClish, D. K. (2011) · Wiley series in probability and statistics · doi:10.1002/9780470906514 · Cited by 1,785
Steyerberg, E. W. (2009) · Statistics for Biology and Health · doi:10.1007/978-0-387-77244-8 · Cited by 1,491
Self-citationBamber, D. (1975) · Journal of Mathematical Psychology · doi:10.1016/0022-2496(75)90001-2 · Cited by 1,452
Pepe, M. S. (2004) · American Journal of Epidemiology · doi:10.1093/aje/kwh101 · Cited by 1,276
Normand, S. T., Landrum, M. B., Guadagnoli, E., Ayanian, J. Z., Ryan, T. J., Cleary, P. D., & McNeil, B. J. (2001) · Journal of Clinical Epidemiology · doi:10.1016/s0895-4356(00)00321-8 · Cited by 1,244
Statistical Methods in Diagnostic Medicine
Zhou, X., Obuchowski, N. A., & McClish, D. K. (2002) · Wiley series in probability and statistics · doi:10.1002/9780470317082 · Cited by 1,166
Standard Distance in Univariate and Multivariate Analysis
Flury, B. K., & Riedwyl, H. (1986) · The American Statistician · doi:10.1080/00031305.1986.10475403 · Cited by 289
Effectiveness of Public Report Cards for Improving the Quality of Cardiac Care
Tu, J. V., Donovan, L. R., Lee, D. S., Wang, J. T., Austin, P. C., Alter, D. A., & Ko, D. T. (2009) · JAMA · doi:10.1001/jama.2009.1731 · Cited by 256
Self-citationVergouwe, Y., Moons, K. G. M., & Steyerberg, E. W. (2010) · American Journal of Epidemiology · doi:10.1093/aje/kwq223 · Cited by 243
Self-citationModel‐based screening by risk with application to down's syndrome
Royston, P. J., & Thompson, S. G. (1992) · Statistics in Medicine · doi:10.1002/sim.4780110211 · Cited by 176
Janssens, A. C. J. W., Moonesinghe, R., Yang, Q., Steyerberg, E. W., van Duijn, C. M., & Khoury, M. J. (2007) · Genetics in Medicine · doi:10.1097/gim.0b013e31812eece0 · Cited by 151
Self-citationVisualizing and assessing discrimination in the logistic regression model
Royston, P. J., & Altman, D. G. (2010) · Statistics in Medicine · doi:10.1002/sim.3994 · Cited by 116
Demler, O., Pencina, M. J., & D’Agostino, R. B. (2011) · Statistics in Medicine · doi:10.1002/sim.4196 · Cited by 35
Research works printed but not linked: 2
- Cohen J: Statistical Power Analysis for the Behavioural Sciences. 1988, Lawrence Erlbaum Associates, Hillsdale, NJ, 2
- Tu JV, Donovan LR, Lee DS, Austin PC, Ko DT, Wang JT, et al: Quality of Cardiac Care in Ontario. 2004, Institute for Clinical Evaluative Sciences, Toronto, Ontario
Cited by
Sorted by citations
Biccard, B. M., Madiba, T. E., Kluyts, H.-L., Munlemvo, D. M., Madzimbamuto, F. D., Basenero, A., Gordon, C. S., Youssouf, C., Rakotoarison, S. R., Gobin, V., et al. (2018) · The Lancet · doi:10.1016/s0140-6736(18)30001-1 · Cited by 580
Austin, P. C., & Steyerberg, E. W. (2017) · Statistical Methods in Medical Research · doi:10.1177/0962280214558972 · Cited by 516
Self-citationMinimum sample size for external validation of a clinical prediction model with a binary outcome
Riley, R. D., Debray, T. P. A., Collins, G. S., Archer, L., Ensor, J., van Smeden, M., & Snell, K. I. E. (2021) · Statistics in Medicine · doi:10.1002/sim.9025 · Cited by 400
Austin, P. C., & Steyerberg, E. W. (2014) · Statistics in Medicine · doi:10.1002/sim.5941 · Cited by 362
Self-citationCarrington, A., Manuel, D. G., Fieguth, P., Ramsay, T., Osmani, V., Wernly, B., Bennett, C., Hawken, S., Magwood, O., Sheikh, Y., et al. (2022) · IEEE Transactions on Pattern Analysis and Machine Intelligence · doi:10.1109/tpami.2022.3145392 · Cited by 422
Metadata
- Authors
- Austin, P. C., & Steyerberg, E. W.
- Affiliations
- Institute for Clinical Evaluative Sciences (CA)
- Erasmus MC (NL)
- Corresponding author
- Austin, Peter C
- Venue
- BMC Medical Research Methodology
- Published
- 2012-06-20
- Volume
- 12
- Issue
- 1
- Pages
- 82-82
- ISSN
- 1471-2288 (ISSN-L)
- PMC
- PMC3528632
- OpenAlex
- W2112200626
- Cited by
- 270
- References
- 23
- Citations by year
- 2026: 17 · 2025: 16 · 2024: 25 · 2023: 29 · 2022: 26 · 2021: 17 · 2020: 30 · 2019: 20 · 2018: 19 · 2017: 28 · 2016: 17 · 2015: 12 · 2014: 7 · 2013: 7
- FWCI
- 7.93
- Type
- journal article
- Language
- en
- Open access
- gold
- doi.org
- Licence
- Locations
- BMC Medical Research Methodology (publishedVersion, cc-by)
- Europe PMC (PubMed Central) (publishedVersion, cc-by)
- PubMed Central (publishedVersion, cc-by)
- PubMed (publishedVersion)
- EUR Research Repository (Erasmus University Rotterdam) (acceptedVersion, other-oa)
- TSpace (University of Toronto) (submittedVersion)
- EUR Research Repository (Erasmus University Rotterdam) (submittedVersion, other-oa)
- RePub (Erasmus University Rotterdam) (submittedVersion, other-oa)
- DOAJ (DOAJ: Directory of Open Access Journals) (submittedVersion)
- Funders
- Heart and Stroke Foundation of Canada
- Institute for Clinical Evaluative Sciences
- Ontario Ministry of Health and Long-Term Care
- Canadian Institutes of Health Research (86508, MOP86508)
- Topics
- Physical Sciences › Mathematics › Statistics and Probability › Statistical Methods in Epidemiology
- Social Sciences › Decision Sciences › Statistics, Probability and Uncertainty › Meta-analysis and systematic reviews
- Physical Sciences › Computer Science › Artificial Intelligence › Imbalanced Data Classification Techniques
- Keywords
- area under the ROC curve, logistic regression, odds ratio, heteroscedasticity, prediction accuracy, discriminatory power, non-normal distributions, gamma distribution, lognormal distribution, uniform distribution
- MeSH terms
- Age Factors, Analysis of Variance, Data Interpretation, Statistical, Humans, Monte Carlo Method, Myocardial Infarction, ROC Curve, Logistic Models, Odds Ratio
About these checks
Registry, retraction, Cites and statistics results are computed, not judged, with one exception: a printed reference that no index lists is read once by a model before it counts as a citation error. Claims are extracted by a model and kept only when their quote appears verbatim in the text; each cited source is then checked, with a model’s help, for whether it says what the claim relies on. Those verdicts can be wrong — read the claim’s quote and the cited source before relying on one.
Statistics and arithmetic are recomputed, not judged.
Confidence bands are shown only for fields calibrated on our annotated test set. None is calibrated yet, so no band is shown.
What counts as a claim ›How we measure confidence ›How we check this ›
Are you an author, or do you see a problem with this page? Request a review
