

The DOI matches its Crossref record; 49 of the 51 references it cites were found in a registry or an index.
Neonatal mortality in Ethiopia: trends and determinants
Open accessAbstract
BACKGROUND: The Ethiopian neonatal mortality rate constitutes 42% of under-5 deaths. We aimed to examine the trends and determinants of Ethiopian neonatal mortality. METHODS: We analyzed the birth history information of live births from the 2000, 2005 and 2011 Ethiopia Demographic and Health Surveys (DHS). We used simple linear regression analyses to examine trends in neonatal mortality rates and a multivariate Cox proportional hazards regression model using a hierarchical approach to examine the associated factors. RESULTS: The neonatal mortality rate declined by 1.9% per annum from 1995 to 2010, logarithmically. The early neonatal mortality rate declined by 0.9% per annum and was where 74% of the neonatal deaths occurred. Using multivariate analyses, increased neonatal mortality risk was associated with male sex (hazard ratio (HR) = 1.38; 95% confidence interval (CI), 1.23 - 1.55); neonates born to mothers aged < 18 years (HR = 1.41; 95% CI, 1.15 - 1.72); and those born within 2 years of the preceding birth (HR = 2.19; 95% CI, 1.89 - 2.51). Winter birth increased the risk of dying compared with spring births (HR = 1.28; 95% CI, 1.08 - 1.51). Giving two Tetanus Toxoid Injections (TTI) to the mothers before childbirth decreased neonatal mortality risk (HR = 0.44; 95% CI, 0.36 - 0.54). Neonates born to women with secondary or higher schooling vs. no education had a lower risk of dying (HR = 0.68; 95% CI, 0.49 - 0.95). Compared with neonates in Addis Ababa, neonates in Amhara (HR: 1.88; 95% CI: 1.26 - 2.83), Benishangul Gumuz (HR: 1.75; 95% CI: 1.15 - 2.67) and Tigray (HR: 1.54; 95% CI: 1.01 - 2.34) regions carried a significantly higher risk of death. CONCLUSIONS: Neonatal mortality must decline more rapidly to achieve the Millennium Development Goal (MDG) 4 target for under-5 mortality in Ethiopia. Strategies to address neonatal survival require a multifaceted approach that encompasses health-related and other measures. Addressing short birth interval and preventing early pregnancy must be considered as interventions. Programs must improve the coverage of TTI and prevention of hypothermia for winter births should be given greater emphasis. Strategies to improve neonatal survival must address inequalities in neonatal mortality by women's education and region.
Overview
The claims and statistics of this paper haven’t been checked yet.
Run the check — free, no account needed. It reads the open-access text and checks the sources it cites.
Integrity signals
Registry
Cites
Statistics
Figures
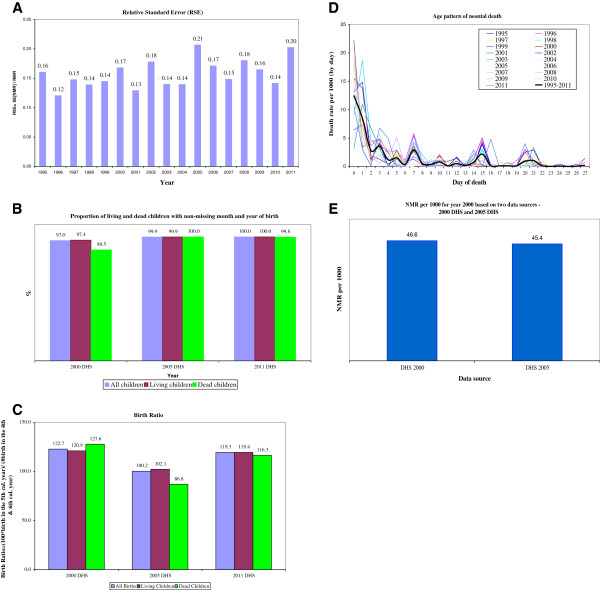
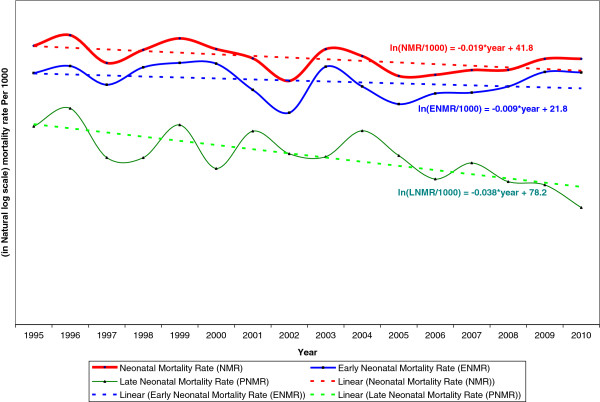
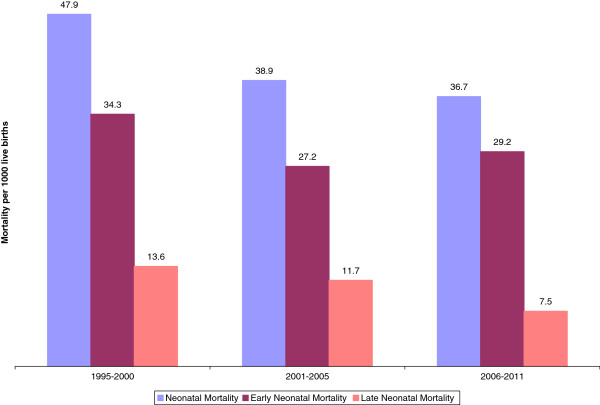
Verification
Claims the paper makes
The claims and statistics of this paper haven’t been checked yet.
Run the check — free, no account needed. It reads the open-access text and checks the sources it cites.
Self-check
Percentages, sums and reported differences re-computed from the paper’s own numbers.
The self-check needs the paper’s full text.
Citations
Cites
Ethiopia demographic and health survey, 2000
Central Statistical Agency, & Ethiopia (2017) · Cited by 3,873
4 million neonatal deaths: When? Where? Why?
Lawn, J. E., Cousens, S., & Zupan, J. (2005) · The Lancet · doi:10.1016/s0140-6736(05)71048-5 · Cited by 3,670
The role of conceptual frameworks in epidemiological analysis: a hierarchical approach.
Victora, C. G., HUTTLY, S. R. A., Fuchs, S. C. P. C., & Olinto, M. T. A. (1997) · International Journal of Epidemiology · doi:10.1093/ije/26.1.224 · Cited by 2,408
An Analytical Framework for the Study of Child Survival in Developing Countries
Mosley, W. H., & Chen, L.-C. (1984) · Population and Development Review · doi:10.2307/2807954 · Cited by 1,490
Education as a Factor in Mortality Decline An Examination of Nigerian Data
Caldwell, J. C. (1979) · Population Studies · doi:10.2307/2173888 · Cited by 1,099
Bhutta, Z. A., Darmstadt, G. L., Hasan, B. S., & Haws, R. A. (2005) · PEDIATRICS · doi:10.1542/peds.2004-1441 · Cited by 707
Rutstein, S. O. (2005) · International Journal of Gynecology & Obstetrics · doi:10.1016/j.ijgo.2004.11.012 · Cited by 668
An analytical framework for the study of child survival in developing countries. 1984.
Mosley, W. H., & Chen, L.-C. (2003) · PubMed · Cited by 566
4 million neonatal deaths: When? Where? Why? Neonatal survival 1.
Je, L., Cousens, S., & Zupan, J. (2005) · The Lancet · Cited by 507
Oestergaard, M. Z., Inoue, M., Yoshida, S., Mahanani, W. R., Gore, F. M., Cousens, S., Lawn, J. E., Mathers, C. D., & on behalf of the United Nations Inter-agency Group for Child Mortality Estimation and the Child Health Epidemiology Reference Group (2011) · PLoS Medicine · doi:10.1371/journal.pmed.1001080 · Cited by 481
Research works printed but not linked: 8
- World Health Organization: Estimates. State of the World’s Newborns. 2001, Washington, DC: Saving Newborn Lives, Save the Children/ USA, 1-49.
- Central Statistical Agency [Ethiopia]: Populating and housing census of Ethiopia. 2007, Ethiopia: Central Statistical Agency
- Central Statistical Authority and ICF International: Ethiopia Demographic and Health Survey 2011. 2012, Addis Ababa, Ethiopia and Calverton, Maryland, USA: Central Statistical Agency
- Mulligan B, Degefie T, Tensou B, Matios B: Levels, Timing and Causes of Neonatal Mortality in Rural Ethiopian Communities. 13th World health congress on public health, Addis Ababa, April 23–27. 2012, Ethiopian Public Health Association
- Central Statistical Authority [Ethiopia] and ORC Macro: Ethiopia Demographic and Health Survey 2005. 2006, Addis Ababa, Ethiopia and Calverton, Maryland, USA:
- Obungu W, Kizito P, Bicego GT: Macro International. Institute for Resource Development. Demographic and Health, Trends, age patterns, and determinants of early childhood mortality in Kenya. DHS Further Analysis No. 12. 1994, Macro International Inc: Calverton, Maryland
- Motherhood S: Mother-Baby Package: Implementing safe motherhood in countries. 1994, Geneva, Switzerland: WHO/FHE/MSM/94.11
- World Health Organization, Thermal Protection of the Newborn: A Practical Guide. Report No.: WHO/RHT/MSM/97.2. 1997, Geneva: World Health Organization
Cited by
Sorted by citations
Items 101–200 of 232
Msatfa, N., Baidani, A., Mourajid, Y., Chebabe, M., & Hilali, A. (2024) · Pediatric Reports · doi:10.3390/pediatric16030059 · Cited by 13
Budu, E., Ahinkorah, B. O., Ameyaw, E. K., Seidu, A., Zegeye, B., & Yaya, S. (2021) · BioMed Research International · doi:10.1155/2021/5516257 · Cited by 13
Desta, B. N., Assefa, N., Digaffe, T., & Oljira, L. (2022) · Epidemiology Biostatistics and Public Health · doi:10.2427/11938 · Cited by 13
Desta, M., Akalu, T. Y., Alamneh, Y. M., Talie, A., Alemu, A. A., Wolie, Z. T., Yibeltal, D., Alamneh, A. A., Ketema, D. B., Shiferaw, W. S., et al. (2021) · Scientific Reports · doi:10.1038/s41598-021-98996-5 · Cited by 15
Koroma, M. M., Kabba, J. A., Wanda, J., Yu, J., Zhou, F., Liang, Z., Tarawally, A., Chigoneka, K., & Dai, Y. (2022) · Health Policy and Planning · doi:10.1093/heapol/czac070 · Cited by 12
Factors Associated with Infant Mortality in Malawi
Ntenda, P. A. M., Chuang, K., Tiruneh, F. N., & Chuang, Y. (2014) · Journal of Experimental & Clinical Medicine · doi:10.1016/j.jecm.2014.06.005 · Cited by 12
Ibrahim, A. M., Farah, A. M., Osman, M. O., & Hashi, A. (2021) · Research and Reports in Neonatology · doi:10.2147/rrn.s297470 · Cited by 12
Fagbamigbe, A. F., Salawu, M. M., Abatan, S. M., & Ajumobi, O. O. (2021) · Scientific Reports · doi:10.1038/s41598-021-92606-0 · Cited by 12
Msanga, D. R., Parpia, F., Konje, E. T., Hokororo, A., & Mshana, S. E. (2021) · Children · doi:10.3390/children8111037 · Cited by 11
Does quality of antenatal care influence antepartum stillbirth in Hossana City, South Ethiopia?
Berhe, T. T., Modiba, L. M., Sahile, A. T., & Tedla, G. W. (2023) · PLOS Global Public Health · doi:10.1371/journal.pgph.0001468 · Cited by 10
Lamesgen, A., Minyihun, A., & Amare, T. (2022) · PLoS ONE · doi:10.1371/journal.pone.0277826 · Cited by 10
Zaman, S. B., Hossain, N., Hussain, M. A., Abimanue, V., Jahan, N., Zaman, R. B., Ratan, Z. A., Khan, R. K., & Sharmin, S. (2017) · Public Health of Indonesia · doi:10.36685/phi.v3i2.121 · Cited by 10
Fentaw, K. D., Fenta, S. M., Biresaw, H. B., & Yalew, M. M. (2022) · PLoS ONE · doi:10.1371/journal.pone.0272016 · Cited by 9
Les déterminants de la mortalité néonatale précoce à la maternité Issaka-Gazobi de Niamey
Garba, M., Kamaye, M., Alido, S., Zoubeirou, H., Oumarou, Z., & Amadou, A. (2017) · Journal de Pédiatrie et de Puériculture · doi:10.1016/j.jpp.2017.01.005 · Cited by 9
Dessu, S., Kote, M., Gebremeskel, F., & Girum, T. (2019) · Ethiopian Journal of Health Development · Cited by 9
Abera, T., Bayisa, L., Bekele, T., Dessalegn, M., Mulisa, D., & Gamtessa, L. C. (2021) · Global Pediatric Health · doi:10.1177/2333794x211030157 · Cited by 9
Derese, T., Belay, Y., & Tariku, Z. (2020) · doi:10.21203/rs.3.rs-22899/v1 · Cited by 9
Sako, S., Gilano, G., Tekabe, B., & Abebe, S. (2022) · BMJ Open · doi:10.1136/bmjopen-2022-062905 · Cited by 8
Neonatal mortality clustering in the central districts of Ghana
Adjei, G., Darteh, E. K. M., & Doku, D. T. (2021) · PLoS ONE · doi:10.1371/journal.pone.0253573 · Cited by 8
Uwimana, G., Elhoumed, M., Gebremedhin, M. A., Qi, Q., Azalati, M. M., Wang, L., & Zeng, L. (2023) · BMC Health Services Research · doi:10.1186/s12913-023-10345-6 · Cited by 8
Debere, H. R., & Adjiwanou, V. (2024) · Reproductive Health · doi:10.1186/s12978-023-01734-5 · Cited by 8
Socio-demographic determinants of neonatal mortality in Algeria according to MICS4 data (2012-2013)
Sidi-Yakhlef, A., Boukhelif, M., & Metri, A. A. (2021) · African Health Sciences · doi:10.4314/ahs.v21i1.45 · Cited by 8
Abate, B. B., Kassie, A. M., Kassaw, M. W., & Reta, M. A. (2019) · doi:10.21203/rs.2.16426/v1 · Cited by 8
Hagos, B. T., & Gebrerufael, G. G. (2024) · PLoS ONE · doi:10.1371/journal.pone.0304662 · Cited by 7
Teferi, M., Teferi, M., & Ayalew, A. (2020) · Archives of Community Medicine and Public Health · doi:10.17352/2455-5479.000086 · Cited by 7
Effect of Parity on Neonatal Mortality in Indonesia
Siahaan, A., & Ariawan, I. (2021) · Jurnal Ilmu Kesehatan Masyarakat · doi:10.26553/jikm.2021.12.3.250-262 · Cited by 7
Guta, N. M. (2022) · BMC Pediatrics · doi:10.1186/s12887-022-03638-y · Cited by 13
Tiruye, G., & Shiferaw, K. (2023) · Maternal and Child Health Journal · doi:10.1007/s10995-023-03765-7 · Cited by 6
Gebremichael, M. W., Tsadik, M., Abebe, H. T., Gebreegzabiher, A., Beyene, S., Berhe, A. A., & Weldemariam, S. (2023) · Global Health Action · doi:10.1080/16549716.2023.2289710 · Cited by 6
Epidemiological Aspects of Neonatal Mortality Due To Intrauterine Infection in Kazakhstan.
Mamyrbayeva, M. A., Igissinov, N., Zhumagaliyeva, G., & Shilmanova, A. (2015) · Europe PMC (PubMed Central) · Cited by 6
Beyene, G. M., Azale, T., Gelaye, K. A., & Ayele, T. A. (2022) · Heliyon · doi:10.1016/j.heliyon.2022.e08759 · Cited by 6
Endalamaw, A., Minuye, B., Mengistie, B., Yeshambel, A., & Assefa, N. (2019) · Research Square · doi:10.21203/rs.2.10832/v1 · Cited by 6
Dereje, T., Abuhay, T. M., Letta, A., & Mengstie, M. A. (2021) · International Conference on Information and Communication Technology for Development for Africa (ICT4DA) · doi:10.1109/ict4da53266.2021.9671271 · Cited by 5
Determinants of Infant Mortality in Indonesia
Febriyuna, N. (2015) · Cited by 5
The Role of Maternal Intimate Partner Violence Victimization on Neonatal Mortality in Ethiopia
Tiruye, T. Y., Chojenta, C., Harris, M. L., Holliday, E. G., & Loxton, D. J. (2020) · Journal of Interpersonal Violence · doi:10.1177/0886260519897331 · Cited by 5
Gody, J. C., Moyen, E., Mejiozem, B. O. B., Danebera, L. V., Kakounguere, E. P. B., Bangue, M. C. N., Nguinzanemou, C. J. K., Kpembi, R. B. D. D. K., Waraka, P., Mbode, D. L. N., et al. (2021) · Open Journal of Pediatrics · doi:10.4236/ojped.2021.114079 · Cited by 5
Lower Platelet-to-Lymphocyte Ratio Was Associated with Poor Prognosis for Newborn Patients in NICU
Tang, Y., Teng, Y., Xu, L., Xu, G., Chen, D., Jin, X., Li, W., Jin, X., Zhu, W., Hu, B., et al. (2022) · Medicina · doi:10.3390/medicina58101397 · Cited by 5
The Effect of Maternal Education on Under-five Mortality in Ethiopia
Hassen, K. Y. (2014) · Cited by 5
Fantahun, B., & Nurussen, I. (2020) · doi:10.21203/rs.3.rs-37914/v1 · Cited by 5
Mengstie, L. A., Teklehaimanot, W. Z., Gebeyehu, M. T., Abemie, W., Ayfokru, A., Dessie, Y. A., Tefera, M., & Girma, B. (2025) · Frontiers in Pediatrics · doi:10.3389/fped.2025.1458871 · Cited by 4
Debele, G. R., Siraj, S. Z., Tsegaye, D., & Temesgen, E. (2022) · Frontiers in Public Health · doi:10.3389/fpubh.2022.923408 · Cited by 4
Dadi, A. F. (2014) · Science Journal of Public Health · doi:10.11648/j.sjph.20140206.24 · Cited by 4
Kassaw, M. W., Abebe, A. M., Abate, B. B., Masresha, S. A., Kassie, A. M., & Adisu, M. A. (2021) · BMC Pregnancy and Childbirth · doi:10.1186/s12884-021-03681-0 · Cited by 4
A nomogram to predict in-hospital mortality of neonates admitted to the intensive care unit
Huang, X., Liang, Z., Li, T., Lingna, Y., Zhu, W., & Li, H. (2021) · International Health · doi:10.1093/inthealth/ihab012 · Cited by 4
Beyene, A. S., Chojenta, C., Smith, R., & Loxton, D. J. (2022) · BMC Pediatrics · doi:10.1186/s12887-021-03058-4 · Cited by 4
Chanie, E. S., Engedaw, D., Eyayu, T., Admasu, F. T., Dejen, E., Azanaw, K. A., Kassaw, A., Feleke, D. G., Ayehu, G. W., Jimma, M. S., et al. (2022) · BMJ Open · doi:10.1136/bmjopen-2022-061385 · Cited by 4
Jain, M., Meshram, P., Bang, A., Chauhan, V., Datta, V., & Dhanireddy, R. (2024) · BMJ Open Quality · doi:10.1136/bmjoq-2022-001869 · Cited by 4
Socio-economic and geographical inequalities in neonatal mortality rates in Sierra Leone, 2008–2019
Osborne, A., Bai-Sesay, A. U., Bangura, C., Rogers, H., & Ahinkorah, B. O. (2024) · BMC Pediatrics · doi:10.1186/s12887-024-05189-w · Cited by 7
Ali, M. M., Kwatra, G., Mengistu, M., Kijineh, B., Hailemeriam, T., Worku, E., Fenta, D. A., Lambiyo, T., Reda, D. Y., & Alemayehu, T. (2025) · BMC Pediatrics · doi:10.1186/s12887-025-05515-w · Cited by 3
Mengstie, L. A., Gebeyehu, M. T., Teklehaimanot, W. Z., Shiferaw, W. S., Kebede, T. N., Abemie, W., & Girma, B. (2025) · Frontiers in Pediatrics · doi:10.3389/fped.2025.1524966 · Cited by 3
Getahun, G. K., Beyene, M., Afework, T., Desalegn, M., Jemberie, S. S., & Shitemaw, T. (2024) · Frontiers in Pediatrics · doi:10.3389/fped.2024.1352270 · Cited by 3
Hamza, H. A., Mohammed, A. A., Mohammed, S., & Shaka, M. F. (2024) · Public Health in Practice · doi:10.1016/j.puhip.2024.100515 · Cited by 3
Tekeba, B., Techane, M. A., Workneh, B. S., Zegeye, A. F., Gonete, A. T., Alemu, T. G., Wassie, M., Kassie, A. T., Ali, M. S., Mekonen, E. G., et al. (2024) · Frontiers in Pediatrics · doi:10.3389/fped.2024.1390952 · Cited by 3
Maternal Education Household’s Wealth and Child Mortality in Rural Nigeria
Ashagidigbi Waheed, M., Adewumi Oluwatosin, B., Olagunju Kehinde, O., & Ogunniyi, A. I. (2018) · Journal of Nutritional Biology · doi:10.18314/jnb.v4i2.1347 · Cited by 3
Mayowa, B. A., Maxwell, O., Osuji, G. A., & Chinedu, I. U. (2018) · American journal of mathematics and statistics · Cited by 3
Etiologies of Neonatal Mortality in a Tertiary Care Hospital in a Resource-Limited Setting
Penda, C. I., Betoko, R. M., Koum, D. C. K., Henri, E., Eboumbou, P. É., Edimo, C. M., Bille, B. E., Eposse, C. E., & Ndombo, O. K. (2021) · Open Journal of Pediatrics · doi:10.4236/ojped.2021.112026 · Cited by 3
da Cruz, L. P., Alves, I. D. N., Nogueira, J. D. S., & Fachin, L. P. (2022) · Brazilian Journal of Health Review · doi:10.34119/bjhrv5n2-291 · Cited by 3
Birhane, B. M., Assefa, N., Endalamaw, A., Alemu, A. Y., & Mengistie, B. (2022) · Journal of Neonatal Nursing · doi:10.1016/j.jnn.2022.07.022 · Cited by 3
Olukade, T. O., & Uthman, O. A. (2022) · Children · doi:10.3390/children9081260 · Cited by 3
Bang, K., Lee, I., Chae, S. M., Yu, J., Park, J., & Kim, H. (2014) · Child Health Nursing Research · doi:10.4094/chnr.2014.20.4.275 · Cited by 3
Variáveis associadas à mortalidade infantil: uma revisão integrativa
Sartorelli, A. P., Cubas, M. R., & Carvalho, D. R. (2020) · Revista Stricto Sensu · doi:10.24222/2525-3395.2020v5n1p059 · Cited by 3
Çelik, E., & Öztürk, A. (2021) · Cureus · doi:10.7759/cureus.17790 · Cited by 3
Bitew, G., Teshome, D. F., & Lakew, A. M. (2020) · doi:10.21203/rs.3.rs-15617/v1 · Cited by 3
Dargaso, Y. D., Tunta, T. O., & Kabalo, B. Y. (2019) · Research Square · doi:10.21203/rs.2.15580/v1 · Cited by 3
Shacho, E., Ambelu, A. B., Goshu, A. T., & Yilma, D. (2024) · BMC Infectious Diseases · doi:10.1186/s12879-024-10069-w · Cited by 2
Jemal, M., Kemal, A., Mohammed, B. D., Bedru, D., & Kedir, S. (2024) · Frontiers in Pediatrics · doi:10.3389/fped.2024.1426901 · Cited by 2
Risk Factors for Neonatal Mortality in Rural Iganga District, Eastern Uganda: A Case Control Study
Ndyomugyenyi, D. B., Nabukeera, B., Natukwatsa, D., Barageine, J. K., & Kajungu, D. (2023) · East African Health Research Journal · doi:10.24248/eahrj.v7i2.730 · Cited by 2
Tadesse, M., Habtamu, A., Degefa, M. B., Feyisa, H. L., Yihdego, H., Hailu, H., Alemnew, H., & Marara, G. (2024) · Journal of Pediatrics & Neonatal Care · doi:10.15406/jpnc.2024.14.00547 · Cited by 2
Zegeye, A. F., Asmamaw, D. B., Negash, W. D., Belachew, T. B., Fentie, E. A., Kidie, A. A., Amare, T., Fetene, S. M., Addis, B., Wubante, S. M., et al. (2025) · Frontiers in Pediatrics · doi:10.3389/fped.2025.1380913 · Cited by 2
Dozier, J. L., Wood, S. N., Perrin, N., Shiferaw, S., Yirgu, R., & Zimmerman, L. A. (2025) · Pregnancy · doi:10.1002/pmf2.70079 · Cited by 2
Neonatal mortality rates at Al-Sadar city 2015 – 2019
Rasheed, H. A., Jadiry, H. A., & Al-Kaseer, E. A. (2022) · Technium BioChemMed · doi:10.47577/biochemmed.v3i2.6430 · Cited by 2
THE IMPACT OF FORMAL MATERNAL EDUCATION ON CHILD SURVIVAL IN GHANA
Laari, S., & Takahashi, S. (2021) · Global Journal of Health Sciences · doi:10.47604/gjhs.1418 · Cited by 2
Kateule, E. (2022) · Epidemiology International Journal · doi:10.23880/eij-16000233 · Cited by 2
Wagaw, M. (2019) · Unisa Institutional Repository (University of South Africa) · Cited by 2
Sampurna, M. T. A., Mapindra, M. P., Mahindra, M. P., Efendi, F., Etika, R., Utomo, M. T., Angelika, D., Handayani, K. D., & Harianto, A. (2021) · Research Square · doi:10.21203/rs.3.rs-290158/v1 · Cited by 2
Soft, all-in-one, nanomembrane wearable system for advancing neonatal health monitoring in Ethiopia
Zhou, L., Joseph, M., Lee, Y. J., Yadav, D., Nayak, L., Woodall, J., Matthews, J., Soltis, I., Mekuria, F. M., Yeshanew, K. H., et al. (2025) · npj Digital Medicine · doi:10.1038/s41746-025-01974-8 · Cited by 3
Modeling Infant Mortality Risk Factors using Logistic Regression Model and Spatial Analysis in Kenya
Kirui, E. C., Luchemo, E., & Anapapa, A. (2021) · Asian Journal of Probability and Statistics · doi:10.9734/ajpas/2021/v13i130297 · Cited by 1
Feleke, D. G., Chanie, E. S., Yimam, A. M., Tassew, S. F., Alemu, D. K. D., Wassie, F. D., Eyayu, D., Gietaneh, W., Tiruneh, A., Yetneberk, T., et al. (2021) · Journal of Neonatal Nursing · doi:10.1016/j.jnn.2021.10.010 · Cited by 1
Kassie, A., Kassie, M., Bantie, B., Bogale, T. W., & Aynalem, Z. B. (2023) · Clinical Medicine Insights Pediatrics · doi:10.1177/11795565231187500 · Cited by 1
Wolde, H. (2023) · Journal of Clinical Images and Medical Case Reports · doi:10.52768/2766-7820/2594 · Cited by 1
Abubakari, F., Faisal, A., & Asuma, M. J. (2026) · BMC Public Health · doi:10.1186/s12889-026-27768-5 · Cited by 1
The relationship between resettlement and birth rates: The case of Gambella, Ethiopia
Adugna, A., & Kloos, H. (2016) · Ethiopian Journal of Health Sciences · doi:10.4314/ejhs.v26i4.8 · Cited by 1
Hubungan Pekerjaan Di Pabrik Rokok danPerilaku Hidup Bersih Sehat Ibu Terhadap Kematian Bayi
Mustaghfiroh, L., Effendi, J. S., Husin, F., Wirakusumah, F. F., Setiawati, E. P., & Usman, A. (2017) · Jurnal Pendidikan dan Pelayanan Kebidanan Indonesia · doi:10.24198/ijemc.v1i1.83 · Cited by 1
Rarani, M. A., Rashidian, A., Bayati, M., & Morasae, E. K. (2020) · Iranian Journal of Public Health · doi:10.18502/ijph.v48i8.2989 · Cited by 1
Imbo, E., Kamau‐Mbuthia, E. W., & Ngotho, D. (2019) · Journal of Health, Medicine and Nursing · doi:10.7176/jhmn/65-06 · Cited by 1
Situational Analysis on the Impact of Perinatal Deaths Among Bereaved Families in Ghana
Bogee, G. P., Sagoe‐Moses, I., Adongo, E. A., Kuma‐Aboagye, P., Wobil, P., Shetye, M., Kwarteng, P. G., Denckla, C. A., & Guure, C. B. (2023) · OMEGA - Journal of Death and Dying · doi:10.1177/00302228221138992 · Cited by 2
Asratie, M. H., Tesema, G. A., Chilot, D., Aragaw, F. M., Merid, M. W., & Belay, D. G. (2023) · Frontiers in Global Women s Health · doi:10.3389/fgwh.2023.1131143 · Cited by 1
Gebrerufael, G. G., Welegebrial, B. G., & Teklezgi, M. G. (2024) · PLoS ONE · doi:10.1371/journal.pone.0315400 · Cited by 1
Aregbeshola, B. S., & Khan, S. M. (2018) · American journal of public health research · doi:10.12691/ajphr-6-1-2 · Cited by 1
Soumyashree, M. N., Viveki, R. G., & Halki, S. (2019) · International Journal of Community Medicine and Public Health · doi:10.18203/2394-6040.ijcmph20190609 · Cited by 1
Determinants of High Neonatal Mortality Rates in Migori County Referral Hospital in Kenya
Masaba, B. B., & Mmusi-Phetoe, R. (2019) · International Journal of Nursing Education · doi:10.5958/0974-9357.2019.00115.6 · Cited by 1
Ashenafi, W., Mengistie, B., Egata, G., & Berhane, Y. (2020) · Research Square · doi:10.21203/rs.3.rs-58851/v2 · Cited by 1
Predictors of neonatal mortality in Ghana: evidence from 2017 Ghana Maternal Health SurveyPreprint
Adongo, E. A., & Ganle, J. K. (2021) · Research Square · doi:10.21203/rs.3.rs-1051118/v1 · Cited by 1
Demis, S., Munye, T., & Munye, B. (2021) · Research Square · doi:10.21203/rs.3.rs-147885/v1 · Cited by 1
Deressa, A. T., Mekonnen, S., Yeba, Z., Mekonnen, E., & Assefa, S. (2019) · Research Square · doi:10.21203/rs.2.15249/v1 · Cited by 1
The Health of Nations: Three Essays In Health Economics
Kayembe, L. (2014) · uO Research (University of Ottawa) · doi:10.20381/ruor-6534
Equitable access to life-saving child health care: an equity lens for Ethiopia
Abbe, K. M. (2017) · Unisa Institutional Repository (University of South Africa)
Risk Factors of Neonatal Mortality Incidence in Muna Regency in 2014
Yudrika, A., Zulkifli, A., & Muis, M. (2018) · International Conference on Medical and Health Informatics (ICMHI) · doi:10.1145/3239438.3239489
Schooling and immunization of orphaned children in Swaziland
Lee, Y.-R. (2016) · KDI Central Archives (Korea Development Institute)
Sharma, R., Thakur, P., & Basit, M. (2019) · International Journal of Paediatrics and Geriatrics · doi:10.33545/26643685.2019.v2.i2a.32
Metadata
- Authors
- Mekonnen, Y., Tensou, B., Telake, D. S., Degefie, T., & Bekele, A.
- Affiliations
- Save the Children (US)
- United Nations Children's Fund (US)
- Corresponding author
- Mekonnen, Yared
- ORCID
- Mekonnen, Yared
- Venue
- BMC Public Health
- Published
- 2013-05-17
- Volume
- 13
- Issue
- 1
- Pages
- 483-483
- ISSN
- 1471-2458 (ISSN-L)
- PMC
- PMC3659057
- OpenAlex
- W2055079578
- Cited by
- 234
- References
- 51
- Citations by year
- 2026: 6 · 2025: 9 · 2024: 18 · 2023: 17 · 2022: 30 · 2021: 35 · 2020: 39 · 2019: 23 · 2018: 16 · 2017: 14 · 2016: 13 · 2015: 4 · 2014: 10
- FWCI
- 8.29
- Type
- journal article
- Language
- en
- Open access
- gold
- doi.org
- Licence
- Locations
- BMC Public Health (publishedVersion, cc-by)
- Europe PMC (PubMed Central) (publishedVersion, cc-by)
- PubMed Central (publishedVersion, cc-by)
- PubMed (publishedVersion)
- Topics
- Health Sciences › Medicine › Pediatrics, Perinatology and Child Health › Global Maternal and Child Health
- Health Sciences › Medicine › Pediatrics, Perinatology and Child Health › Maternal and Neonatal Healthcare
- Health Sciences › Medicine › Pediatrics, Perinatology and Child Health › Infant Development and Preterm Care
- Keywords
- Ethiopia, mortality trends, early neonatal mortality, risk factors, season of birth, maternal education, maternal age, parity, sex differences, regional disparities, under-five mortality, Addis Ababa, Amhara, Benishangul-Gumuz, Tigray
- MeSH terms
- Adolescent, Adult, Birth Intervals, Ethiopia, Female, Humans, Infant, Infant Mortality, Infant, Newborn, Male, Middle Aged, Pregnancy, Prenatal Care, Risk Factors, Healthcare Disparities
About these checks
Registry, retraction, Cites and statistics results are computed, not judged, with one exception: a printed reference that no index lists is read once by a model before it counts as a citation error. Claims are extracted by a model and kept only when their quote appears verbatim in the text; each cited source is then checked, with a model’s help, for whether it says what the claim relies on. Those verdicts can be wrong — read the claim’s quote and the cited source before relying on one.
Statistics and arithmetic are recomputed, not judged.
Confidence bands are shown only for fields calibrated on our annotated test set. None is calibrated yet, so no band is shown.
What counts as a claim ›How we measure confidence ›How we check this ›
Are you an author, or do you see a problem with this page? Request a review
