

The DOI matches its Crossref record; 61 of the 61 references it cites were found in a registry or an index.
Raman imaging at biological interfaces: applications in breast cancer diagnosis
Open accessAbstract
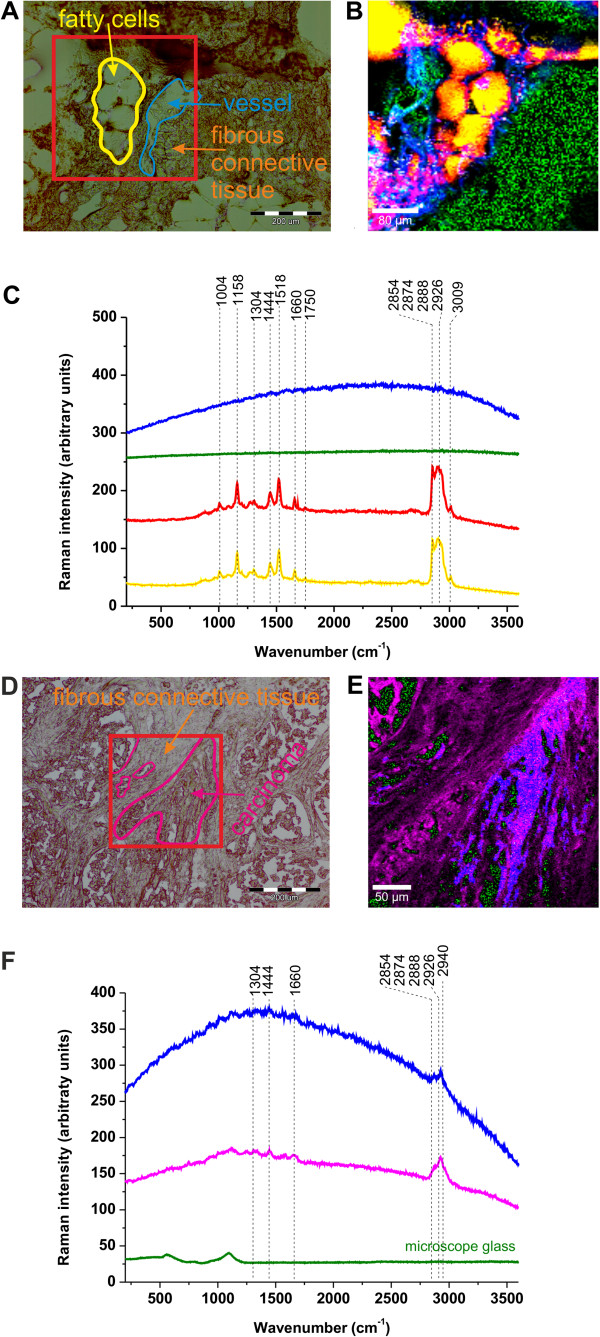
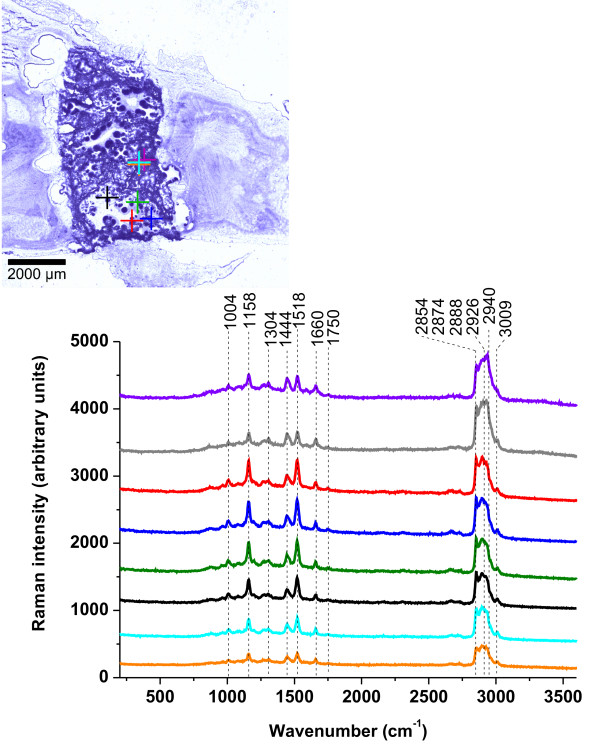
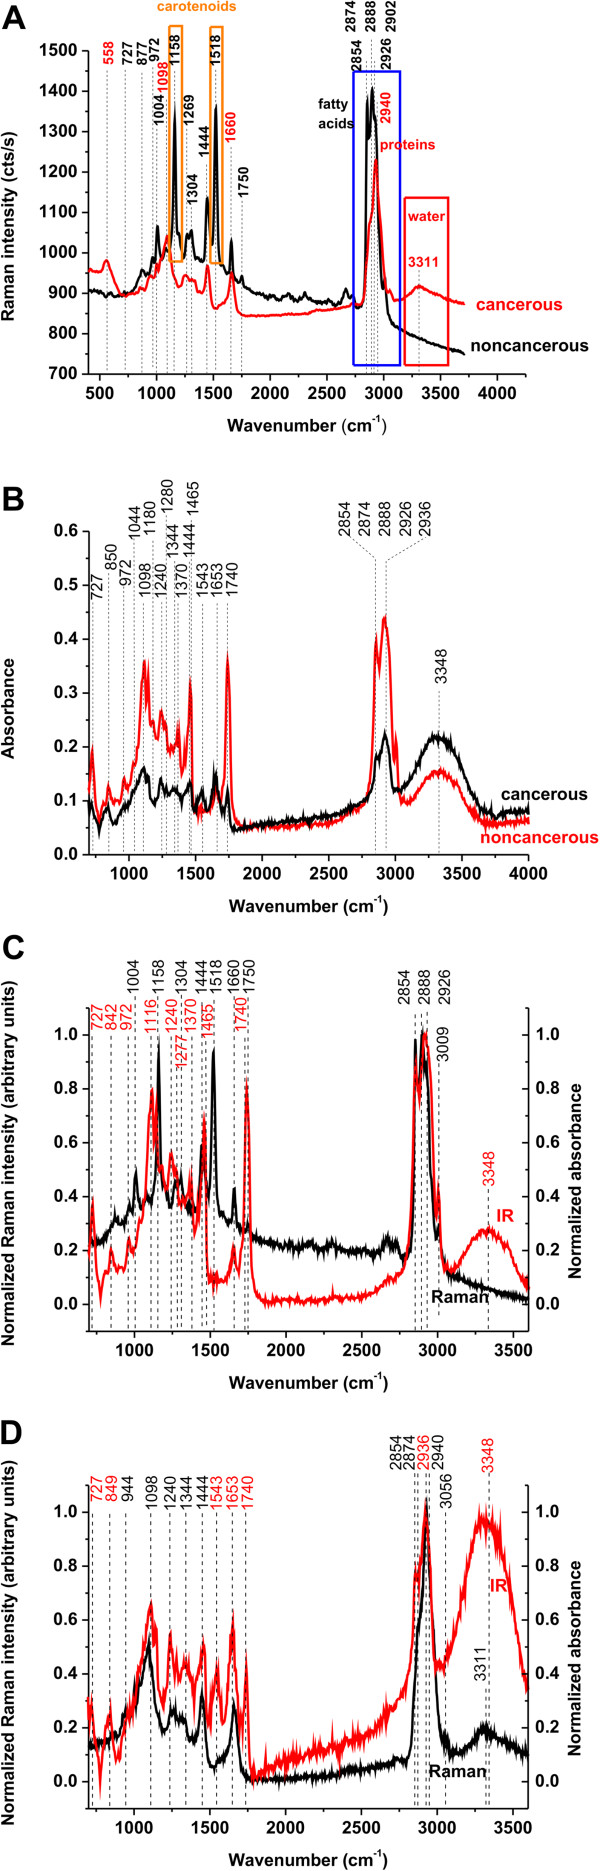
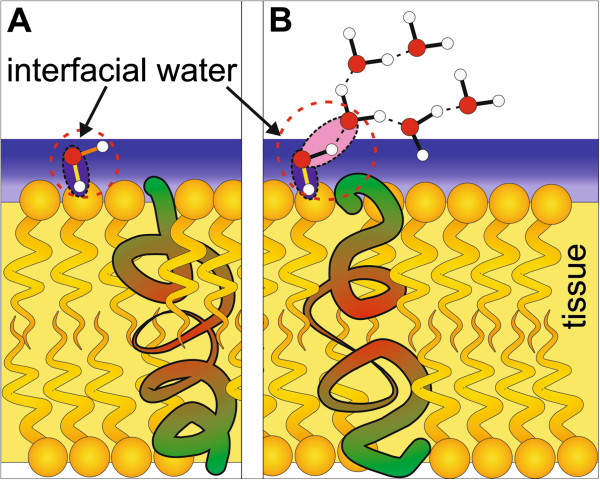
Background: One of the most important areas of Raman medical diagnostics is identification and characterization of cancerous and noncancerous tissues. The methods based on Raman scattering has shown significant potential for probing human breast tissue to provide valuable information for early diagnosis of breast cancer. A vibrational fingerprint from the biological tissue provides information which can be used to identify, characterize and discriminate structures in breast tissue, both in the normal and cancerous environment. Results: The paper reviews recent progress in understanding structure and interactions at biological interfaces of the human tissue by using confocal Raman imaging and IR spectroscopy. The important differences between the noncancerous and cancerous human breast tissues were found in regions characteristic for vibrations of carotenoids, fatty acids, proteins, and interfacial water. Particular attention was paid to the role played by unsaturated fatty acids and their derivatives as well as carotenoids and interfacial water. Conclusions: We demonstrate that Raman imaging has reached a clinically relevant level in regard to breast cancer diagnosis applications. The results presented in the paper may have serious implications on understanding mechanisms of interactions in living cells under realistically crowded conditions of biological tissue.
Overview
The claims and statistics of this paper haven’t been checked yet.
Run the check — free, no account needed. It reads the open-access text and checks the sources it cites.
Integrity signals
Registry
Cites
Statistics
Figures
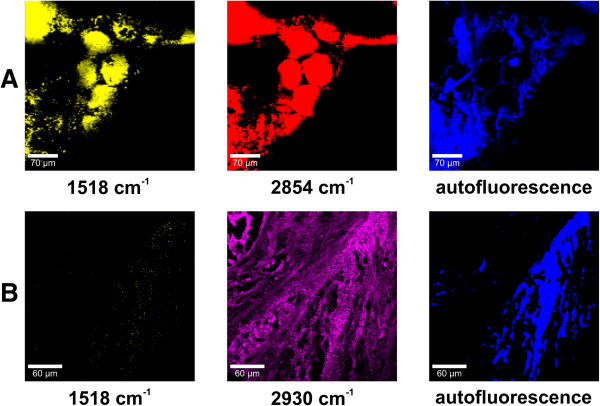
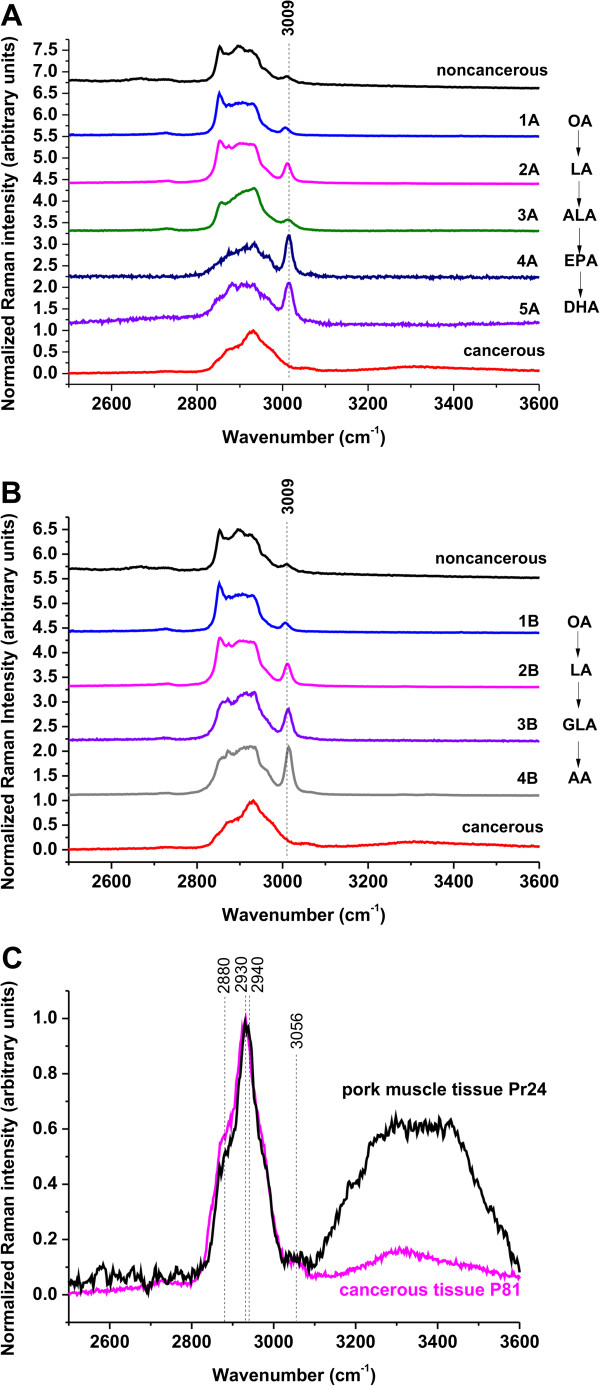
Verification
Claims the paper makes
The claims and statistics of this paper haven’t been checked yet.
Run the check — free, no account needed. It reads the open-access text and checks the sources it cites.
Claims other papers make about this one
Each is checked against this paper’s own text: does it say what the citing paper says it does?
The source backs part of the claim, not all of it — or backs it for a different population, condition or comparison.
In the citing paper
“a spectral window where Raman bands from biological molecules and tissues are minimized 13, 14”
From Design and evaluation of Raman reporters for the Raman-silent region (2022) · cites this paper as [14]
Experimental — accuracy not yet measuredThe check wasn’t confident either way, so it gives no verdict — never disputed.
In the citing paper
“this imaging technique can suffer from poor signal-to-noise ratio, as the complexity of biological tissues can lead to overlapping of Raman bands from tissues and the Raman reporter molecule utilized.”
From Design and evaluation of Raman reporters for the Raman-silent region (2022) · cites this paper as [14]
Experimental — accuracy not yet measured
Self-check
Percentages, sums and reported differences re-computed from the paper’s own numbers.
The self-check needs the paper’s full text.
Citations
Cites
Two-photon laser scanning fluorescence microscopy
Denk, W., Strickler, J. H., & Webb, W. W. (1990) · Science · doi:10.1126/science.2321027 · Cited by 9,488
Single Molecule Detection Using Surface-Enhanced Raman Scattering (SERS)
Kneipp, K. D., Wang, Y., Kneipp, H., Perelman, L. T., Itzkan, I., Dasari, R. R., & Feld, M. S. (1997) · Physical Review Letters · doi:10.1103/physrevlett.78.1667 · Cited by 6,824
Nanoparticles with Raman Spectroscopic Fingerprints for DNA and RNA Detection
Cao, Y. C., Jin, R. M., & Mirkin, C. A. (2002) · Science · doi:10.1126/science.297.5586.1536 · Cited by 2,977
The Gap Junction Communication Channel
Kumar, N. M., & Gilula, N. B. (1996) · Cell · doi:10.1016/s0092-8674(00)81282-9 · Cited by 1,929
Ten-Year Risk of False Positive Screening Mammograms and Clinical Breast Examinations
Elmore, J. G., Barton, M. B., Moceri, V. M., Polk, S., Arena, P. J., & Fletcher, S. W. (1998) · New England Journal of Medicine · doi:10.1056/nejm199804163381601 · Cited by 1,051
Wavelength-Scanned Surface-Enhanced Raman Excitation Spectroscopy
McFarland, A. D., Young, M. A., Dieringer, J. A., & Duyne, R. P. V. (2005) · The Journal of Physical Chemistry B · doi:10.1021/jp050508u · Cited by 958
Analysis of cancers missed at screening mammography.
Bird, R. E., Wallace, T., & Yankaskas, B. C. (1992) · Radiology · doi:10.1148/radiology.184.3.1509041 · Cited by 821
Plasmon-Sampled Surface-Enhanced Raman Excitation Spectroscopy
Haynes, C. L., & Duyne, R. P. V. (2003) · The Journal of Physical Chemistry B · doi:10.1021/jp027749b · Cited by 692
Characterisation and identification of bacteria using SERS
Jarvis, R. M., & Goodacre, R. (2008) · Chemical Society Reviews · doi:10.1039/b705973f · Cited by 372
Tip‐Enhanced Raman Spectroscopy of Single RNA Strands: Towards a Novel Direct‐Sequencing Method
Bailo, E., & Deckert, V. (2008) · Angewandte Chemie International Edition · doi:10.1002/anie.200704054 · Cited by 333
Cited by
Sorted by citations
Applications of Raman spectroscopy in cancer diagnosis
Auner, G. W., Koya, S. K., Huang, C., Broadbent, B., Trexler, M., Auner, Z., Elias, A., Mehne, K. C., & Brusatori, M. (2018) · Cancer and Metastasis Reviews · doi:10.1007/s10555-018-9770-9 · Cited by 389
Vibrational Spectroscopy Fingerprinting in Medicine: from Molecular to Clinical Practice
Bălan, V., Mihai, C. T., Cojocaru, F.-D., Urîtu, C. M., Dodi, G., Botezat, D., & Gardikiotis, I. (2019) · Materials · doi:10.3390/ma12182884 · Cited by 370
Abramczyk, H., Surmacki, J. M., Kopeć, M., Olejnik, A. K., Lubecka, K., & Fabianowska‐Majewska, K. (2015) · The Analyst · doi:10.1039/c4an01875c · Cited by 219
Self-citationTuteja, S. K., Chen, R., Kukkar, M., Song, C. K., Mutreja, R., Singh, S. B., Paul, A. K., Lee, H., Kim, K., Deep, A., et al. (2016) · Biosensors and Bioelectronics · doi:10.1016/j.bios.2016.07.052 · Cited by 177
Raman spectroscopy and machine learning for the classification of breast cancers
Zhang, L., Li, C., Peng, D., Yi, X., He, S., Liu, F., Zheng, X., Huang, W. E., Zhao, L., & Huang, X. (2021) · Spectrochimica Acta Part A Molecular and Biomolecular Spectroscopy · doi:10.1016/j.saa.2021.120300 · Cited by 166
Raman Spectroscopy: Guiding Light for the Extracellular Matrix
Bergholt, M. S., Serio, A., & Albro, M. B. (2019) · Frontiers in Bioengineering and Biotechnology · doi:10.3389/fbioe.2019.00303 · Cited by 143
Raman Imaging of Small Biomolecules
Shen, Y., Hu, F., & Min, W. (2019) · Annual Review of Biophysics · doi:10.1146/annurev-biophys-052118-115500 · Cited by 138
Feng, S., Huang, S., Lin, D., Chen, G., Xu, Y., Li, Y.-Z., Huang, Z., Pan, J., Chen, R., & Zeng, H. (2015) · International Journal of Nanomedicine · doi:10.2147/ijn.s71811 · Cited by 129
Application of Raman Spectroscopy and Infrared Spectroscopy in the Identification of Breast Cancer
Depciuch, J., Kaznowska, E. B., Zawlik, I., Wojnarowska‐Nowak, R., Cholewa, M., Heraud, P., & Cebulski, J. (2016) · Applied Spectroscopy · doi:10.1177/0003702815620127 · Cited by 113
Surmacki, J. M., Brożek-Płuska, B., Kordek, R., & Abramczyk, H. (2015) · The Analyst · doi:10.1039/c4an01876a · Cited by 110
Self-citationRaman Based Molecular Imaging and Analytics: A Magic Bullet for Biomedical Applications!?
Bocklitz, T. W., Guo, S., Ryabchykov, O., Vogler, N., & Popp, J. (2015) · Analytical Chemistry · doi:10.1021/acs.analchem.5b04665 · Cited by 107
Kucińska, M., Skupin-Mrugalska, P., Szczołko, W., Sobotta, Ł., Sciepura, M., Tykarska, E., Wierzchowski, M., Teubert, A., Fedoruk‐Wyszomirska, A., Wyszko, E., et al. (2015) · Journal of Medicinal Chemistry · doi:10.1021/acs.jmedchem.5b00052 · Cited by 82
Zhou, Y., Liu, C., Wu, B., Yu, X., Cheng, G., Zhu, K., Wang, K., Zhang, C., Zhao, M., Zong, R., et al. (2019) · Journal of Biomedical Optics · doi:10.1117/1.jbo.24.9.095001 · Cited by 83
Raman imaging from microscopy to macroscopy: Quality and safety control of biological materials
Lohumi, S., Kim, M. S., Qin, J., & Cho, B. (2017) · TrAC Trends in Analytical Chemistry · doi:10.1016/j.trac.2017.06.002 · Cited by 80
Vibrational spectroscopy for cancer diagnostics
Old, O. J., Fullwood, L. M., Scott, R. A., Lloyd, G. R., Almond, M., Shepherd, N. A., Stone, N., Barr, H., & Kendall, C. A. (2014) · Analytical Methods · doi:10.1039/c3ay42235f · Cited by 77
The biochemical, nanomechanical and chemometric signatures of brain cancer
Abramczyk, H., & Imiela, A. (2017) · Spectrochimica Acta Part A Molecular and Biomolecular Spectroscopy · doi:10.1016/j.saa.2017.06.037 · Cited by 76
Self-citationRaman Imaging of Nanocarriers for Drug Delivery
Vanden-Hehir, S., Tipping, W. J., Lee, M. W., Brunton, V. G., Williams, A., & Hulme, A. N. (2019) · Nanomaterials · doi:10.3390/nano9030341 · Cited by 74
Potcoava, M. C., Futia, G. L., Aughenbaugh, J., Schlaepfer, I. R., & Gibson, E. A. (2014) · Journal of Biomedical Optics · doi:10.1117/1.jbo.19.11.111605 · Cited by 67
Raman spectroscopy of breast cancer
Lazaro‐Pacheco, D., Shaaban, A. M., Rehman, S., & Rehman, I. U. (2019) · Applied Spectroscopy Reviews · doi:10.1080/05704928.2019.1601105 · Cited by 67
Novel strategies of Raman imaging for brain tumor research
Imiela, A., Polis, B., Polis, L., & Abramczyk, H. (2017) · Oncotarget · doi:10.18632/oncotarget.19668 · Cited by 64
Self-citationAbramczyk, H., & Brożek-Płuska, B. (2016) · Analytica Chimica Acta · doi:10.1016/j.aca.2015.12.038 · Cited by 62
Self-citationSantos, I. P., Caspers, P. J., Schut, T. C. B., van Doorn, R., Hegt, V. N., Koljenović, S., & Puppels, G. J. (2016) · Analytical Chemistry · doi:10.1021/acs.analchem.6b01592 · Cited by 60
Monitoring glycosylation metabolism in brain and breast cancer by Raman imaging
Kopec, M., Imiela, A., & Abramczyk, H. (2019) · Scientific Reports · doi:10.1038/s41598-018-36622-7 · Cited by 60
Self-citationKunitake, J. A. M. R., Choi, S., Nguyen, K. X., Lee, M. M., He, F., Sudilovsky, D., Morris, P. G., Jochelson, M. S., Hudis, C. A., Muller, D. A., et al. (2017) · Journal of Structural Biology · doi:10.1016/j.jsb.2017.12.002 · Cited by 59
Grudziński, W., Pięt, M., Luchowski, R., Reszczyńska, E., Welc, R., Paduch, R., & Gruszecki, W. I. (2017) · Spectrochimica Acta Part A Molecular and Biomolecular Spectroscopy · doi:10.1016/j.saa.2017.06.041 · Cited by 53
Probing micro-environment of lipid droplets in a live breast cell: MCF7 and MCF10A
Ghosh, C., Nandi, S., & Bhattacharyya, K. (2017) · Chemical Physics Letters · doi:10.1016/j.cplett.2016.12.068 · Cited by 48
Li, S. C., Tachiki, L. M. L., Kabeer, M. H., Dethlefs, B. A., Anthony, M. J., & Loudon, W. G. (2014) · Cancer Cell International · doi:10.1186/s12935-014-0115-7 · Cited by 47
Depciuch, J., Kaznowska, E. B., Szmuc, K., Zawlik, I., Cholewa, M., Heraud, P., & Cebulski, J. (2016) · Infrared Physics & Technology · doi:10.1016/j.infrared.2016.02.006 · Cited by 46
Talari, A. C. S., Rehman, S., & Rehman, I. U. (2019) · Expert Review of Molecular Diagnostics · doi:10.1080/14737159.2019.1659727 · Cited by 46
Abramczyk, H., Surmacki, J. M., Kopeć, M., Olejnik, A. K., Kaufman‐Szymczyk, A., & Fabianowska‐Majewska, K. (2016) · The Analyst · doi:10.1039/c6an00859c · Cited by 44
Self-citationKopec, M., Błaszczyk, M., Radek, M., & Abramczyk, H. (2021) · Spectrochimica Acta Part A Molecular and Biomolecular Spectroscopy · doi:10.1016/j.saa.2021.120091 · Cited by 42
Self-citationShang, H., Shang, L., Wu, J., Xu, Z., Zhou, S.-W., Wang, Z., Wang, H., & Yin, J. (2022) · Spectrochimica Acta Part A Molecular and Biomolecular Spectroscopy · doi:10.1016/j.saa.2022.121990 · Cited by 41
You, S., Tu, H., Zhao, Y., Liu, Y., Chaney, E. J., Marjanović, M., & Boppart, S. A. (2016) · Scientific Reports · doi:10.1038/srep32922 · Cited by 40
Abramczyk, H., Brożek-Płuska, B., Krzesniak, M., Kopec, M., & Morawiec-Sztandera, A. (2014) · Spectrochimica Acta Part A Molecular and Biomolecular Spectroscopy · doi:10.1016/j.saa.2014.03.103 · Cited by 38
Self-citationTemporal Quantum Correlations in Inelastic Light Scattering from Water
Kasperczyk, M., Júnior, F. S. D. A., Rabelo, C., Saraiva, A., Santos, M. F., Novotný, L., & Jório, A. (2016) · Physical Review Letters · doi:10.1103/physrevlett.117.243603 · Cited by 38
Chaber, R., Łach, K., Depciuch, J., Szmuc, K., Michalak, E., Raciborska, A., Koziorowska, A. M., & Cebulski, J. (2017) · Infrared Physics & Technology · doi:10.1016/j.infrared.2017.07.017 · Cited by 38
Liang, O., Wang, P., Xia, M., Augello, C. J., Yang, F., Niu, G., Liu, H. H., & Xie, Y. (2018) · Biosensors and Bioelectronics · doi:10.1016/j.bios.2018.07.038 · Cited by 36
Abramczyk, H., Brożek-Płuska, B., Jarota, A., Surmacki, J. M., Imiela, A., & Kopec, M. (2020) · Expert Review of Molecular Diagnostics · doi:10.1080/14737159.2020.1724092 · Cited by 35
Self-citationAbramczyk, H., Brożek-Płuska, B., Surmacki, J. M., Musiał, J., & Kordek, R. (2014) · The Analyst · doi:10.1039/c4an00966e · Cited by 34
Self-citationBrożek-Płuska, B., Kopec, M., Niedźwiecka, I., & Morawiec-Sztandera, A. (2014) · The Analyst · doi:10.1039/c4an01394h · Cited by 34
Lin, X., Wang, L., Lin, H., Lin, D., Lin, J., Liu, X., Qiu, S., Xu, Y., Chen, G., & Feng, S. (2018) · Journal of Biophotonics · doi:10.1002/jbio.201800327 · Cited by 34
Chuchuen, O., Henderson, M. H., Sykes, C., Kim, M. S., Kashuba, A. D. M., & Katz, D. F. (2013) · PLoS ONE · doi:10.1371/journal.pone.0085124 · Cited by 33
Koya, S. K., Brusatori, M., Yurgelevic, S. M., Huang, C., Werner, C., Kast, R. E., Shanley, J., Sherman, M. E., Honn, K. V., Maddipati, K. R., et al. (2020) · Prostaglandins & Other Lipid Mediators · doi:10.1016/j.prostaglandins.2020.106475 · Cited by 31
Abramczyk, H., Imiela, A., Brożek-Płuska, B., & Kopec, M. (2019) · Nanomedicine · doi:10.2217/nnm-2018-0335 · Cited by 29
Self-citationRaman mapping of oral tissues for cancer diagnosis
Daniel, A., Aruna, P., David, B., Joseph, L. D., Krishna, C. M., Koteeswaran, D., & Ganesan, S. (2014) · Journal of Raman Spectroscopy · doi:10.1002/jrs.4493 · Cited by 29
Ning, T., Li, H., Chen, Y., Zhang, B., Zhang, F., & Wang, S. (2021) · Vibrational Spectroscopy · doi:10.1016/j.vibspec.2021.103260 · Cited by 27
Liu, K., Liu, B., Zhang, Y., Wu, Q.-N., Zhong, M., Shang, L., Wang, Y., Liang, P., Wang, W., Zhao, Q., et al. (2022) · Computational and Structural Biotechnology Journal · doi:10.1016/j.csbj.2022.12.050 · Cited by 27
Novel strategies of Raman imaging for exploring cancer lipid reprogramming
Abramczyk, H., Imiela, A., & Śliwińska, A. (2018) · Journal of Molecular Liquids · doi:10.1016/j.molliq.2018.10.082 · Cited by 27
Self-citationSun, J., Lai, W., Zhao, J., Xue, J., Zhu, T., Xiao, M., Man, T., Wan, Y., Pei, H., & Li, L. (2024) · ACS Sensors · doi:10.1021/acssensors.4c01205 · Cited by 26
Filip, G. A., Potara, M., Florea, A., Bâldea, I., Olteanu, D. E., Bolfă, P., Clichici, S. V., David, L., Moldovan, B. E., Olenic, L., et al. (2015) · RSC Advances · doi:10.1039/c5ra10376b · Cited by 26
Mo, W., Ke, Q., Zhou, M., Xie, G., Huang, J., Gao, F., Ni, S., Yang, X., Qi, D., Wang, A., et al. (2023) · Analytical Chemistry · doi:10.1021/acs.analchem.2c05067 · Cited by 26
Breast Tumor Analysis Using Shifted-Excitation Raman Difference Spectroscopy (SERDS)
Gebrekidan, M. T., Erber, R., Hartmann, A., Fasching, P. A., Emons, J., Beckmann, M. W., & Braeuer, A. (2018) · Technology in Cancer Research & Treatment · doi:10.1177/1533033818782532 · Cited by 25
Tuteja, S. K., Duffield, T. F., & Neethirajan, S. R. (2017) · Journal of Materials Chemistry B · doi:10.1039/c7tb01382e · Cited by 25
Lin, X., Wu, Q., Lin, J., Liu, X., Jia, X., Peng, M., Lin, D., Qiu, S., & Feng, S. (2020) · Journal of Raman Spectroscopy · doi:10.1002/jrs.5978 · Cited by 25
Confer, M. P., Holcombe, B., Foes, A., Holmquist, J. M., Walker, S. C., Deb, S., & Ghosh, A. (2021) · The Journal of Physical Chemistry Letters · doi:10.1021/acs.jpclett.1c02306 · Cited by 21
Birtoiu, I. A., Rizea, C., Ţogoe, D., Munteanu, R. M., Micşa, C., Rusu, M. I., Tautan, M. N., Braic, L., Scoicaru, L. O., Pârău, A. C., et al. (2016) · Interface Focus · doi:10.1098/rsfs.2016.0067 · Cited by 23
Design and evaluation of Raman reporters for the Raman-silent region
Plakas, K., Rosch, L. E., Clark, M. D., Adbul-Rashed, S., Shaffer, T. M., Harmsen, S., Gambhir, S. S., & Detty, M. R. (2022) · Nanotheranostics · doi:10.7150/ntno.58965 · Cited by 22
“In order to expand the multiplexing capabilities of these classes of dyes and avoid spectral interferences, we sought to optimize the pyrylium dye structures for performance in the Raman silent region (1750–2750 cm-1) – a spectral window where Raman bands from biological molecules and tissues are minimized [13, 14] as…”
Brożek-Płuska, B., Kopec, M., Surmacki, J. M., & Abramczyk, H. (2018) · Infrared Physics & Technology · doi:10.1016/j.infrared.2018.08.005 · Cited by 22
Self-citationDas, S. K., Pal, K., Bhattacharya, T. S., Karmakar, P., & Chowdhury, J. (2019) · Sensors and Actuators B Chemical · doi:10.1016/j.snb.2019.126962 · Cited by 21
Sun, J., Luo, J., Jiang, F., Zhao, J., Zhou, S., Wang, L., Zhang, D., Ding, Y., & Li, X. (2023) · JNCI Journal of the National Cancer Institute · doi:10.1093/jnci/djad247 · Cited by 21
Li, J., Wang, X., Min, S., Xia, J., & Li, J. (2024) · Computer Methods and Programs in Biomedicine · doi:10.1016/j.cmpb.2024.108361 · Cited by 20
Rau, J. V., Marini, F., Fosca, M., Cippitelli, C., Rocchia, M., & Napoli, A. D. (2018) · Talanta · doi:10.1016/j.talanta.2018.10.086 · Cited by 20
Intraoperative detection of human meningioma using a handheld visible resonance Raman analyzer
Zhang, L., Zhou, Y., Wu, B., Zhang, S., Zhu, K., Liu, C., Yu, X., & Alfano, R. R. (2021) · Lasers in Medical Science · doi:10.1007/s10103-021-03390-2 · Cited by 20
Liu, Y., Tu, H., You, S., Chaney, E. J., Marjanović, M., & Boppart, S. A. (2019) · Quantitative Imaging in Medicine and Surgery · doi:10.21037/qims.2019.04.16 · Cited by 19
Mignolet, A., Wood, B. R., & Goormaghtigh, E. (2017) · The Analyst · doi:10.1039/c7an01460k · Cited by 19
Advances in the clinical application of Raman spectroscopy in breast cancer
Ma, M., Zhang, J., Liu, Y., Wang, X., & Han, B. (2024) · Applied Spectroscopy Reviews · doi:10.1080/05704928.2024.2352519 · Cited by 18
Tubbesing, K. E., Khoo, T. C., Jangjoo, S. B., Sharikova, A. V., Barroso, M., & Khmaladze, A. T. (2021) · Free Radical Biology and Medicine · doi:10.1016/j.freeradbiomed.2021.04.030 · Cited by 16
Lin, Y., Gao, S., Zheng, M., Tang, S., Lin, K., Xie, S., Yu, Y., & Lin, J. (2021) · Spectrochimica Acta Part A Molecular and Biomolecular Spectroscopy · doi:10.1016/j.saa.2021.120039 · Cited by 17
Rainu, S. K., Ramachandran, R. G., Parameswaran, S., Krishnakumar, S., & Singh, N. (2023) · ACS Biomaterials Science & Engineering · doi:10.1021/acsbiomaterials.3c00828 · Cited by 18
Raman Microscopy and Associated Techniques for Label-Free Imaging of Cancer Tissue
Downes, A. (2015) · Applied Spectroscopy Reviews · doi:10.1080/05704928.2015.1052817 · Cited by 17
Biochemical and molecular aspects of spectral diagnosis in calcinosis cutis
Lin, S. (2014) · Expert Reviews in Molecular Medicine · doi:10.1017/erm.2014.6 · Cited by 17
Sabtu, S. N., Sani, S. F. A., Bradley, D. A., Looi, L., & Osman, Z. (2019) · Journal of Raman Spectroscopy · doi:10.1002/jrs.5774 · Cited by 17
Hsiao, C.-B., Bedi, H., Gomez, R., Khan, A., Meciszewski, T., Aalinkeel, R., Khoo, T. C., Sharikova, A. V., Khmaladze, A. T., & Mahajan, S. D. (2021) · Vaccines · doi:10.3390/vaccines9070721 · Cited by 16
Surface‐Enhanced Raman Scattering Using 2D Materials
de Sousa, B. P., Fateixa, S., & Trindade, T. (2024) · Chemistry - A European Journal · doi:10.1002/chem.202303658 · Cited by 15
FABP4 Enhances Lipidic and Fibrotic Cardiac Structural and Ca 2+ Dynamic Changes
Couselo‐Seijas, M., Vázquez‐Abuín, X., Gómez-Lázaro, M., Pereira, L., Gomez, A. M., Caballero, R., Delpón, E., Bravo, S. B., González‐Juanatey, J. R., & Eirás, S. (2024) · Circulation Arrhythmia and Electrophysiology · doi:10.1161/circep.123.012683 · Cited by 15
Molybdenum Nanoscrews: A Novel Non-coinage-Metal Substrate for Surface-Enhanced Raman Scattering
An, D., Shen, Y., Wen, J., Zheng, Z., Chen, J., She, J., Chen, H., Deng, S., & Xu, N. S. (2016) · Nano-Micro Letters · doi:10.1007/s40820-016-0104-6 · Cited by 14
AI-assisted SERS imaging method for label-free and rapid discrimination of clinical lymphoma
Cao, H., Wu, X., Shi, H., Chu, B., He, Y., Wang, H., & Dong, F. (2025) · Journal of Nanobiotechnology · doi:10.1186/s12951-025-03339-5 · Cited by 13
Wang, M., Zhang, K., Yue, L., Liu, X., Lai, Y., & Zhang, H. (2024) · ACS Applied Nano Materials · doi:10.1021/acsanm.4c02191 · Cited by 13
Brożek-Płuska, B., & Kopec, M. (2016) · Spectrochimica Acta Part A Molecular and Biomolecular Spectroscopy · doi:10.1016/j.saa.2016.06.038 · Cited by 13
Ralbovsky, N. M., Egorov, V., Moskovets, E. V., Dey, P., Dey, B. K., & Lednev, I. K. (2019) · Cancer Studies and Molecular Medicine - Open Journal · doi:10.17140/csmmoj-5-126 · Cited by 13
Lipid profiling using Raman and a modified support vector machine algorithm
Potcoava, M. C., Futia, G. L., Gibson, E. A., & Schlaepfer, I. R. (2021) · Journal of Raman Spectroscopy · doi:10.1002/jrs.6238 · Cited by 13
Dantas, D., Soares, L., Novais, S., Vilarinho, R., Moreira, J. A., Silva, S., Frazão, O., Oliveira, T., Leal, N., Faísca, P., et al. (2020) · Animals · doi:10.3390/ani10091652 · Cited by 12
Assessment of TiO2 Nanoparticle Impact on Surface Morphology of Chinese Hamster Ovary Cells
Batiuškaitė, D., Bružaitė, I., Snitka, V. J., & Ramanavičius, A. (2022) · Materials · doi:10.3390/ma15134570 · Cited by 12
Iermak, I., da Silva, A. P., Kurachi, C., Bagnato, V. S., & Inada, N. M. (2019) · Pharmaceuticals · doi:10.3390/ph12010044 · Cited by 10
Novel SERS biosensor for rapid detection of breast cancer based on Ag2O-Ag-PSi nanochips
Wang, X., Chen, C., Chen, C., Zuo, E., Han, S., Yang, J., Yan, Z., Lv, X., Hou, J., & Jia, Z. (2023) · Spectrochimica Acta Part A Molecular and Biomolecular Spectroscopy · doi:10.1016/j.saa.2023.123226 · Cited by 10
Label-free visualization of cholesteatoma in the mastoid and tympanic membrane using CARS microscopy
Zou, J., Isomäki, A., Hirvonen, T. P., Aarnisalo, A. A., Jero, J., & Pyykkö, I. V. (2016) · Journal of Otology · doi:10.1016/j.joto.2016.09.001 · Cited by 10
Hosseinzadeh, M., Salmani, S., Ara, M. H. M., & Mohajer, S. (2018) · Journal of Nonlinear Optical Physics & Materials · doi:10.1142/s0218863518500339 · Cited by 10
Clinical Raman measurements under special ambient lighting illumination
Zhao, J., Short, M. A., Braun, T., Lui, H., McLean, D. I., & Zeng, H. (2014) · Journal of Biomedical Optics · doi:10.1117/1.jbo.19.11.111609 · Cited by 10
Direct intracellular detection of biomolecule specific bound-water with Raman spectroscopy
Samuel, A. Z., Sugiyama, K., & Takeyama, H. (2022) · Spectrochimica Acta Part A Molecular and Biomolecular Spectroscopy · doi:10.1016/j.saa.2022.121870 · Cited by 9
Cancerous Tissue Diagnosis by LIF Spectroscopy Derived From Body-Compatible Fluorophores
Moghaddam, A. A., Sajad, B., Nia, F. M., & Madani, S. H. (2021) · Journal of lasers in medical sciences · doi:10.34172/jlms.2021.10 · Cited by 9
A’dawiah, R., Yap, A. A. M., Rajarahm, P., Zheng, S., Zhang, R., Yi, Q., Dinish, U. S., Xu, W., Balasundaram, G., Olivo, M., et al. (2025) · Applied Spectroscopy Reviews · doi:10.1080/05704928.2025.2485280 · Cited by 8
Nonlinear optical microscopies (NOMs) and plasmon‐enhanced NOMs for biology and 2D materials
Ma, J., & Sun, M. (2020) · Nanophotonics · doi:10.1515/nanoph-2020-0082 · Cited by 8
Optical spectroscopic methods to discriminate in- Vitro Hodgkin cancerous and normal tissues
Ghasemi, F., Parvin, P., Motlagh, N. S. H., Bavali, A., & Karimi, R. (2015) · Optics in the Life Sciences · doi:10.1364/boda.2015.jt3a.40 · Cited by 8
Interferometric optical testing to discriminate benign and malignant brain tumors
Hosseinzadeh, M., Salmani, S., & Ara, M. H. M. (2019) · Journal of Photochemistry and Photobiology B Biology · doi:10.1016/j.jphotobiol.2019.111590 · Cited by 8
Mussatto, J. C., Perez, M. C., de Souza, R. A., Pacheco, M. T. T., Zângaro, R. A., & Silveira, L. (2014) · Lasers in Medical Science · doi:10.1007/s10103-014-1647-8 · Cited by 7
Real‐time detection of breast cancer at the cellular level
Carver, G. E., Locknar, S. A., Weaver, D. L., Stein, J. L., & Stein, G. S. (2018) · Journal of Cellular Physiology · doi:10.1002/jcp.27451 · Cited by 7
Slatinskaya, O. V., Luneva, O. G., Deev, L. I., Orlov, S. N., & Maksimov, G. V. (2020) · BIOPHYSICS · doi:10.1134/s0006350920020220 · Cited by 7
Surface Enhanced Raman Scattering in surgery and forensics
Micşa, C., Rizea, C., Rusu, M. I., Becherescu-Barbu, N. D., Munteanu, R. M., Udrea, M. V., Chiricuță, B., Pârău, A. C., Tonetto, A., Notonier, R., et al. (2016) · International Conference on Transparent Optical Networks · doi:10.1109/icton.2016.7550356 · Cited by 7
Arévalo, L. A., O’Brien, S. A., López, E., Singh, G., & Seifert, A. (2022) · International Journal of Molecular Sciences · doi:10.3390/ijms23126834 · Cited by 6
A novel diagnostic method of Raman spectroscopy for malignant pheochromocytoma/paraganglioma
Du, Y., Huang, Z. L., Wang, L., Huang, L., Cao, P., He, D., Zhang, Y., Wu, D., Yang, Z.-S., & Fan, J. (2016) · RSC Advances · doi:10.1039/c6ra18312c · Cited by 6
Metadata
- Authors
- Surmacki, J., Musial, J., Kordek, R., & Abramczyk, H.
- Affiliations
- Lodz University of Technology (PL)
- Corresponding author
- Abramczyk, Halina
- Venue
- Molecular Cancer
- Published
- 2013-05-24
- Volume
- 12
- Issue
- 1
- Pages
- 48-48
- ISSN
- 1476-4598 (ISSN-L)
- PMC
- PMC3681552
- OpenAlex
- W2132590101
- Cited by
- 143
- References
- 61
- Citations by year
- 2026: 5 · 2025: 8 · 2024: 8 · 2023: 9 · 2022: 6 · 2021: 15 · 2020: 7 · 2019: 19 · 2018: 11 · 2017: 12 · 2016: 17 · 2015: 13 · 2014: 12 · 2013: 1
- FWCI
- 8.69
- Type
- journal article
- Language
- en
- Open access
- gold
- doi.org
- Licence
- cc-by
- Locations
- Molecular Cancer (publishedVersion, cc-by)
- Europe PMC (PubMed Central) (publishedVersion, cc-by)
- PubMed Central (publishedVersion, cc-by)
- PubMed (publishedVersion)
- Funders
- Uniwersytet Łódzki
- Topics
- Life Sciences › Biochemistry, Genetics and Molecular Biology › Biophysics › Spectroscopy Techniques in Biomedical and Chemical Research
- Health Sciences › Medicine › Radiology, Nuclear Medicine and Imaging › Optical Imaging and Spectroscopy Techniques
- Physical Sciences › Physics and Astronomy › Atomic and Molecular Physics, and Optics › Spectroscopy and Quantum Chemical Studies
- Keywords
- Raman imaging, breast cancer diagnosis, biointerfaces, confocal Raman microscopy, infrared spectroscopy, breast tissue, carotenoids, unsaturated fatty acids, interfacial water, protein vibrations, early cancer detection
- MeSH terms
- Breast, Breast Neoplasms, Diagnostic Imaging, Female, Humans, Spectrum Analysis, Raman
About these checks
Registry, retraction, Cites and statistics results are computed, not judged, with one exception: a printed reference that no index lists is read once by a model before it counts as a citation error. Claims are extracted by a model and kept only when their quote appears verbatim in the text; each cited source is then checked, with a model’s help, for whether it says what the claim relies on. Those verdicts can be wrong — read the claim’s quote and the cited source before relying on one.
Statistics and arithmetic are recomputed, not judged.
Confidence bands are shown only for fields calibrated on our annotated test set. None is calibrated yet, so no band is shown.
What counts as a claim ›How we measure confidence ›How we check this ›
Are you an author, or do you see a problem with this page? Request a review
