

The DOI matches its Crossref record; 54 of the 54 references it cites were found in a registry or an index.
IFN-γ-induced increase in the mobility of MHC class II compartments in astrocytes depends on intermediate filaments
Open accessAbstract
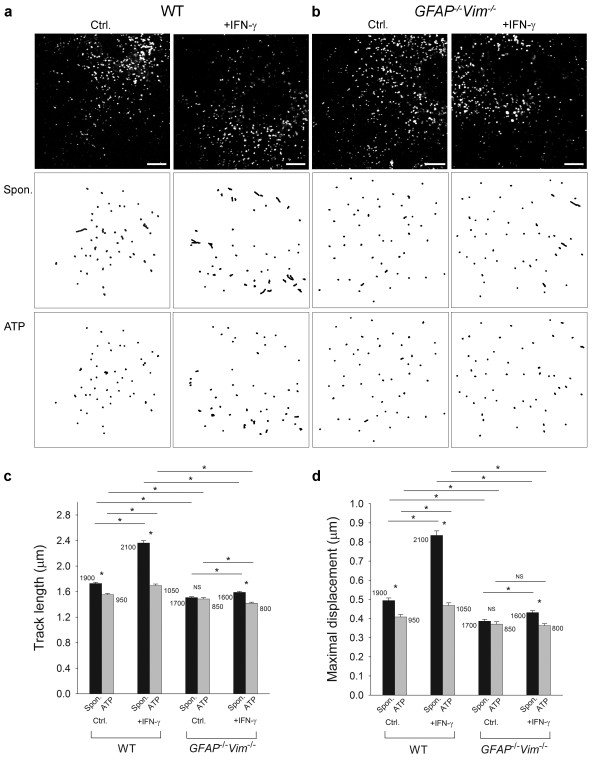
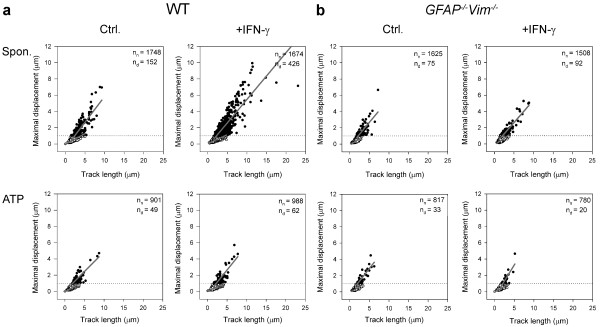
Background: In immune-mediated diseases of the central nervous system, astrocytes exposed to interferon-γ (IFN-γ) can express major histocompatibility complex (MHC) class II molecules and antigens on their surface. MHC class II molecules are thought to be delivered to the cell surface by membrane-bound vesicles. However, the characteristics and dynamics of this vesicular traffic are unclear, particularly in reactive astrocytes, which overexpress intermediate filament (IF) proteins that may affect trafficking. The aim of this study was to determine the mobility of MHC class II vesicles in wild-type (WT) astrocytes and in astrocytes devoid of IFs. Methods: The identity of MHC class II compartments in WT and IF-deficient astrocytes 48 h after IFN-γ activation was determined immunocytochemically by using confocal microscopy. Time-lapse confocal imaging and Alexa Fluor 546-dextran labeling of late endosomes/lysosomes in IFN-γ treated cells was used to characterize the motion of MHC class II vesicles. The mobility of vesicles was analyzed using ParticleTR software. Results: Confocal imaging of primary cultures of WT and IF-deficient astrocytes revealed IFN-γ induced MHC class II expression in late endosomes/lysosomes, which were specifically labeled with Alexa Fluor 546-conjugated dextran. Live imaging revealed faster movement of dextran-positive vesicles in IFN-γ-treated than in untreated astrocytes. Vesicle mobility was lower in IFN-γ-treated IF-deficient astrocytes than in WT astrocytes. Thus, the IFN-γ-induced increase in the mobility of MHC class II compartments is IF-dependent. Conclusions: Since reactivity of astrocytes is a hallmark of many CNS pathologies, it is likely that the up-regulation of IFs under such conditions allows a faster and therefore a more efficient delivery of MHC class II molecules to the cell surface. In vivo, such regulatory mechanisms may enable antigen-presenting reactive astrocytes to respond rapidly and in a controlled manner to CNS inflammation.
Overview
The claims and statistics of this paper haven’t been checked yet.
Run the check — free, no account needed. It reads the open-access text and checks the sources it cites.
Integrity signals
Registry
Cites
Statistics
Figures
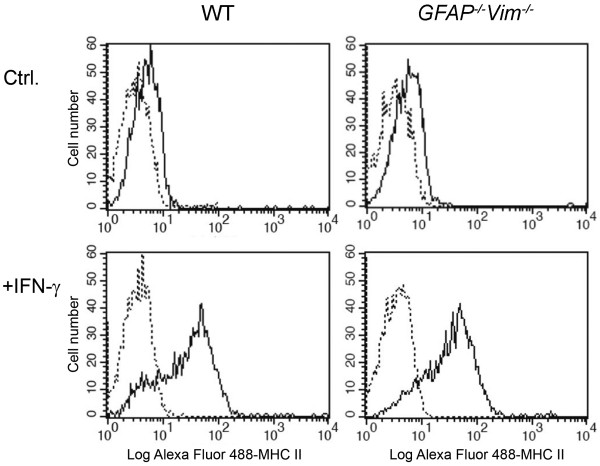
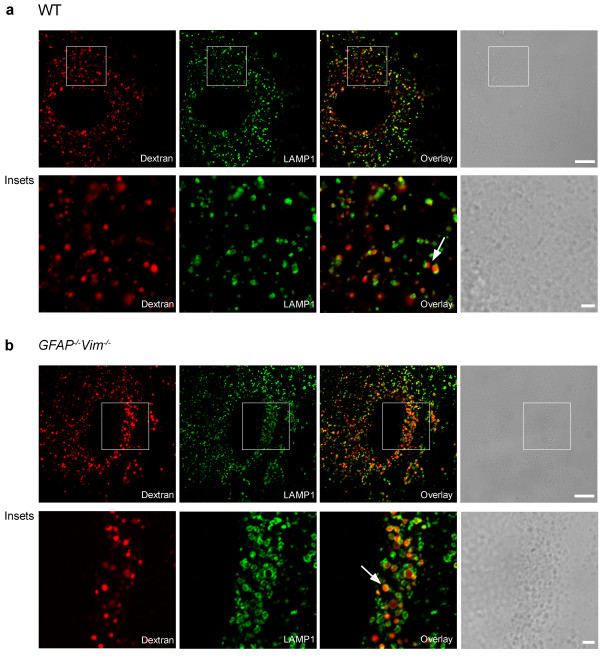
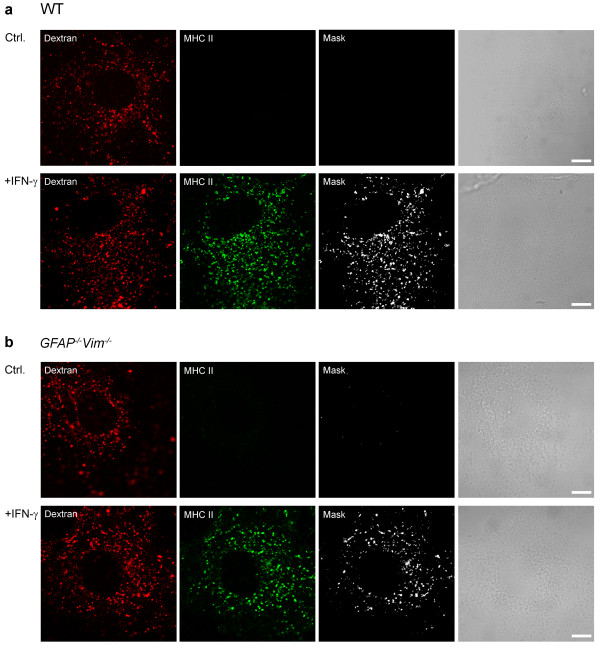
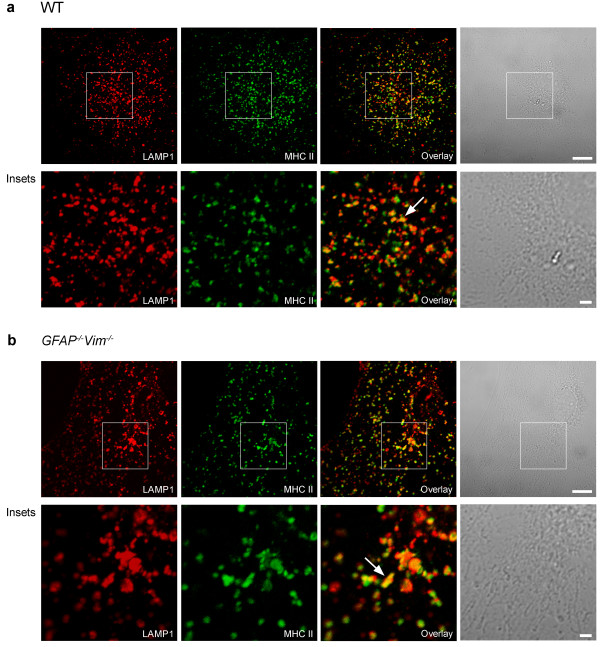
Verification
Claims the paper makes
The claims and statistics of this paper haven’t been checked yet.
Run the check — free, no account needed. It reads the open-access text and checks the sources it cites.
Claims other papers make about this one
Each is checked against this paper’s own text: does it say what the citing paper says it does?
The check wasn’t confident either way, so it gives no verdict — never disputed.
In the citing paper
“Astrocyte endfeet line the abluminal aspect of endothelial cells and are important for the formation and maintenance of the blood-brain-barrier (29).”
From Attenuating astrocyte activation accelerates plaque pathogenesis in APP/PS1 mice (2013) · cites this paper as [29]
Experimental — accuracy not yet measured
Self-check
Percentages, sums and reported differences re-computed from the paper’s own numbers.
The self-check needs the paper’s full text.
Citations
Cites
Lysosomes: fusion and function
Luzio, J. P., Pryor, P. R., & Bright, N. A. (2007) · Nature Reviews Molecular Cell Biology · doi:10.1038/nrm2217 · Cited by 1,807
Astrocyte activation and reactive gliosis
Pekny, M., & Nilsson, M. (2005) · Glia · doi:10.1002/glia.20207 · Cited by 1,611
Self-citationAstrocytes present myelin basic protein to encephalitogenic T-cell lines
Fontana, A., Fierz, W., & Wekerle, H. (1984) · Nature · doi:10.1038/307273a0 · Cited by 772
Mice lacking vimentin develop and reproduce without an obvious phenotype
Colucci-Guyon, E., Portier, M.-M., Dunia, I., Paulin, D., Pournin, S., & Babinet, C. (1994) · Cell · doi:10.1016/0092-8674(94)90553-3 · Cited by 598
Regulated ATP release from astrocytes through lysosome exocytosis
Zhang, Z., Chen, G., Zhou, W., Song, A., Xu, T., Luo, Q., Wang, W., Gu, X., & Duan, S. (2007) · Nature Cell Biology · doi:10.1038/ncb1620 · Cited by 539
Vimentin-Dependent Spatial Translocation of an Activated MAP Kinase in Injured Nerve
Perlson, E., Hanz, S., Ben‐Yaakov, K., Segal-Ruder, Y., Seger, R., & Fainzilber, M. (2005) · Neuron · doi:10.1016/j.neuron.2005.01.023 · Cited by 507
Protective Role of Reactive Astrocytes in Brain Ischemia
Li, L., Lundkvist, A., Andersson, D., Wilhelmsson, U., Nagai, N., Pardo, A. C., Nodin, C., Ståhlberg, A., Aprico, K., Larsson, K., et al. (2008) · Journal of Cerebral Blood Flow & Metabolism · doi:10.1038/sj.jcbfm.9600546 · Cited by 505
Self-citationVimentin function in lymphocyte adhesion and transcellular migration
Nieminen, M., Henttinen, T. A., Karikoski, M., Marttila‐Ichihara, F., Eriksson, J., & Jalkanen, S. (2006) · Nature Cell Biology · doi:10.1038/ncb1355 · Cited by 467
Mechanisms of MHC class I‐restricted antigen processing and cross‐presentation
Cresswell, P., Ackerman, A. L., Giodini, A., Peaper, D. R., & Wearsch, P. A. (2005) · Immunological Reviews · doi:10.1111/j.0105-2896.2005.00316.x · Cited by 435
Astrocyte intermediate filaments in CNS pathologies and regeneration
Pekny, M., & Pekna, M. (2004) · The Journal of Pathology · doi:10.1002/path.1645 · Cited by 420
Self-citation
Cited by
Sorted by citations
Verkhratsky, A., & Nedergaard, M. (2018) · Physiological Reviews · doi:10.1152/physrev.00042.2016 · Cited by 1,678
Astrocyte reactivity and reactive astrogliosis: costs and benefits
Pekny, M., & Pekna, M. (2014) · Physiological Reviews · doi:10.1152/physrev.00041.2013 · Cited by 934
Self-citationHol, E. M., & Pekny, M. (2015) · Current Opinion in Cell Biology · doi:10.1016/j.ceb.2015.02.004 · Cited by 917
Self-citationAstrocytes: a central element in neurological diseases
Pekny, M., Pekna, M., Messing, A., Steinhäuser, C., Lee, J., Parpura, V., Hol, E. M., Sofroniew, M. V., & Verkhratsky, A. (2015) · Acta Neuropathologica · doi:10.1007/s00401-015-1513-1 · Cited by 793
Self-citationThe dual role of astrocyte activation and reactive gliosis
Pekny, M., Wilhelmsson, U., & Pekna, M. (2014) · Neuroscience Letters · doi:10.1016/j.neulet.2013.12.071 · Cited by 693
Self-citation
Metadata
- Authors
- Vardjan, N., Gabrijel, M., Potokar, M., Švajger, U., Kreft, M., Jeras, M., de Pablo, Y., Faiz, M., Pekny, M., & Zorec, R.
- Affiliations
- University of Ljubljana (SI)
- Blood Transfusion Centre of Slovenia (SI)
- University of Gothenburg (SE)
- Corresponding author
- Zorec, Robert
- ORCID
- Venue
- Journal of Neuroinflammation
- Published
- 2012-06-26
- Volume
- 9
- Issue
- 1
- Pages
- 144-144
- ISSN
- 1742-2094 (ISSN-L)
- PMC
- PMC3423045
- OpenAlex
- W2139576028
- Cited by
- 117
- References
- 54
- Citations by year
- 2026: 5 · 2025: 7 · 2024: 4 · 2023: 7 · 2022: 5 · 2021: 7 · 2020: 9 · 2019: 13 · 2018: 8 · 2017: 14 · 2016: 10 · 2015: 14 · 2014: 8 · 2013: 4 · 2012: 2
- FWCI
- 4.24
- Type
- journal article
- Language
- en
- Open access
- gold
- doi.org
- Locations
- Journal of Neuroinflammation (publishedVersion, cc-by)
- Europe PMC (PubMed Central) (publishedVersion, cc-by)
- PubMed Central (publishedVersion, cc-by)
- PubMed (publishedVersion)
- DOAJ (DOAJ: Directory of Open Access Journals) (submittedVersion)
- Funders
- European Commission (279017, 237956)
- Javna Agencija za Raziskovalno Dejavnost RS (J3-0133, P3-310, L1-2402, J3-4146, J3-0031)
- Medical Research Council
- Topics
- Life Sciences › Biochemistry, Genetics and Molecular Biology › Cell Biology › Cellular transport and secretion
- Life Sciences › Neuroscience › Neurology › Neuroinflammation and Neurodegeneration Mechanisms
- Life Sciences › Biochemistry, Genetics and Molecular Biology › Cell Biology › Skin and Cellular Biology Research
- Keywords
- interferon-gamma, MHC class II, astrocytes, intermediate filaments, vesicle mobility, late endosomes, lysosomes, antigen presentation, reactive astrocytes, vesicle trafficking, neuroinflammation
- MeSH terms
- Animals, Histocompatibility Antigens Class II, Astrocytes, Cell Compartmentation, Cells, Cultured, Interferon-gamma, Intermediate Filament Proteins, Mice, Inbred C57BL, Up-Regulation, Mice, Knockout, Protein Transport, Mice, Mice, 129 Strain
About these checks
Registry, retraction, Cites and statistics results are computed, not judged, with one exception: a printed reference that no index lists is read once by a model before it counts as a citation error. Claims are extracted by a model and kept only when their quote appears verbatim in the text; each cited source is then checked, with a model’s help, for whether it says what the claim relies on. Those verdicts can be wrong — read the claim’s quote and the cited source before relying on one.
Statistics and arithmetic are recomputed, not judged.
Confidence bands are shown only for fields calibrated on our annotated test set. None is calibrated yet, so no band is shown.
What counts as a claim ›How we measure confidence ›How we check this ›
Are you an author, or do you see a problem with this page? Request a review
