

The DOI matches its Crossref record; 40 of the 40 references it cites were found in a registry or an index.
Social network diagnostics: a tool for monitoring group interventions
Open accessAbstract
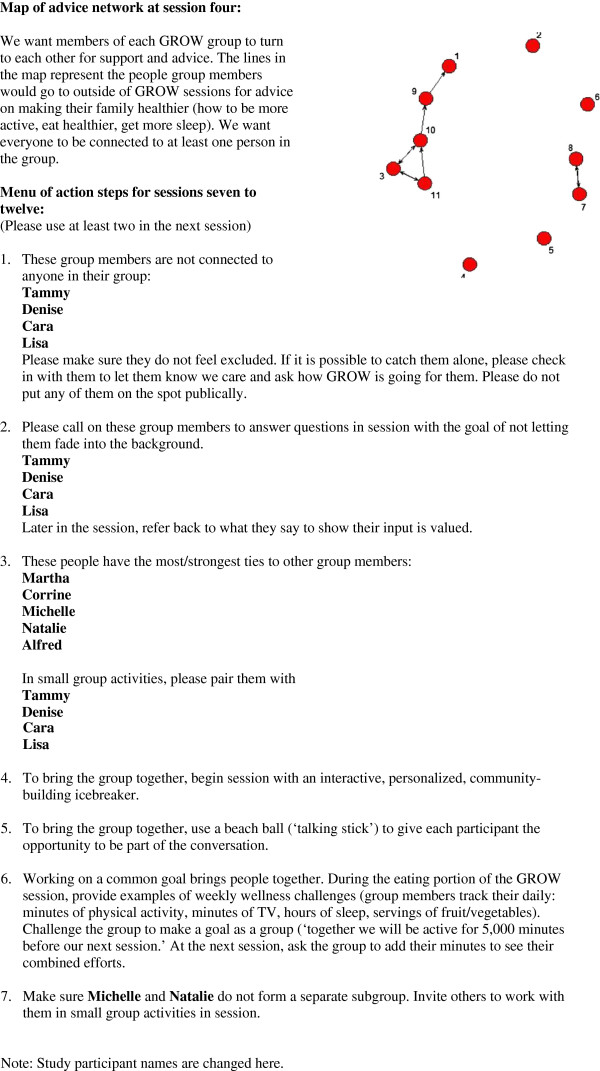
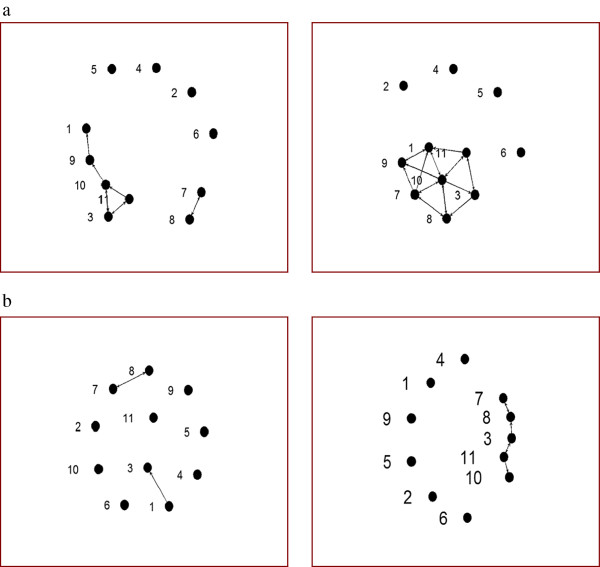
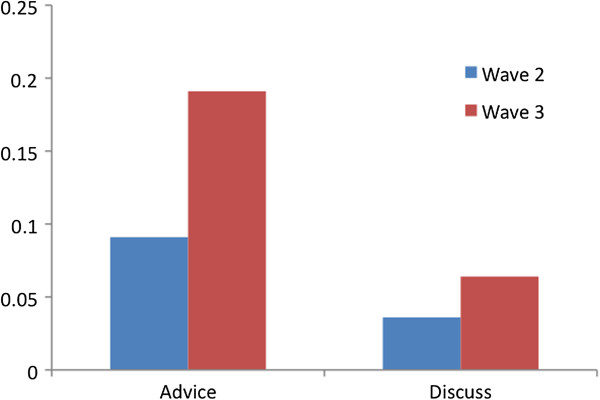
BACKGROUND: Many behavioral interventions designed to improve health outcomes are delivered in group settings. To date, however, group interventions have not been evaluated to determine if the groups generate interaction among members and how changes in group interaction may affect program outcomes at the individual or group level. METHODS: This article presents a model and practical tool for monitoring how social ties and social structure are changing within the group during program implementation. The approach is based on social network analysis and has two phases: collecting network measurements at strategic intervention points to determine if group dynamics are evolving in ways anticipated by the intervention, and providing the results back to the group leader to guide implementation next steps. This process aims to initially increase network connectivity and ultimately accelerate the diffusion of desirable behaviors through the new network. This article presents the Social Network Diagnostic Tool and, as proof of concept, pilot data collected during the formative phase of a childhood obesity intervention. RESULTS: The number of reported advice partners and discussion partners increased during program implementation. Density, the number of ties among people in the network expressed as a percentage of all possible ties, increased from 0.082 to 0.182 (p < 0.05) in the advice network, and from 0.027 to 0.055 (p > 0.05) in the discussion network. CONCLUSIONS: The observed two-fold increase in network density represents a significant shift in advice partners over the intervention period. Using the Social Network Tool to empirically guide program activities of an obesity intervention was feasible.
Overview
The claims and statistics of this paper haven’t been checked yet.
Run the check — free, no account needed. It reads the open-access text and checks the sources it cites.
Integrity signals
Registry
Cites
Statistics
Figures
Verification
Claims the paper makes
The claims and statistics of this paper haven’t been checked yet.
Run the check — free, no account needed. It reads the open-access text and checks the sources it cites.
Claims other papers make about this one
Each is checked against this paper’s own text: does it say what the citing paper says it does?
The source backs part of the claim, not all of it — or backs it for a different population, condition or comparison.
In the citing paper
“At two intervals during the intervention (weeks 3 and 6), network data were collected and the results of the network analysis were given to the interventionist and provided specific advice on activities to use to increase group cohesiveness.”
From Social Network Analysis for Program Implementation (2015) · cites this paper as [70]
Experimental — accuracy not yet measuredIn the citing paper
“These investigators worked with a 12-week program designed to improve lifestyle choices for parents in underserved communities.”
From Social Network Analysis for Program Implementation (2015) · cites this paper as [70]
In the citing paper
“Gesell and colleagues [70] introduced the concept of network diagnostics in which network data are collected and analyzed during program implementation in order to provide diagnostic information useful to the program’s implementation during its delivery.”
From Social Network Analysis for Program Implementation (2015) · cites this paper as [70]
In the citing paper
“We know of only one study, Gesell and others [70], that has used network data during the implementation stage so clearly more experience is needed to determine whether networks can be used to assist program implementation.”
From Social Network Analysis for Program Implementation (2015) · cites this paper as [70]
In the citing paper
“The theory guiding the intervention was that increased social cohesion during the group sessions would improve information seeking and social support among group members, which would translate into better outcomes.”
From Social Network Analysis for Program Implementation (2015) · cites this paper as [70]
In the citing paper
“The recommendations regarding appropriate metrics and thresholds for these metrics were based primarily on experiences with one pilot study, and much work remains to be done in this area.”
From Social Network Analysis for Program Implementation (2015) · cites this paper as [70]
Self-check
Percentages, sums and reported differences re-computed from the paper’s own numbers.
The self-check needs the paper’s full text.
Citations
Cites
Harris, P. A., Taylor, R., Thielke, R., Payne, J., Gonzalez, N., & Conde, J. G. (2009) · Journal of Biomedical Informatics · doi:10.1016/j.jbi.2008.08.010 · Cited by 51,384
Birds of a Feather: Homophily in Social Networks
McPherson, M., Smith-Lovin, L., & Cook, J. M. (2001) · Annual Review of Sociology · doi:10.1146/annurev.soc.27.1.415 · Cited by 18,567
Social Network Analysis: Methods and Applications
Wasserman, S., & Faust, K. (1994) · doi:10.1017/cbo9780511815478 · Cited by 17,557
The Spread of Obesity in a Large Social Network over 32 Years
Christakis, N. A., & Fowler, J. H. (2007) · New England Journal of Medicine · doi:10.1056/nejmsa066082 · Cited by 5,007
Social Contagion and Innovation: Cohesion versus Structural Equivalence
Burt, R. S. (1987) · American Journal of Sociology · doi:10.1086/228667 · Cited by 2,421
Introduction to stochastic actor-based models for network dynamics
Snijders, T. A. B., van de Bunt, G. G., & Steglich, C. E. G. (2010) · Social Networks · doi:10.1016/j.socnet.2009.02.004 · Cited by 2,103
Network models of the diffusion of innovations
Valente, T. W. (1996) · Computational and Mathematical Organization Theory · doi:10.1007/bf00240425 · Cited by 1,657
Self-citationSmith, K. P., & Christakis, N. A. (2008) · Annual Review of Sociology · doi:10.1146/annurev.soc.34.040507.134601 · Cited by 1,638
Medical Innovation: A Diffusion Study.
Mechanic, D., Coleman, J. S., Katz, E., & Menzel, H. (1967) · American Sociological Review · doi:10.2307/2091036 · Cited by 1,383
Communication Networks: Toward a New Paradigm for Research.
Feld, S. L., Rogers, E. M., & Kincaid, D. L. (1982) · Contemporary Sociology A Journal of Reviews · doi:10.2307/2067047 · Cited by 1,298
Research works printed but not linked: 2
- Borgatti SP, Everett MG, Freeman LC: Ucinet for windows: software for social network analysis. 2002, Harvard, MA: Analytic Technologies
- Brown R: Social psychology. 1965, New York: Free Press, Collier Macmillan
Cited by
Sorted by citations
Items 101–120 of 120
Lungeanu, A., McKnight, M., Negron, R., Munar, W. A., Christakis, N. A., & Contractor, N. (2022) · Social Networks · doi:10.1016/j.socnet.2022.01.004
Deville‐Stoetzel, N., Kaczorowski, J. A., Agarwal, G., Lussier, M., & Girard, M. (2020) · Research Square · doi:10.21203/rs.3.rs-79393/v1
Gimeno, M. L. M. (2021) · doi:10.18002/10612/13350
Dorri, N., Afrooz, G., Noohi, F., & Pourhosein, R. (2021) · International Journal of Health Sciences · doi:10.53730/ijhs.v5ns2.13879 · Cited by 1
Andina Díaz, E., Arias Navarro, N., Benítez Andrades, J. A., Marqués Sánchez, P., Ovalle Perandones, M. A., & Pinto Carral, A. (2023) · doi:10.18002/arssalud
Hulvershorn, L. A., Aalsma, M. C., Dellucci, T. V., Burns, A. B., Marriott, B. R., Pescosolido, B. A., Green, H. D., Saldana, L., Chapman, J. E., Monahan, P. O., et al. (2025) · Contemporary Clinical Trials · doi:10.1016/j.cct.2025.107928
Borgatti, A. C., Davis, A. L., & Dutton, G. R. (2025) · Journal of the Academy of Nutrition and Dietetics · doi:10.1016/j.jand.2025.08.008
Trasciani, G., Ghinoi, S., & Conaldi, G. (2025) · Social Networks · doi:10.1016/j.socnet.2025.11.005
Deville‐Stoetzel, N., Kaczorowski, J. A., Agarwal, G., Lussier, M., & Girard, M. (2021) · Figshare · doi:10.6084/m9.figshare.13546565
Fernández‐Peña, R., Ovalle-Perandones, M.-A., Marqués-Sánchez, P., Ortego, C., & Fuentes, N. S. (2022) · Figshare · doi:10.6084/m9.figshare.18132753
Fernández‐Peña, R., Ovalle-Perandones, M.-A., Marqués-Sánchez, P., Ortego, C., & Fuentes, N. S. (2022) · Figshare · doi:10.6084/m9.figshare.18132750
Fernández‐Peña, R., Ovalle-Perandones, M.-A., Marqués-Sánchez, P., Ortego, C., & Fuentes, N. S. (2022) · Figshare · doi:10.6084/m9.figshare.18132747
Chu, K.-H., Matheny, S. J., Furek, A., Sidani, J. E., Radio, S., Miller, E., Valente, T. W., & Robertson, L. B. (2021) · Figshare · doi:10.6084/m9.figshare.13535036
Self-citationDeville‐Stoetzel, N., Kaczorowski, J. A., Agarwal, G., Lussier, M., & Girard, M. (2021) · Figshare · doi:10.6084/m9.figshare.13546559
Additional file 1 of Towards explainable community finding
Sadler, S., Greene, D., & Archambault, D. (2024) · Figshare · doi:10.6084/m9.figshare.26552020
Deville‐Stoetzel, N., Kaczorowski, J. A., Agarwal, G., Lussier, M., & Girard, M. (2021) · Figshare · doi:10.6084/m9.figshare.13546562
Rao, P., Rowe-Nicholls, I., Lang, G., Chen, T., Verdery, A. M., Koehly, L. M., VanDyke, E., Costigan, H. J., Sekhar, D. L., Bingen, K. M., et al. (2026) · doi:10.2196/preprints.91765
Rao, P., Rowe-Nicholls, I., Lang, G., Chen, T., Verdery, A. M., Koehly, L. M., VanDyke, E., Costigan, H. J., Sekhar, D. L., Bingen, K. M., et al. (2026) · JMIR Formative Research · doi:10.2196/91765
Wen, M., Roman, G., Phillips, S. C., Mortaz‐Hedjri, S., Dukelow, N., McGrain, E., Love, T., McGee, M., Mandwell, E., Gravenstede, B., et al. (2026) · Journal of Geriatric Oncology · doi:10.1016/j.jgo.2026.104385
Scott, J., Singapogu, S. D., Logan, A., Haley, L., Bamberg, K., & Magwood, G. (2026) · Journal of Racial and Ethnic Health Disparities · doi:10.1007/s40615-026-03188-4
Metadata
- Authors
- Gesell, S. B., Barkin, S. L., & Valente, T. W.
- Affiliations
- Atrium Health Wake Forest Baptist (US)
- Vanderbilt University (US)
- University of Southern California (US)
- Corresponding author
- Gesell, Sabina B
- Venue
- Implementation Science
- Published
- 2013-10-01
- Volume
- 8
- Issue
- 1
- Pages
- 116-116
- ISSN
- 1748-5908 (ISSN-L)
- PMC
- PMC3851809
- OpenAlex
- W2137036188
- Cited by
- 120
- References
- 39
- Citations by year
- 2026: 5 · 2025: 6 · 2024: 5 · 2023: 8 · 2022: 11 · 2021: 20 · 2020: 15 · 2019: 10 · 2018: 11 · 2017: 8 · 2016: 10 · 2015: 6 · 2014: 4 · 2013: 1
- FWCI
- 12.68
- Type
- journal article
- Language
- en
- Open access
- gold
- doi.org
- Licence
- Locations
- Implementation Science (publishedVersion, cc-by)
- Europe PMC (PubMed Central) (publishedVersion, cc-by)
- PubMed Central (publishedVersion, cc-by)
- PubMed (publishedVersion)
- Funders
- Vanderbilt University (UL1‐TR000445)
- National Institutes of Health (UL1TR000445, DA027828)
- U.S. Public Health Service (UL1TRR24975)
- National Heart, Lung, and Blood Institute (U01HL103620, U01HL03620)
- National Institute on Drug Abuse (P30DA027828)
- National Institute of Diabetes and Digestive and Kidney Diseases (P30DK092986)
- National Center for Research Resources (UL1RR024975)
- Office of Behavioral and Social Sciences Research
- National Center for Advancing Translational Sciences
- Eunice Kennedy Shriver National Institute of Child Health and Human Development (K23HD064700)
- Topics
- Health Sciences › Health Professions › General Health Professions › Health Policy Implementation Science
- Social Sciences › Public Administration › Evaluation and Performance Assessment
- Physical Sciences › Physics and Astronomy › Statistical and Nonlinear Physics › Complex Network Analysis Techniques
- Keywords
- social network analysis, group intervention, intervention monitoring, group dynamics, social ties, network density, childhood obesity intervention, advice networks, formative assessment
- MeSH terms
- Adult, Feasibility Studies, Female, Group Processes, Humans, Male, Models, Theoretical, Obesity, Pilot Projects, Surveys and Questionnaires, Tennessee, Young Adult, Social Networking
About these checks
Registry, retraction, Cites and statistics results are computed, not judged, with one exception: a printed reference that no index lists is read once by a model before it counts as a citation error. Claims are extracted by a model and kept only when their quote appears verbatim in the text; each cited source is then checked, with a model’s help, for whether it says what the claim relies on. Those verdicts can be wrong — read the claim’s quote and the cited source before relying on one.
Statistics and arithmetic are recomputed, not judged.
Confidence bands are shown only for fields calibrated on our annotated test set. None is calibrated yet, so no band is shown.
What counts as a claim ›How we measure confidence ›How we check this ›
Are you an author, or do you see a problem with this page? Request a review
