

The DOI matches its Crossref record; 24 of the 24 references it cites were found in a registry or an index.
Quantitative cross-validation and content analysis of the 450k DNA methylation array from Illumina, Inc.
Open accessAbstract
Background: The newly released 450k DNA methylation array from Illumina, Inc. offers the possibility to analyze more than 480,000 individual CpG sites in a user friendly standardized format. In this study the relationship between the β-values provided by the Illumina, Inc. array for each individual CpG dinucleotide and the quantitative methylation levels obtained by pyrosequencing were analyzed. In addition, the representation of microRNA genes and imprinted loci on the Illumina, Inc. array was assessed in detail. Genomic DNA from 4 human breast cancer cell lines (IPH-926, HCC1937, MDA-MB-134, PMC42) and 18 human breast cancer specimens as well as 4 normal mammary epithelial fractions was analyzed on 450k DNA methylation arrays. The β-values for 692 individual CpG sites from 62 different genes were cross-validated using conventional quantitative pyrosequencing. Findings: The newly released 450k methylation array from Illumina, Inc. shows a high concordance with quantitative pyrosequencing if identical CpG sites are analyzed in cell lines (Spearman r = 0.88, p ≪ 0.0001), which is somewhat reduced in primary tumor specimens (Spearman r = 0.86, p ≪ 0.0001). 80.7% of the CpG sites show an absolute difference in methylation level of less than 15 percentage points. If different CpG sites in the same CpG islands are targeted the concordance is lower (r = 0.83 in cell lines and r = 0.7 in primary tumors). The number of CpG sites representing microRNA genes and imprinted loci is very heterogeneous (range: 1 – 70 CpG sites for microRNAs and 1 – 288 for imprinted loci). Conclusions: The newly released 450k methylation array from Illumina, Inc. provides a genome-wide quantitative representation of DNA methylation aberrations in a convenient format. Overall, the congruence with pyrosequencing data is very good. However, for individual loci one should be careful to translate the β-values directly into percent methylation levels.
Overview
The claims and statistics of this paper haven’t been checked yet.
Run the check — free, no account needed. It reads the open-access text and checks the sources it cites.
Integrity signals
Registry
Cites
Statistics
Figures
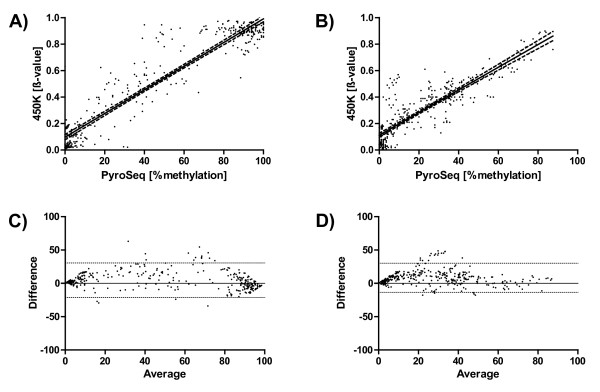
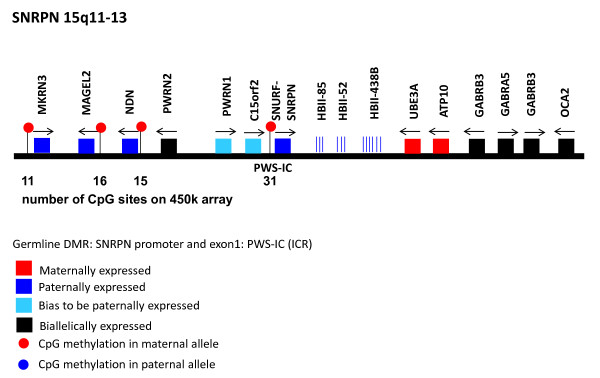
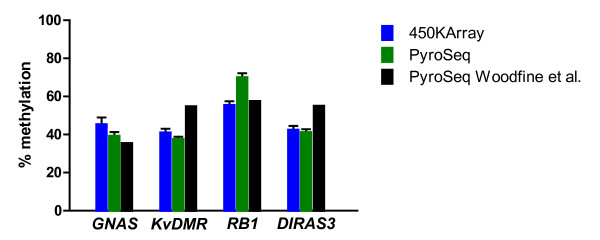
Verification
Claims the paper makes
The claims and statistics of this paper haven’t been checked yet.
Run the check — free, no account needed. It reads the open-access text and checks the sources it cites.
Claims other papers make about this one
Each is checked against this paper’s own text: does it say what the citing paper says it does?
The source backs part of the claim, not all of it — or backs it for a different population, condition or comparison.
In the citing paper
“Profile correlations are also insensitive to the potential problems of normalization because they are dominated by the majority of probes which do not show true differences”
From A data-driven approach to preprocessing Illumina 450K methylation array data (2013) · cites this paper as [14]
Experimental — accuracy not yet measuredThe source backs part of the claim, not all of it — or backs it for a different population, condition or comparison.
In the citing paper
“the minority of intermediate methylation values would be susceptible to far greater changes after normalization but would be overlooked by a correlation test [14]”
From A data-driven approach to preprocessing Illumina 450K methylation array data (2013) · cites this paper as [14]
Experimental — accuracy not yet measuredThe check wasn’t confident either way, so it gives no verdict — never disputed.
In the citing paper
“the majority of CpG sites assayed are in a fully methylated or fully unmethylated state and would change little after normalization”
From A data-driven approach to preprocessing Illumina 450K methylation array data (2013) · cites this paper as [14]
Experimental — accuracy not yet measured
Self-check
Percentages, sums and reported differences re-computed from the paper’s own numbers.
The self-check needs the paper’s full text.
Citations
Cites
STATISTICAL METHODS FOR ASSESSING AGREEMENT BETWEEN TWO METHODS OF CLINICAL MEASUREMENT
Martin Bland, J., & Altman, D. (1986) · The Lancet · doi:10.1016/s0140-6736(86)90837-8 · Cited by 47,965
Beckett, A. H., Rowland, M., & TURNER, P. (1965) · The Lancet · doi:10.1016/s0140-6736(65)91037-8 · Cited by 16,917
Human DNA methylomes at base resolution show widespread epigenomic differences
Lister, R., Pelizzola, M., Dowen, R. H., Hawkins, R. D., Hon, G., Tonti-Filippini, J., Nery, J. R., Lee, L., Ye, Z., Ngo, Q.-M., et al. (2009) · Nature · doi:10.1038/nature08514 · Cited by 4,673
DNA methylation and human disease
Robertson, K. D. (2005) · Nature Reviews Genetics · doi:10.1038/nrg1655 · Cited by 2,864
High density DNA methylation array with single CpG site resolution
Bibikova, M., Barnes, B., Tsan, C., Ho, V., Klotzle, B., Le, J. M., Delano, D., Zhang, L., Schroth, G. P., Gunderson, K. L., et al. (2011) · Genomics · doi:10.1016/j.ygeno.2011.07.007 · Cited by 1,727 · cited 1×
“The HumanMethylation450 BeadChip was developed to assay more than 480,000 CpG sites selected CpG loci in parallel (Bibikova et al., 2011).”
MethodPrinciples and challenges of genome-wide DNA methylation analysis
Laird, P. W. (2010) · Nature Reviews Genetics · doi:10.1038/nrg2732 · Cited by 1,611
DNA methylation profiling of human chromosomes 6, 20 and 22
Eckhardt, F., Lewin, J., Cortese, R., Rakyan, V. K., Attwood, J., Burger, M., Burton, J. H., Cox, T. V., Davies, R., Down, T. A., et al. (2006) · Nature Genetics · doi:10.1038/ng1909 · Cited by 1,378
Validation of a DNA methylation microarray for 450,000 CpG sites in the human genome
Sandoval, J., Heyn, H., Moran, S., Serra-Musach, J., Pujana, M. A., Bibikova, M., & Esteller, M. (2011) · Epigenetics · doi:10.4161/epi.6.6.16196 · Cited by 990 · cited 2×
“The array design, content, and technical performance are well described in two recent publications [7,8].”
BackgroundThe Behaviour of 5-Hydroxymethylcytosine in Bisulfite Sequencing
Huang, Y., Pastor, W. A., Shen, Y., Tahiliani, M., Liu, D. R., & Rao, A. (2010) · PLoS ONE · doi:10.1371/journal.pone.0008888 · Cited by 731
Quantitative comparison of genome-wide DNA methylation mapping technologies
Bock, C., Tomazou, E. M., Brinkman, A. B., Müller, F., Simmer, F., Gu, H., Jäger, N., Gnirke, A., Stunnenberg, H. G., & Meissner, A. (2010) · Nature Biotechnology · doi:10.1038/nbt.1681 · Cited by 604
Cited by
Sorted by citations
A data-driven approach to preprocessing Illumina 450K methylation array data
Pidsley, R., Y Wong, C. C., Volta, M., Lunnon, K., Mill, J., & Schalkwyk, L. C. (2013) · BMC Genomics · doi:10.1186/1471-2164-14-293 · Cited by 1,143
“the majority of CpG sites assayed are in a fully methylated or fully unmethylated state and would change little after normalization, whilst the minority of intermediate methylation values would be susceptible to far greater changes after normalization but would be overlooked by a correlation test [14].”
BackgroundDe novo identification of differentially methylated regions in the human genome
Peters, T. J., Buckley, M. J., Statham, A. L., Pidsley, R., Samaras, K., Lord, R. V., Clark, S. J., & Molloy, P. L. (2015) · Epigenetics & Chromatin · doi:10.1186/1756-8935-8-6 · Cited by 982
An epigenetic clock for gestational age at birth based on blood methylation data
Knight, A. K., Craig, J. M., Theda, C., Bækvad‐Hansen, M., Bybjerg‐Grauholm, J., Hansen, C. S., Hollegaard, M. V., HOUGAARD, D. M., Mortensen, P. B., Weinsheimer, S., et al. (2016) · Genome biology · doi:10.1186/s13059-016-1068-z · Cited by 295
Breton, C. V., Marsit, C. J., Faustman, E. M., Nadeau, K. C., Goodrich, J. M., Dolinoy, D. C., Herbstman, J. B., Holland, N., LaSalle, J. M., Schmidt, R. J., et al. (2017) · Environmental Health Perspectives · doi:10.1289/ehp595 · Cited by 271
DNA methylation and childhood asthma in the inner city
Yang, I. V., Pedersen, B. S., Liu, A., O’Connor, G. T., Teach, S. J., Kattan, M., Misiak, R. T., Gruchalla, R. S., Steinbach, S., Szefler, S. J., et al. (2015) · Journal of Allergy and Clinical Immunology · doi:10.1016/j.jaci.2015.01.025 · Cited by 235
Slieker, R. C., Bos, S. D., Goeman, J. J., Bovée, J. V. M. G., Talens, R. P., van der Breggen, R., Suchiman, H. E. D., Lameijer, E.-W., Putter, H., van den Akker, E. B., et al. (2013) · Epigenetics & Chromatin · doi:10.1186/1756-8935-6-26 · Cited by 234
A comprehensive overview of Infinium HumanMethylation450 data processing
Dedeurwaerder, S., Defrance, M., Bizet, M., Calonne, E., Bontempi, G., & Fuks, F. (2013) · Briefings in Bioinformatics · doi:10.1093/bib/bbt054 · Cited by 238
An epigenome-wide association study of total serum immunoglobulin E concentration
Liang, L., Willis-Owen, S. A. G., Laprise, C., Wong, K. C. C., Davies, G. A., Hudson, T. J., Binia, A., Hopkin, J. M., Yang, I. V., Grundberg, E., et al. (2015) · Nature · doi:10.1038/nature14125 · Cited by 213
Dyson, M. T., Roqueiro, D., Monsivais, D., Ercan, C. M., Pavone, M. E., Brooks, D. C., Kakinuma, T., Ono, M., Jafari, N., Dai, Y., et al. (2014) · PLoS Genetics · doi:10.1371/journal.pgen.1004158 · Cited by 211
Silver, M. J., Kessler, N. J., Hennig, B. J., Domínguez-Salas, P., Laritsky, E., Baker, M. S., Coarfa, C., Hernández‐Vargas, H., Castelino, J. M., Routledge, M. N., et al. (2015) · Genome biology · doi:10.1186/s13059-015-0660-y · Cited by 188
Shen, J., Wang, S., Zhang, Y., Wu, H., Kibriya, M. G., Jasmine, F., Ahsan, H., Wu, D., Siegel, A. B., Remotti, H. E., et al. (2012) · Epigenetics · doi:10.4161/epi.23062 · Cited by 157
Analysis pipelines and packages for Infinium HumanMethylation450 BeadChip (450k) data
Morris, T. J., & Beck, S. (2014) · Methods · doi:10.1016/j.ymeth.2014.08.011 · Cited by 143
DNA methylation profiles of long- and short-term glioblastoma survivors
Shinawi, T., Hill, V. K., Krex, D., Schackert, G., Gentle, D., Morris, M. R., Wei, W., Cruickshank, G. S., Maher, E. R., & Latif, F. (2013) · Epigenetics · doi:10.4161/epi.23398 · Cited by 129
McDermott, E., Ryan, E. J., Tosetto, M., Gibson, D. J., Burrage, J., Keegan, D., Byrne, K., Crowe, E., Sexton, G., Malone, K. M., et al. (2015) · Journal of Crohn s and Colitis · doi:10.1093/ecco-jcc/jjv176 · Cited by 131
COHCAP: an integrative genomic pipeline for single-nucleotide resolution DNA methylation analysis
Warden, C., Lee, H., Tompkins, J. D., Li, X., Wang, C., Riggs, A. D., Yu, H., Jove, R., & Yuan, Y. (2013) · Nucleic Acids Research · doi:10.1093/nar/gkt242 · Cited by 108
Fetal DNA Methylation Associates with Early Spontaneous Preterm Birth and Gestational Age
Parets, S. E., Conneely, K. N., Kilaru, V., Fortunato, S. J., Syed, T. A., Saade, G. R., Smith, A. K., & Menon, R. (2013) · PLoS ONE · doi:10.1371/journal.pone.0067489 · Cited by 109
Huang, R., Garratt, E. S., Pan, H., Wu, Y., Davis, E. A., Barton, S. J., Burdge, G. C., Godfrey, K. M., Holbrook, J. D., & Lillycrop, K. A. (2015) · Epigenetics · doi:10.1080/15592294.2015.1080411 · Cited by 96
Glossop, J. R., Glossop, J. R., Emes, R. D., Emes, R. D., Nixon, N. B., Nixon, N. B., Haworth, K. E., Haworth, K. E., Packham, J., Packham, J., et al. (2014) · Epigenetics · doi:10.4161/epi.29718 · Cited by 89
Argos, M., Chen, L., Jasmine, F., Lin, T., Pierce, B. L., Roy, S., Paul-Brutus, R., Gamble, M. V., Harper, K. N., Parvez, F., et al. (2014) · Environmental Health Perspectives · doi:10.1289/ehp.1307884 · Cited by 84
Pan, H., Chen, L., Dogra, S. K., Teh, A. L., Tan, J. H., Lim, I. Y., Lim, Y. C., Jin, S., Lee, Y. K., Ng, P. Y., et al. (2012) · Epigenetics · doi:10.4161/epi.22102 · Cited by 79
Cytosine methylation predicts renal function decline in American Indians
Qiu, C., Hanson, R. L., Fufaa, G. D., Kobes, S., Gluck, C. A., Huang, J. Y., Chen, Y., Raj, D. S., Nelson, R. G., Knowler, W. C., et al. (2018) · Kidney International · doi:10.1016/j.kint.2018.01.036 · Cited by 78
Nightshift work and genome-wide DNA methylation
Bhatti, P., Zhang, Y., Song, X., Makar, K. W., Sather, C. L., Kelsey, K. T., Houseman, E. A., & Wang, P. (2014) · Chronobiology International · doi:10.3109/07420528.2014.956362 · Cited by 80
Quantitative, genome-wide analysis of the DNA methylome in sporadic pituitary adenomas
Duong, C. V., Emes, R. D., Wessely, F., Yacqub‐Usman, K., Clayton, R. N., & Farrell, W. E. (2012) · Endocrine Related Cancer · doi:10.1530/erc-12-0251 · Cited by 73
Yousefi, P., Huen, K., Schall, R. A., Decker, A., Elboudwarej, E., Quach, H., Barcellos, L. F., & Holland, N. (2013) · Epigenetics · doi:10.4161/epi.26037 · Cited by 72
Asbestos‐associated genome‐wide DNA methylation changes in lung cancer
Kettunen, E., Hernández‐Vargas, H., Cros, M., Durand, G., Calvez‐Kelm, F. L., Stuopelytė, K., Jarmalaitė, S., Salmenkivi, K., Anttila, S. L., Wolff, H. J., et al. (2017) · International Journal of Cancer · doi:10.1002/ijc.30897 · Cited by 68
Epigenome-wide association study links site-specific DNA methylation changes with cow's milk allergy
Hong, X., Ladd‐Acosta, C., Hao, K., Sherwood, B., Ji, H., Keet, C. A., Kumar, R., Caruso, D., Liu, X., Wang, G., et al. (2016) · Journal of Allergy and Clinical Immunology · doi:10.1016/j.jaci.2016.01.056 · Cited by 65
Johnson, K. C., Koestler, D. C., Fleischer, T., Chen, P., Jenson, E. G., Marotti, J. D., Onega, T., Kristensen, V. N., & Christensen, B. C. (2015) · Clinical Epigenetics · doi:10.1186/s13148-015-0094-0 · Cited by 63
Methylomic changes during conversion to psychosis
the ICAAR team, Kébir, O., Chaumette, B., Rivollier, F., Miozzo, F., Perreault, L. L., Barhdadi, A., Provost, S., Plaze, M., Bourgin, J., et al. (2016) · Molecular Psychiatry · doi:10.1038/mp.2016.53 · Cited by 90
Viuff, A. F., Sharp, G. C., Rai, D., Henriksen, T. B., Pedersen, L. H., Kyng, K. J., Staunstrup, N. H., Hidalgo, A. P. C., Neumann, A., Felix, J. F., et al. (2018) · Translational Psychiatry · doi:10.1038/s41398-018-0286-4 · Cited by 58
Zhang, H., Tong, X., Holloway, J. W., Rezwan, F. I., Lockett, G. A., Patil, V. K., Ray, M. A., Everson, T. M., Soto-Ramírez, N., Arshad, S. H., et al. (2014) · Clinical Epigenetics · doi:10.1186/1868-7083-6-8 · Cited by 57
Hong, X., Sherwood, B., Ladd‐Acosta, C., Peng, S., Ji, H., Hao, K., Burd, I. D., Bartell, T. R., Wang, G., Tsai, H., et al. (2017) · Epigenetics · doi:10.1080/15592294.2017.1287654 · Cited by 58
Identification of DNA methylation biomarkers from Infinium arrays
Wessely, F., & Emes, R. D. (2012) · Frontiers in Genetics · doi:10.3389/fgene.2012.00161 · Cited by 52
TMEM25 is a candidate biomarker methylated and down-regulated in colorectal cancer.
Hrašovec, S., Hauptman, N., Glavač, D., Jelenc, F., & Ravnik‐Glavač, M. (2013) · Europe PMC (PubMed Central) · doi:10.3233/dma-120948 · Cited by 51
TMEM25Is a Candidate Biomarker Methylated and Down-Regulated in Colorectal Cancer
Hrašovec, S., Hauptman, N., Glavač, D., Jelenc, F., & Ravnik‐Glavač, M. (2013) · Disease Markers · doi:10.1155/2013/427890 · Cited by 50
Oliver, V. F., Franchina, M., Jaffe, A. E., Branham, K. E. H., Othman, M., Heckenlively, J. R., Swaroop, A., Campochiaro, B., Vote, B. J. T., Craig, J. E., et al. (2013) · Cell Reports · doi:10.1016/j.celrep.2013.11.042 · Cited by 50
Persistent organic pollutants alter DNA methylation during human adipocyte differentiation
van den Dungen, M. W., Murk, A. J., Kok, D. E. G., & Steegenga, W. T. (2016) · Toxicology in Vitro · doi:10.1016/j.tiv.2016.12.011 · Cited by 49
Genome-Wide DNA Methylation Patterns Analysis of Noncoding RNAs in Temporal Lobe Epilepsy Patients
Xiao, W., Cao, Y., Long, H., Luo, Z., Li, S., Deng, N., Wang, J., Lu, X., Wang, T., Ning, S., et al. (2017) · Molecular Neurobiology · doi:10.1007/s12035-016-0353-x · Cited by 47
Establishing an analytic pipeline for genome-wide DNA methylation
Wright, M. L., Dozmorov, M. G., Wolen, A. R., Jackson‐Cook, C. K., Starkweather, A. R., Lyon, D., & York, T. P. (2016) · Clinical Epigenetics · doi:10.1186/s13148-016-0212-7 · Cited by 47
Methylomic analysis of monozygotic twins discordant for childhood psychotic symptoms
Fisher, H. L., Murphy, T. M., Arseneault, L., Caspi, A., Moffitt, T. E., Viana, J. F., Hannon, E. J., Pidsley, R., Burrage, J., Dempster, E. L., et al. (2015) · Epigenetics · doi:10.1080/15592294.2015.1099797 · Cited by 47
Quantitative genome-wide methylation analysis of high-grade non-muscle invasive bladder cancer
Kitchen, M., Bryan, R. T., Emes, R. D., Glossop, J. R., Luscombe, C. J., Cheng, K. K., Zeegers, M. P., James, N. D., Devall, A., Mein, C. A., et al. (2016) · Epigenetics · doi:10.1080/15592294.2016.1154246 · Cited by 44
Svendsen, A. J., Gervin, K., Lyle, R., Christiansen, L., Kyvik, K. O., Junker, P., Nielsen, C., Houen, G., & Tan, Q. (2016) · Frontiers in Immunology · doi:10.3389/fimmu.2016.00510 · Cited by 45
Salas‐Pérez, F., Ramos-López, O., Mansego, M. L., Milagro, F. I., Santos, J. L., Riezu‐Boj, J. I., & Martínez, J. A. (2019) · Aging · doi:10.18632/aging.101882 · Cited by 45
Glossop, J. R., Nixon, N. B., Emes, R. D., Haworth, K. E., Packham, J., Dawes, P. T., Fryer, A. A., Mattey, D. L., & Farrell, W. E. (2013) · Epigenetics · doi:10.4161/epi.26265 · Cited by 40
Murphy, T. M., Wong, C. C. Y., Arseneault, L., Burrage, J., Macdonald, R., Hannon, E. J., Fisher, H. L., Ambler, A. P., Moffitt, T. E., Caspi, A., et al. (2015) · Clinical Epigenetics · doi:10.1186/s13148-015-0163-4 · Cited by 39
Ek, W. E., Hedman, Å. K., Enroth, S., Morris, A. P., Lindgren, C. M., Mahajan, A., Gustafsson, S., Gyllensten, U. B., Lind, L., & Johansson, Å. (2015) · Human Molecular Genetics · doi:10.1093/hmg/ddv511 · Cited by 39
Epigenetic Regulation of F2RL3 Associates With Myocardial Infarction and Platelet Function
Corbin, L. J., Taylor, A. E., White, S. J., Williams, C. M., Taylor, K., van den Bosch, M. T. J., Teasdale, J. E., Jones, M., Bond, M., Harper, M. T., et al. (2022) · Circulation Research · doi:10.1161/circresaha.121.318836 · Cited by 40
Role of epigenomic mechanisms in the onset and management of insulin resistance
Izquierdo, A. G., & Crujeiras, A. B. (2019) · Reviews in Endocrine and Metabolic Disorders · doi:10.1007/s11154-019-09485-0 · Cited by 39
Furuse, T., Miyake, K., Kohda, T., Kaneda, H., Hirasawa, T., Yamada, I., Kushida, T., Kashimura, M., Kobayashi, K., Ishino, F., et al. (2017) · Genes & Nutrition · doi:10.1186/s12263-016-0550-2 · Cited by 36
Brückmann, C., Santo, A. D., Karle, K. N., Batra, A., & Nieratschker, V. (2016) · Epigenetics · doi:10.1080/15592294.2016.1179411 · Cited by 37
Tea and coffee consumption in relation to DNA methylation in four European cohorts
Ek, W. E., Tobi, E. W., Ahsan, M., Lampa, E., Ponzi, E., Kyrtopoulos, S. Α., Georgiadis, P., Lumey, L. H., Heijmans, B. T., Botsivali, M., et al. (2017) · Human Molecular Genetics · doi:10.1093/hmg/ddx194 · Cited by 35
Kolarova, J., Tangen, I. M., Bens, S., Gillessen‐Kaesbach, G., Gutwein, J., Kautza, M., Rydzanicz, M., Stephani, U., Siebert, R., Ammerpohl, O., et al. (2015) · European Journal of Medical Genetics · doi:10.1016/j.ejmg.2015.05.001 · Cited by 34
Self-citationJoo, J. E., Hiden, U., Lassance, L., Gordon, L., Martino, D., Desoyé, G., & Saffery, R. (2013) · BMC Genomics · doi:10.1186/1471-2164-14-475 · Cited by 33
Pyrosequencing Methylation Analysis
Poulin, M. L., Zhou, J. Y., Yan, L., & Shioda, T. (2018) · Methods in molecular biology · doi:10.1007/978-1-4939-8751-1_17 · Cited by 30
Methylation Levels of SLC23A2 and NCOR2 Genes Correlate with Spinal Muscular Atrophy Severity
Zheleznyakova, G. Y., Nilsson, E., Kiselev, A., Maretina, M. A., Tishchenko, L. I., Fredriksson, R., Баранов, В. С., & Schiöth, H. B. (2015) · PLoS ONE · doi:10.1371/journal.pone.0121964 · Cited by 30
Jiang, J.-X., AITKEN, K. J., Sotiropolous, C., Kirwan, T., Panchal, T., Zhang, N. J., Pu, S., Wodak, S. J., Tölg, C., & Bägli, D. (2013) · PLoS ONE · doi:10.1371/journal.pone.0069089 · Cited by 29
The CpG Island Methylator Phenotype in Breast Cancer is Associated with the Lobular Subtype
Roessler, J., Ammerpohl, O., Gutwein, J., Steinemann, D., Schlegelberger, B., Weyer, V., Sariyar, M., Geffers, R., Arnold, N., Schmutzler, R. K., et al. (2014) · Epigenomics · doi:10.2217/epi.14.74 · Cited by 28
Self-citationTost, J. (2016) · Advances in experimental medicine and biology · doi:10.1007/978-3-319-43624-1_15 · Cited by 26
DNA methylation, colon cancer and Mediterranean diet: results from the EPIC-Italy cohort
Fasanelli, F., Giraudo, M. T., Vineis, P., Fiano, V., Fiorito, G., Grasso, C., Polidoro, S., Trevisan, M., Grioni, S., Krogh, V., et al. (2019) · Epigenetics · doi:10.1080/15592294.2019.1629230 · Cited by 26
Glossop, J. R., Haworth, K. E., Emes, R. D., Nixon, N. B., Packham, J., Dawes, P. T., Fryer, A. A., Mattey, D. L., & Farrell, W. E. (2015) · Epigenomics · doi:10.2217/epi.15.15 · Cited by 24
O’Doherty, A. M., McGettigan, P., Irwin, R. E., Magee, D. A., Gagné, D., Fournier, É., Al-Naib, A., Sirard, M., Walsh, C. P., Robert, C., et al. (2018) · BMC Genomics · doi:10.1186/s12864-018-4818-3 · Cited by 25
Hyper-Methylated Loci Persisting from Sessile Serrated Polyps to Serrated Cancers
Andrew, A. S., Baron, J. A., Butterly, L. F., Suriawinata, A. A., Tsongalis, G. J., Robinson, C. M., & Amos, C. I. (2017) · International Journal of Molecular Sciences · doi:10.3390/ijms18030535 · Cited by 23
Draškovič, T., & Hauptman, N. (2024) · Scientific Reports · doi:10.1038/s41598-024-53754-1 · Cited by 22
Iudici, A., & Corsi, A. G. (2016) · Evaluation and Program Planning · doi:10.1016/j.evalprogplan.2016.11.016 · Cited by 21
Husni, R. E., Shiba‐Ishii, A., Nakagawa, T., Dai, T., Kim, Y., Hong, J., Sakashita, S., Sakamoto, N., Sato, Y., & Noguchi, M. (2019) · Oncotarget · doi:10.18632/oncotarget.26676 · Cited by 21
Correlation of Infinium HumanMethylation450K and MethylationEPIC BeadChip arrays in cartilage
Cheung, K., Burgers, M. J., Young, D. A., Cockell, S., & Reynard, L. N. (2019) · Epigenetics · doi:10.1080/15592294.2019.1700003 · Cited by 20
Chen, S., Refaey, H., Mukherjee, N., Solatikia, F., Jiang, Y., Arshad, S. H., Ewart, S., Holloway, J. W., Zhang, H., & Karmaus, W. (2020) · Human Reproduction Open · doi:10.1093/hropen/hoaa006 · Cited by 20
A validation of Illumina EPIC array system with bisulfite-based amplicon sequencing
Noble, A. J., Pearson, J. F., Boden, J. M., Horwood, L. J., Gemmell, N. J., Kennedy, M. A., & Osborne, A. J. (2021) · PeerJ · doi:10.7717/peerj.10762 · Cited by 18
Raffetti, E., Melas, P. A., Landgren, A. J., Andersson, F., Forsell, Y., Lavebratt, C., & Galanti, M. R. (2021) · Translational Psychiatry · doi:10.1038/s41398-021-01601-6 · Cited by 19
Rijlaarsdam, M. A., van der Zwan, Y. G., Dorssers, L. C. J., & Looijenga, L. H. J. (2014) · BMC Bioinformatics · doi:10.1186/1471-2105-15-141 · Cited by 20
Kébir, O., Chaumette, B., & Krebs, M. (2018) · Translational Psychiatry · doi:10.1038/s41398-018-0138-2 · Cited by 19
Allele-Specific Methylation of SPDEF: A Novel Moderator of Psychosocial Stress and Substance Abuse
Tay, N., Macare, C., Liu, Y., Ruggeri, B., Jia, T., Chu, C., Biondo, F., Ing, A., Luo, Q., Sarkysian, D., et al. (2019) · American Journal of Psychiatry · doi:10.1176/appi.ajp.2018.17121360 · Cited by 18
Novel predictive epigenetic signature for temozolomide in non-G-CIMP glioblastomas
Yin, A., He, Y., Etcheverry, A., Liu, Y., Aubry, M., Barnholtz‐Sloan, J. S., Liu, B.-L., Mosser, J., Lu, Z.-F., & Zhang, X. (2019) · Clinical Epigenetics · doi:10.1186/s13148-019-0670-9 · Cited by 18
Quantitative DNA Methylation Analysis by Pyrosequencing®
Roessler, J., & Lehmann, U. (2015) · Methods in molecular biology · doi:10.1007/978-1-4939-2715-9_13 · Cited by 18
Self-citationMeasured Maternal Prepregnancy Anthropometry and Newborn DNA Methylation
Yeung, E. H., Guan, W., Mumford, S. L., Silver, R. M., Zhang, C., Tsai, M. Y., & Schisterman, E. F. (2019) · Epigenomics · doi:10.2217/epi-2018-0099 · Cited by 17
Integrative analysis of novel hypomethylation and gene expression signatures in glioblastomas
Yin, A., Etcheverry, A., He, Y., Aubry, M., Barnholtz‐Sloan, J. S., Zhang, L., Mao, X., Chen, W., Liu, B., Zhang, W., et al. (2017) · Oncotarget · doi:10.18632/oncotarget.19171 · Cited by 17
Iqbal, S., Lockett, G. A., Holloway, J. W., Arshad, S. H., Zhang, H., Kaushal, A., Tetali, S. R., Mukherjee, N., & Karmaus, W. (2018) · International Journal of Molecular Sciences · doi:10.3390/ijms19020477 · Cited by 17
Tost, J. (2022) · Advances in experimental medicine and biology · doi:10.1007/978-3-031-11454-0_16 · Cited by 15
Yu, L., Zhang, C., & Dai, D.-Q. (2019) · Pathology - Research and Practice · doi:10.1016/j.prp.2019.152570 · Cited by 14
Determination of DNA Methylation Levels Using Illumina HumanMethylation450 BeadChips
Carless, M. A. (2015) · Methods in molecular biology · doi:10.1007/978-1-4939-2474-5_10 · Cited by 13
Disruption of the gene regulatory programme in neurodevelopmental disorders
Griffin, A., Mahesh, A., & Tiwari, V. K. (2022) · Biochimica et Biophysica Acta (BBA) - Gene Regulatory Mechanisms · doi:10.1016/j.bbagrm.2022.194860 · Cited by 14
Magnusson, M., Larsson, P., Lu, E., Bergh, N., Carén, H., & Jern, S. (2016) · Epigenetics · doi:10.1080/15592294.2016.1192734 · Cited by 12
Fragoso-Bargas, N., Opsahl, J. O., Kiryushchenko, N., Böttcher, Y., Lee-Ødegård, S., Qvigstad, E., Richardsen, K. R., Waage, C. W., Sletner, L., Jenum, A. K., et al. (2021) · PLoS ONE · doi:10.1371/journal.pone.0256158 · Cited by 11
Targeted DNA Methylation Analysis Facilitates Leukocyte Counts in Dried Blood Samples
Hubens, W. H. G., Maié, T., Schnitker, M., Bocova, L., Puri, D., Wessiepe, M., Kramer, J., Rink, L., Koschmieder, S., Costa, I. G., et al. (2023) · Clinical Chemistry · doi:10.1093/clinchem/hvad143 · Cited by 10
Analysis of DNA methylation using pyrosequencing
Kumar, A., Dalan, E., & Carless, M. A. (2020) · Elsevier eBooks · doi:10.1016/b978-0-12-819414-0.00003-3 · Cited by 10
Establishing a stable, repeatable platform for measuring changes in sperm DNA methylation
Abbasi, M., Smith, A. D., Swaminathan, H., Sangngern, P., Douglas, A., Horsager, A., Carrell, D. T., & Uren, P. J. (2018) · Clinical Epigenetics · doi:10.1186/s13148-018-0551-7 · Cited by 9
Commodore, S., Mukherjee, N., Chung, D., Svendsen, E. R., Vena, J. E., Pearce, J. L., Roberts, J. R., Arshad, S. H., & Karmaus, W. (2018) · Current Zoology · doi:10.1093/eep/dvy028 · Cited by 8
Epigenetic biomarkers in metabolic syndrome and obesity
Izquierdo, A. G., & Crujeiras, A. B. (2019) · Elsevier eBooks · doi:10.1016/b978-0-12-814259-2.00011-x · Cited by 8
Molecular Techniques for DNA Methylation Studies
Tost, J., & Gut, I. G. (2016) · Elsevier eBooks · doi:10.1016/b978-0-12-802971-8.00007-9 · Cited by 9
Yu, C., Dugué, P., Dowty, J. G., Hammet, F., Joo, J. E., Wong, E. M., Hosseinpour, M., Giles, G. G., Hopper, J. L., Nguyen‐Dumont, T., et al. (2021) · BMC Research Notes · doi:10.1186/s13104-021-05809-z · Cited by 6
Molecular Diagnostic Techniques and Biotechnology in Plant Biosecurity
Lévy, L., Shiel, P. J., Dennis, G., Lévesque, C. A., Clover, G. R. G., Bennypaul, H., Barr, N. B., RODA, A. L., Young, R., Plazinski, J., et al. (2013) · Springer eBooks · doi:10.1007/978-94-007-7365-3_13 · Cited by 6
Shade, D. C., Park, H. J., Hausman, D. B., Hohos, N. M., Meagher, R. B., KAUWELL, G. P. A., Kilaru, V., Lewis, R. D., Smith, A. K., & Bailey, L. B. (2017) · International Journal for Vitamin and Nutrition Research · doi:10.1024/0300-9831/a000491 · Cited by 6
Lee, S., Weng, J. T.-Y., Hsu, P. W.-C., Chuang, T., Liu, C., Chen, C., & Wu, L. S. (2018) · Pharmacogenetics and Genomics · doi:10.1097/fpc.0000000000000325 · Cited by 5
Wang, J., Zhang, M., Liu, Y.-F., Yao, Y., Ji, Y.-S., Etcheverry, A., Chen, K., Song, B., Lin, W. J., Yin, A., et al. (2022) · Epigenomics · doi:10.2217/epi-2022-0344 · Cited by 5
Direct comparisons of bisulfite pyrosequencing versus targeted bisulfite sequencing
King, D. E., Sparling, A. C., Joglekar, R., Meyer, J. N., & Murphy, S. K. (2021) · PubMed Central · doi:10.17912/micropub.biology.000444 · Cited by 3
A new parsimonious method for classifying Cancer Tissue-of-Origin Based on DNA Methylation 450K dataPreprint
Jia, S., Zhang, Y., Mao, Y., Gao, J., Chen, Y., Jiang, Y., Luo, H., Lv, K., & Su, J. (2021) · arXiv (Cornell University) · doi:10.48550/arxiv.2101.00570 · Cited by 2
Poggiali, B., Børsting, C., Kampmann, M., Wiuf, M., Kelager, A., Jepsen, A. H., Vidaki, A., Tfelt‐Hansen, J., & Andersen, J. D. (2026) · Forensic Science International Genetics · doi:10.1016/j.fsigen.2026.103438 · Cited by 2
Duong, C. V. (2014) · Keele Research Repository (Keele University) · Cited by 1
Jiang, J.-X., AITKEN, K. J., Sotiropoulos, C., Kirwan, T., Panchal, T., Zhang, N. J., Pu, S., Wodak, S. J., Tölg, C., & Bägli, D. (2013) · PLoS ONE · doi:10.1371/annotation/c825c71c-bb8a-456f-9ed4-83969a76429c · Cited by 1
Anomalias genéticas e epigenéticas no tumor embrionário hepatoblastoma
Rodrigues, T. C. (2015) · Digital Library of Theses and Dissertations (Universidade de São Paulo) · doi:10.11606/t.41.2015.tde-20052015-084143
Veränderungen der DNA-Methylierung bei männlicher Infertilität
Friemel, C. (2015) · Multimedialen Archiv und Publikationsserver der Christian-Albrechts-Universität zu Kiel (Christian-Albrechts-Universität zu Kiel)
Metadata
- Authors
- Roessler, J., Ammerpohl, O., Gutwein, J., Hasemeier, B., Anwar, S. L., Kreipe, H., & Lehmann, U.
- Affiliations
- Medizinische Hochschule Hannover (DE)
- University Hospital Schleswig-Holstein (DE)
- Corresponding author
- Lehmann, Ulrich
- Venue
- BMC Research Notes
- Published
- 2012-04-30
- Volume
- 5
- Issue
- 1
- Pages
- 210-210
- ISSN
- 1756-0500 (ISSN-L)
- PMC
- PMC3420245
- OpenAlex
- W2097998761
- Cited by
- 112
- References
- 24
- Citations by year
- 2026: 3 · 2024: 1 · 2023: 1 · 2022: 4 · 2021: 11 · 2020: 2 · 2019: 9 · 2018: 10 · 2017: 10 · 2016: 15 · 2015: 18 · 2014: 9 · 2013: 15 · 2012: 4
- FWCI
- 5.92
- Type
- journal article
- Language
- en
- Open access
- gold
- doi.org
- Licence
- cc-by
- Locations
- BMC Research Notes (publishedVersion, cc-by)
- PubMed Central (publishedVersion, cc-by)
- PubMed (publishedVersion)
- DOAJ (DOAJ: Directory of Open Access Journals) (submittedVersion)
- Funders
- Deutsche Forschungsgemeinschaft (SFB TRR77, Project B1, TRR77)
- Deutsche Krebshilfe
- Topics
- Life Sciences › Biochemistry, Genetics and Molecular Biology › Molecular Biology › Epigenetics and DNA Methylation
- Life Sciences › Biochemistry, Genetics and Molecular Biology › Molecular Biology › Gene expression and cancer classification
- Life Sciences › Biochemistry, Genetics and Molecular Biology › Genetics › Genetic Syndromes and Imprinting
- Keywords
- DNA methylation, 450k methylation array, pyrosequencing, CpG sites, breast cancer, microRNA genes, genomic imprinting, imprinted loci, CpG islands, mammary epithelial cells
- MeSH terms
- Breast Neoplasms, Female, Humans, Reproducibility of Results, Sequence Analysis, DNA, Genomic Imprinting, DNA Methylation, Base Pairing, Cell Line, Tumor, snRNP Core Proteins, Genetic Loci
About these checks
Registry, retraction, Cites and statistics results are computed, not judged, with one exception: a printed reference that no index lists is read once by a model before it counts as a citation error. Claims are extracted by a model and kept only when their quote appears verbatim in the text; each cited source is then checked, with a model’s help, for whether it says what the claim relies on. Those verdicts can be wrong — read the claim’s quote and the cited source before relying on one.
Statistics and arithmetic are recomputed, not judged.
Confidence bands are shown only for fields calibrated on our annotated test set. None is calibrated yet, so no band is shown.
What counts as a claim ›How we measure confidence ›How we check this ›
Are you an author, or do you see a problem with this page? Request a review
