

The DOI matches its Crossref record; 28 of the 28 references it cites were found in a registry or an index.
Choice of bacterial DNA extraction method from fecal material influences community structure as evaluated by metagenomic analysis
Open accessAbstract
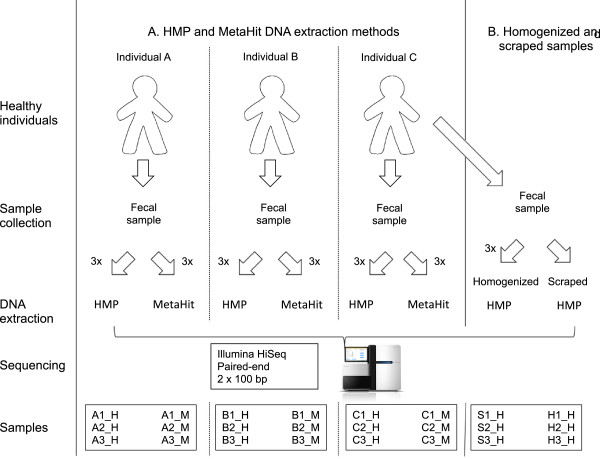
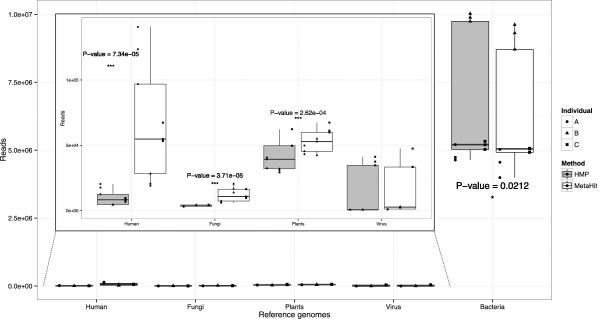
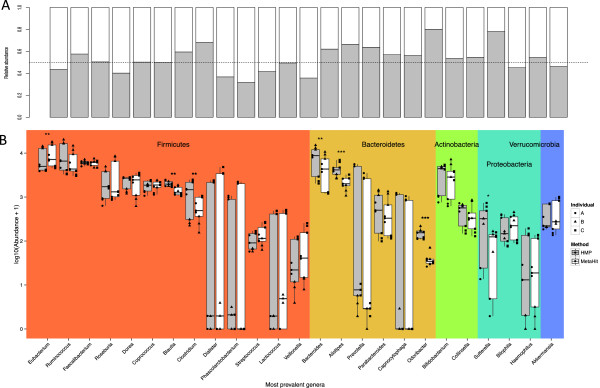
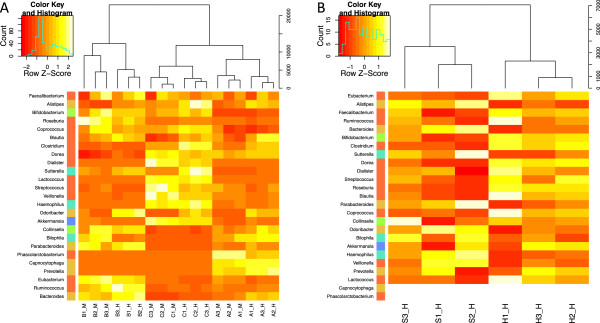
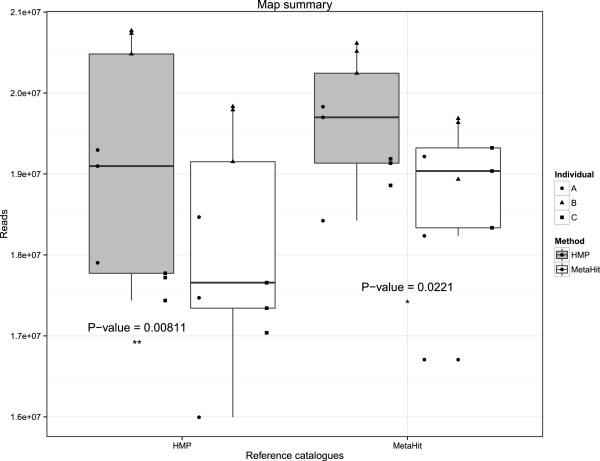
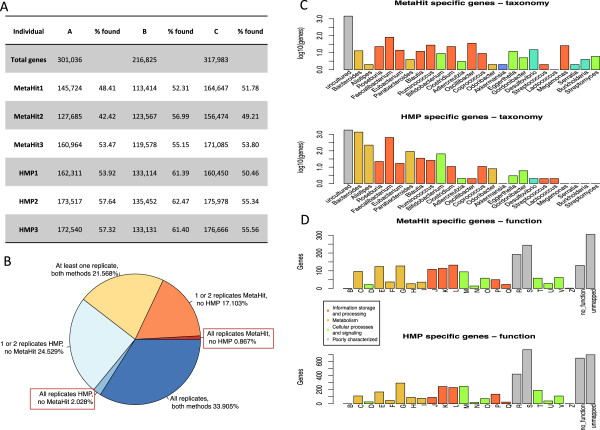
BACKGROUND: In recent years, studies on the human intestinal microbiota have attracted tremendous attention. Application of next generation sequencing for mapping of bacterial phylogeny and function has opened new doors to this field of research. However, little attention has been given to the effects of choice of methodology on the output resulting from such studies. RESULTS: IN THIS STUDY WE CONDUCTED A SYSTEMATIC COMPARISON OF THE DNA EXTRACTION METHODS USED BY THE TWO MAJOR COLLABORATIVE EFFORTS: The European MetaHIT and the American Human Microbiome Project (HMP). Additionally, effects of homogenizing the samples before extraction were addressed. We observed significant differences in distribution of bacterial taxa depending on the method. While eukaryotic DNA was most efficiently extracted by the MetaHIT protocol, DNA from bacteria within the Bacteroidetes phylum was most efficiently extracted by the HMP protocol. CONCLUSIONS: Whereas it is comforting that the inter-individual variation clearly exceeded the variation resulting from choice of extraction method, our data highlight the challenge of comparing data across studies applying different methodologies.
Overview
The claims and statistics of this paper haven’t been checked yet.
Run the check — free, no account needed. It reads the open-access text and checks the sources it cites.
Integrity signals
Registry
Cites
Statistics
Figures
Verification
Claims the paper makes
The claims and statistics of this paper haven’t been checked yet.
Run the check — free, no account needed. It reads the open-access text and checks the sources it cites.
Claims other papers make about this one
Each is checked against this paper’s own text: does it say what the citing paper says it does?
The source backs part of the claim, not all of it — or backs it for a different population, condition or comparison.
In the citing paper
“comparisons of results from the Human Microbiome Project (HMP) with the MetaHIT project showed stark differences in microbiome profiles, and indicated that the HMP protocol was less effective at extracting DNA from eukaryotes and Gram-positive bacterial lineages 35 .”
From Human microbiome myths and misconceptions (2023) · cites this paper as [35]
Experimental — accuracy not yet measuredThe cited source says what the claim attributes to it.
In the citing paper
“Previous detailed investigations of specific variables in microbiome experiments such as DNA extraction method have, in common with the results we report, enriched for broad classes of Gram-negative rather than Gram-positive bacteria due to technical rather than biological variables9, 24, 27, 28.”
From Assessment of variation in microbial community amplicon sequencing by the Microbiome Quality Control (MBQC) project consortium (2017) · cites this paper as [24]
Self-check
Percentages, sums and reported differences re-computed from the paper’s own numbers.
The self-check needs the paper’s full text.
Citations
Cites
Fast and accurate short read alignment with Burrows-Wheeler transform
Li, H., & Durbin, R. (2009) · Bioinformatics · doi:10.1093/bioinformatics/btp324 · Cited by 58,607
BLAST+: architecture and applications
Camacho, C., Coulouris, G., Avagyan, V., Ma, N., Papadopoulos, J., Bealer, K., & Madden, T. L. (2009) · BMC Bioinformatics · doi:10.1186/1471-2105-10-421 · Cited by 22,074
An obesity-associated gut microbiome with increased capacity for energy harvest
Turnbaugh, P. J., Ley, R. E., Mahowald, M. A., Magrini, V., Mardis, E. R., & Gordon, J. I. (2006) · Nature · doi:10.1038/nature05414 · Cited by 12,444
Fast and accurate long-read alignment with Burrows-Wheeler transform.
Li, H., & Durbin, R. (2010) · Bioinformatics · doi:10.1093/bioinformatics/btp698 · Cited by 12,063
A human gut microbial gene catalogue established by metagenomic sequencing
MetaHIT Consortium, Qin, J., Li, R., Raes, J., Arumugam, M., Burgdorf, K. S., Manichanh, C., Nielsen, T., Pons, N., Levenez, F., et al. (2010) · Nature · doi:10.1038/nature08821 · Cited by 11,624
Self-citationCd-hit: Accelerated for clustering the next-generation sequencing data
Fu, L., Niu, B., Zhu, Z., Wu, S., & Li, W. (2012) · Bioinformatics · doi:10.1093/bioinformatics/bts565 · Cited by 11,175
Human gut microbes associated with obesity
Ley, R. E., Turnbaugh, P. J., Klein, S., & Gordon, J. I. (2006) · Nature · doi:10.1038/4441022a · Cited by 8,785
Enterotypes of the human gut microbiome
MetaHIT Consortium (additional members), Arumugam, M., Raes, J., Pelletier, E., Le Paslier, D., Yamada, T., Mende, D. R., Fernandes, G. R., Tap, J., Bruls, T., et al. (2011) · Nature · doi:10.1038/nature09944 · Cited by 7,548
Self-citationTurnbaugh, P. J., Ley, R. E., Hamady, M., Fraser-Liggett, C. M., Knight, R., & Gordon, J. I. (2007) · Nature · doi:10.1038/nature06244 · Cited by 6,091
Richness of human gut microbiome correlates with metabolic markers
Le Chatelier, E., Nielsen, T., Qin, J., Prifti, E., Hildebrand, F., Falony, G., Almeida, M., Arumugam, M., Batto, J.-M., Kennedy, S., et al. (2013) · Nature · doi:10.1038/nature12506 · Cited by 4,662
Self-citation
Cited by
Sorted by citations
Items 101–200 of 277
The Hoops, Hopes, and Hypes of Human Microbiome Research.
Bik, E. M. (2016) · PubMed Central · Cited by 43
Maillet, A., Bouju-Albert, A., Roblin, S., Vaissié, P., Leuillet, S., Dousset, X., Jaffrès, E., Combrisson, J., & Prévost, H. (2020) · Food Microbiology · doi:10.1016/j.fm.2020.103705 · Cited by 46
Meta-omics in Inflammatory Bowel Disease Research: Applications, Challenges, and Guidelines
Valles‐Colomer, M., Darzi, Y., Vieira‐Silva, S., Falony, G., Raes, J., & Joossens, M. (2016) · Journal of Crohn s and Colitis · doi:10.1093/ecco-jcc/jjw024 · Cited by 46
Pre-analytical Practices in the Molecular Diagnostic Tests, A Concise Review
Anvari, M. S., Gharib, A., Abolhasani, M., Azari-Yam, A., Gharalari, F. H., Safavi, M., Zare‐Mirzaie, A., & Vasei, M. (2020) · Iranian journal of pathology · doi:10.30699/ijp.2020.124315.2357 · Cited by 43
DNA extraction method influences human milk bacterial profiles
Cheema, A. S., Stinson, L. F., Lai, C. T., Geddes, D. T., & Payne, M. (2020) · Journal of Applied Microbiology · doi:10.1111/jam.14780 · Cited by 42
Assessment of gut microbiota populations in lean and obese Zucker rats
Hakkak, R., Korourian, S., Foley, S. L., & Erickson, B. D. (2017) · PLoS ONE · doi:10.1371/journal.pone.0181451 · Cited by 37
Comparative evaluation of soil DNA extraction kits for long read metagenomic sequencing
Child, H. T., Wierzbicki, L., Joslin, G. R., & Tennant, R. (2024) · Access Microbiology · doi:10.1099/acmi.0.000868.v3 · Cited by 40
Lim, N. Y. N., Roco, C. A., & Frostegård, Å. (2016) · Frontiers in Microbiology · doi:10.3389/fmicb.2016.01588 · Cited by 36
Ezzy, A. C., Hagstrom, A. D., George, C. S., Hamlin, A. S., Pereg, L. L., Murphy, A. J., & Winter, G. (2019) · Journal of Microbiological Methods · doi:10.1016/j.mimet.2019.105668 · Cited by 36
Developing whole cell standards for the microbiome field
Sergaki, C., Anwar, S., Fritzsche, M., Mate, R., Francis, R. J., MacLellan‐Gibson, K., Logan, A., & Amos, G. C. A. (2022) · Microbiome · doi:10.1186/s40168-022-01313-z · Cited by 36
Symbiosis and Dysbiosis of the Human Mycobiome
Mishra, K., Bukavina, L., & Ghannoum, M. A. (2021) · Frontiers in Microbiology · doi:10.3389/fmicb.2021.636131 · Cited by 34
Absolute quantification of prokaryotes in the microbiome by 16S rRNA qPCR or ddPCR
Doyle, B., Reynolds, G. Z. M., Dvorak, M., Maghini, D. G., Natarajan, A., & Bhatt, A. S. (2025) · Nature Protocols · doi:10.1038/s41596-025-01165-5 · Cited by 32
Walker, A. W. (2016) · Advances in experimental medicine and biology · doi:10.1007/978-3-319-31248-4_2 · Cited by 32
Comparison of five assays for DNA extraction from bacterial cells in human faecal samples
Gryp, T., Glorieux, G., Joossens, M., & Vaneechoutte, M. (2020) · Journal of Applied Microbiology · doi:10.1111/jam.14608 · Cited by 31
The Influence of DNA Extraction and Lipid Removal on Human Milk Bacterial Profiles
Okunola, A. O., Claassen-Weitz, S., Mwaikono, K. S., Gardner‐Lubbe, S., Zar, H. J., Nicol, M. P., & du Toit, E. (2020) · Methods and Protocols · doi:10.3390/mps3020039 · Cited by 35
Watanabe, S., Kameoka, S., Shinozaki, N. O., Ryuichi, K. U. B. O., Nishida, A., Kuriyama, M., & Takeda, A. (2021) · Bioscience of Microbiota Food and Health · doi:10.12938/bmfh.2020-038 · Cited by 37
Panteli, N., Mastoraki, M., Nikouli, E., Lazarina, M., Antonopoulou, E., & Kormas, K. A. (2020) · Comparative Biochemistry and Physiology Part D Genomics and Proteomics · doi:10.1016/j.cbd.2020.100738 · Cited by 30
ddPCR allows 16S rRNA gene amplicon sequencing of very small DNA amounts from low-biomass samples
Abellan-Schneyder, I., Schusser, A. J., & Neuhaus, K. (2021) · BMC Microbiology · doi:10.1186/s12866-021-02391-z · Cited by 34
Challenges for case-control studies with microbiome data
Brooks, J. P. (2016) · Annals of Epidemiology · doi:10.1016/j.annepidem.2016.03.009 · Cited by 30
Birer-Williams, C. M. C., Tysklind, N., Zinger, L., & Duplais, C. (2017) · Molecular Ecology Resources · doi:10.1111/1755-0998.12688 · Cited by 34
Stojan, I., Trumbić, Ž., Pleić, I. L., & Šantić, D. (2023) · Frontiers in Microbiology · doi:10.3389/fmicb.2023.1151907 · Cited by 28
Sohrabi, M., NAIR, R. G., Samaranayake, L. P., Zhang, L., Zulfiker, A. H. M., Ahmetagic, A., Good, D. M., & Wei, M. Q. (2016) · Journal of Microbiological Methods · doi:10.1016/j.mimet.2016.01.013 · Cited by 27
McGaughey, K. D., Yilmaz-Swenson, T., Elsayed, N. M., Cruz, D. A., Rodriguez, R., Kritzer, M. D., Peterchev, A. V., Gray, M., Lewis, S. R., Roach, J. M., et al. (2018) · PLoS ONE · doi:10.1371/journal.pone.0202858 · Cited by 27
The impact of storage conditions on human stool 16S rRNA microbiome composition and diversity
Carruthers, L. V., Arinaitwe, M., Adriko, M., Faust, C. L., Tukahebwa, E. M., Hall, L. J., Ranford-Cartwright, L. C., & Lamberton, P. H. L. (2019) · PeerJ · doi:10.7717/peerj.8133 · Cited by 27
Amplicon sequencing of bacterial microbiota in abortion material from cattle
Vidal, S., Kegler, K., Posthaus, H., Perreten, V., & Rodríguez, S. (2017) · Veterinary Research · doi:10.1186/s13567-017-0470-1 · Cited by 26
Xu, Z., Yeoh, Y. K., Tun, H. M., Fei, N., Zhang, J., Morrison, M., Kamm, M. A., Yu, J., Chan, F. K. L., & Ng, S. C. (2024) · Microbiology Spectrum · doi:10.1128/spectrum.01516-24 · Cited by 26
Performance evaluation of multiplex PCR including Aspergillus—not so simple!: Table 1.
Alanio, A., & Bretagne, S. (2016) · Medical Mycology · doi:10.1093/mmy/myw080 · Cited by 26
Wegl, G., Grabner, N., Köstelbauer, A., Klose, V., & Ghanbari, M. (2021) · Frontiers in Microbiology · doi:10.3389/fmicb.2021.627539 · Cited by 24
Method Validation for Extraction of DNA from Human Stool Samples for Downstream Microbiome Analysis
Neuberger-Castillo, L., Hamot, G., Marchese, M., Sanchez, I., Ammerlaan, W., & Betsou, F. (2020) · Biopreservation and Biobanking · doi:10.1089/bio.2019.0112 · Cited by 24
Austin, G. I., Kav, A. B., ElNaggar, S., Park, H., Biermann, J., Uhlemann, A., Pe’er, I., & Korem, T. (2025) · Nature Microbiology · doi:10.1038/s41564-025-01954-4 · Cited by 24
Gan, H. M., Szegedi, E., Fersi, R., Chebil, S., Kovács, L., Kawaguchi, A., Hudson, A. O., Bürr, T. J., & Savka, M. A. (2019) · Frontiers in Microbiology · doi:10.3389/fmicb.2019.01896 · Cited by 26
Aizpurua, O., Dunn, R. R., Hansen, L. H., Gilbert, M. T. P., & Alberdi, A. (2023) · Critical Reviews in Biotechnology · doi:10.1080/07388551.2023.2254933 · Cited by 23
Metagenomic and clinical microbiology
Amrane, S., & Lagier, J. (2018) · Human Microbiome Journal · doi:10.1016/j.humic.2018.06.001 · Cited by 28
Diet–Gut Microbiota Relations: Critical Appraisal of Evidence From Studies Using Metagenomics
Lotankar, M., Houttu, N., Mokkala, K., & Laitinen, K. (2024) · Nutrition Reviews · doi:10.1093/nutrit/nuae192 · Cited by 25
Impact of DNA Extraction Methods on Gut Microbiome Profiles: A Comparative Metagenomic Study
Pu, Y., Zhou, X., Cai, H., Lou, T., Liu, C., Kong, M., Sun, Z., Wang, Y.-R., Zhang, R., Zhu, Y., et al. (2025) · Phenomics · doi:10.1007/s43657-025-00232-x · Cited by 25
Procházková, N., Venlet, N. V., Hansen, M. L., Lieberoth, C. B., Dragsted, L. O., Bahl, M. I., Licht, T. R., Kleerebezem, M., Lauritzen, L., & Roager, H. M. (2023) · Frontiers in Nutrition · doi:10.3389/fnut.2023.1187165 · Cited by 26
Self-citationImpact of milk secretor status on the fecal metabolome and microbiota of breastfed infants
Wang, A., Diana, A., Rahmannia, S., Gibson, R. S., Houghton, L. A., & Slupsky, C. M. (2023) · Gut Microbes · doi:10.1080/19490976.2023.2257273 · Cited by 22
Hong, B., Driscoll, M. D., Gratalo, D., Jarvie, T. P., & Weinstock, G. M. (2024) · International Journal of Molecular Sciences · doi:10.3390/ijms25052966 · Cited by 22
Gut microbiota and tuberculosis infection: interaction and therapeutic potential
Chai, Y., Li, M., Deng, X., Ma, C., Zhou, N., Chen, Y., Yao, Y., Li, K. C., Gong, W., & Lei, H. (2025) · Gut Microbes · doi:10.1080/19490976.2025.2531201 · Cited by 25
Woloszynek, S., Pastor, S. J., Mell, J. C., Nandi, N., Sokhansanj, B. A., & ROSEN, G. L. (2016) · International review of cytology · doi:10.1016/bs.ircmb.2016.01.003 · Cited by 20
Combining metagenomics and metatranscriptomics to study human, animal and environmental resistomes
Wang, Y., Hu, Y., & Gao, G. F. (2020) · Medicine in Microecology · doi:10.1016/j.medmic.2020.100014 · Cited by 20
Cross-comparison of gut metagenomic profiling strategies
Gulyás, G. M., Kakuk, B., Dörmő, Á., Járay, T., Prazsák, I., Csabai, Z., Henkrich, M. M., Boldogkői, Z., & Tombácz, D. (2024) · Communications Biology · doi:10.1038/s42003-024-07158-6 · Cited by 21
The implementation of omics technologies in cancer microbiome research
Mullish, B. H., Osborne, L. S., Marchesi, J. R., & McDonald, J. A. K. (2018) · ecancermedicalscience · doi:10.3332/ecancer.2018.864 · Cited by 18
Standardization of gut microbiome analysis in sports
Mancin, L., Paoli, A., Berry, S., Gonzalez, J. T., Collins, A. J., Lizarraga, M. A., Mota, J. F., Nicola, S., & Rollo, I. (2024) · Cell Reports Medicine · doi:10.1016/j.xcrm.2024.101759 · Cited by 22
From Culture to High-Throughput Sequencing and Beyond
O’Toole, P. W., & Flemer, B. (2017) · Gastroenterology Clinics of North America · doi:10.1016/j.gtc.2016.09.003 · Cited by 18
Getting to Know the Gut Microbial Diversity of Metropolitan Buenos Aires Inhabitants
Belforte, F. S., Fernandez, N., Monzón, F. T., Rosso, A. D., Quesada, S., Cimolai, M. C., Millán, A. L., Cerrone, G. E., Frechtel, G. D., Burcelin, R., et al. (2019) · Frontiers in Microbiology · doi:10.3389/fmicb.2019.00965 · Cited by 17
Mallott, E. K., Malhi, R. S., & Amato, K. R. (2019) · Access Microbiology · doi:10.1099/acmi.0.000060 · Cited by 17
Automated nucleic acids purification from fecal samples on a microfluidic cartridge
Kang, J.-S., Park, C., Lee, J., Namkung, J., Hwang, S. Y., & Kim, Y. S. (2017) · BioChip Journal · doi:10.1007/s13206-016-1205-5 · Cited by 17
Yildirimer, C., & Brown, K. H. (2018) · Journal of Applied Microbiology · doi:10.1111/jam.14059 · Cited by 17
Samples and techniques highlighting the links between obesity and microbiota
Angelakis, E., & Lagier, J. (2016) · Microbial Pathogenesis · doi:10.1016/j.micpath.2016.01.024 · Cited by 16
Alili, R., Belda, E., Le, P. T., Wirth, T., Zucker, J., Prifti, E., & Clément, K. (2021) · Genes · doi:10.3390/genes12101496 · Cited by 19
Christoff, A. P., Cruz, G. N. F., Sereia, A. F. R., EikoYamanaka, L., Silveira, P. P., & de Oliveira, L. F. V. (2019) · bioRxiv (Cold Spring Harbor Laboratory) · doi:10.1101/646349 · Cited by 16
Nour, I., Hanif, A., Alanazi, F., Zakri, A. M., Al-Ashkar, I. M., Alhetheel, A., & Eifan, S. A. (2021) · Journal of Virological Methods · doi:10.1016/j.jviromet.2021.114212 · Cited by 15
Lewis, Z. T., Davis, J. C. C., Smilowitz, J. T., German, J. B., Lebrilla, C. B., & Mills, D. A. (2016) · PeerJ · doi:10.7717/peerj.1612 · Cited by 15
Surveillance of Foodborne Pathogens: Towards Diagnostic Metagenomics of Fecal Samples
Andersen, S. C., & Hoorfar, J. (2018) · Genes · doi:10.3390/genes9010014 · Cited by 15
Shi, Z., Kong, Q., Li, X., Xu, W., Mao, C., Wang, Y., SONG, W. B., & Huang, J. (2022) · Microorganisms · doi:10.3390/microorganisms10061213 · Cited by 15
Statistical Data Analysis of Microbiomes and Metabolomics
Xia, Y., & Sun, J. (2021) · ACS in focus · doi:10.1021/acsinfocus.7e5035 · Cited by 15
Szamosi, J. C., Forbes, J. D., Copeland, J. K., Knox, N., Shekarriz, S., Rossi, L., Graham, M., Bonner, C., Guttman, D. S., Domselaar, G. V., et al. (2020) · Frontiers in Microbiology · doi:10.3389/fmicb.2020.02028 · Cited by 14
Schots, P. C., Jansen, K. M., Mrázek, J., Pedersen, A. M., Olsen, R. L., & Larsen, T. S. (2020) · Nutrition Research · doi:10.1016/j.nutres.2020.09.002 · Cited by 15
Carrera-Quintanar, L., Ortuño‐Sahagún, D., Franco‐Arroyo, N. N., Paredes, J. M. V., Zepeda‐Morales, A. S. M., & López-Roa, R. I. (2018) · International Journal of Molecular Sciences · doi:10.3390/ijms19123827 · Cited by 14
Evans, J. S., López‐Legentil, S., & Erwin, P. M. (2018) · Microbes and Environments · doi:10.1264/jsme2.me18031 · Cited by 14
The Multiomics Analyses of Fecal Matrix and Its Significance to Coeliac Disease Gut Profiling
Gangadoo, S., Rajapaksha, P., Cheeseman, S., Dang, Y., Elbourne, A. J., Cozzolino, D., Latham, K., Truong, V. K., & Chapman, J. (2021) · International Journal of Molecular Sciences · doi:10.3390/ijms22041965 · Cited by 14
Deutsch, L., & Stres, B. (2021) · Metabolites · doi:10.3390/metabo11030172 · Cited by 13
Evaluation of DNA Extraction Methods for Microbial Community Profiling in Deadwood Decomposition
Zhang, Y., Song, Z., & Schilling, J. S. (2024) · MicrobiologyOpen · doi:10.1002/mbo3.70007 · Cited by 12
Gene-Based Pathogen Detection: Can We Use qPCR to Predict the Outcome of Diagnostic Metagenomics?
Andersen, S. C., Fachmann, M. S. R., Kiil, K., Nielsen, E. M., & Hoorfar, J. (2017) · Genes · doi:10.3390/genes8110332 · Cited by 12
Cremonesi, P., Severgnini, M., Romano, A. A., Sala, L., Luini, M. V., & Castiglioni, B. (2021) · Microbiology Spectrum · doi:10.1128/spectrum.00374-21 · Cited by 12
Antosca, K. M., Hoen, A., Palys, T., Hilliard, M. A., Morrison, H., Coker, M., Madan, J. C., & Karagas, M. (2020) · MicrobiologyOpen · doi:10.1002/mbo3.1018 · Cited by 10
Tunsakul, N., Wongsaroj, L., Janchot, K., Pongpirul, K., & Somboonna, N. (2024) · PeerJ · doi:10.7717/peerj.17270 · Cited by 11
Văcărean-Trandafir, I.-C., Amărandi, R.-M., Ivanov, I. C., Dragos, L. M., Mențel, M., Iacob, Ș., Mușină, A.-M., Bărgăoanu, E.-R., Roată, C. E., Morărașu, Ș., et al. (2025) · Frontiers in Cellular and Infection Microbiology · doi:10.3389/fcimb.2024.1468645 · Cited by 13
Pankoke, H., Maus, I., Loh, G., Hüser, A. T., Seifert, J., Tilker, A., Hark, S., Sczyrba, A., Pelzer, S., & Kleinbölting, J. (2019) · FEMS Microbiology Letters · doi:10.1093/femsle/fnz033 · Cited by 11
Gutiérrez-Pérez, E. D., Vázquez‐Juárez, R., Magallón‐Barajas, F. J., Martínez, M. Á., Escobar‐Zepeda, A., & Magallón‐Servín, P. (2022) · Frontiers in Marine Science · doi:10.3389/fmars.2022.975042 · Cited by 12
Ness, T. E., Meiwes, L., Kay, A. W., Mejía, R., Lange, C. G., Farhat, M. R., Mandalakas, A. M., & DiNardo, A. R. (2022) · Microbiology Spectrum · doi:10.1128/spectrum.02269-22 · Cited by 11
Evaluating DNA Extraction Methods for Community Profiling of Pig Hindgut Microbial Community
Lü, Y., Hugenholtz, P., & Batstone, D. J. (2015) · PLoS ONE · doi:10.1371/journal.pone.0142720 · Cited by 13
Microbial Colonization in Adulthood Shapes the Intestinal Macrophage Compartment
Schmidt, F., Dahlke, K., Batra, A., Keye, J., Wu, H., Friedrich, M., Glauben, R., Ring, C., Loh, G., Schaubeck, M., et al. (2019) · Journal of Crohn s and Colitis · doi:10.1093/ecco-jcc/jjz036 · Cited by 12
Microbiome measurement: Possibilities and pitfalls
Radjabzadeh, D., Uitterlinden, A. G., & Kraaij, R. (2017) · Best Practice & Research Clinical Gastroenterology · doi:10.1016/j.bpg.2017.10.008 · Cited by 10
Widjaja, F., & Rietjens, I. M. C. M. (2023) · Biomedicines · doi:10.3390/biomedicines11102658 · Cited by 12
Analysis of the Pulmonary Microbiome Composition of Legionella pneumophila-Infected Patients
Pérez‐Cobas, A. E., & Buchrieser, C. (2019) · Methods in molecular biology · doi:10.1007/978-1-4939-9048-1_27 · Cited by 10
Baek, C., Kim, W. J., Moon, J., Moon, S. Y., Kim, W., Hu, H., & Min, J. (2022) · PLoS ONE · doi:10.1371/journal.pone.0264291 · Cited by 9
A Brief History of Microbial Study and Techniques for Exploring the Gastrointestinal Microbiome
Sidebottom, A. M. (2023) · Clinics in Colon and Rectal Surgery · doi:10.1055/s-0042-1760678 · Cited by 10
Fujiyoshi, S., Yarimizu, K., Perera, I. U., Abanto, M., Jorquera, M. A., & Maruyama, F. (2023) · Current Opinion in Biotechnology · doi:10.1016/j.copbio.2023.102897 · Cited by 9
Tyler, A. D., McAllister, J., Stapleton, H. L., Gauci, P., Antonation, K. S., Thirkettle‐Watts, D., & Corbett, C. R. (2023) · PLoS ONE · doi:10.1371/journal.pone.0295028 · Cited by 9
Ruiz-Moreno, H. A., López-Tamayo, A. M., Caro‐Quintero, A., Husserl, J., & Barrios, A. F. G. (2019) · Ecological Modelling · doi:10.1016/j.ecolmodel.2019.02.001 · Cited by 10
Methods for exploring the faecal microbiome of premature infants: a review
Westaway, J. A. F., Huerlimann, R., Miller, C., Kandasamy, Y., Norton, R. E., & Rudd, D. (2021) · Maternal Health Neonatology and Perinatology · doi:10.1186/s40748-021-00131-9 · Cited by 11
Shao, L., Liao, J., Qian, J., Chen, W., & Fan, X. (2021) · BMC Microbiology · doi:10.1186/s12866-021-02321-z · Cited by 9
Skim-Nanopore sequencing for routine genomic evaluation and bacterial pathogen detection in cattle
Lamb, H. J., Nguyen, L. T., Briody, T. E., Ambrose, R. K., Hayes, B. J., Mahony, T. J., & Ross, E. M. (2023) · Animal Production Science · doi:10.1071/an22451 · Cited by 9
Sanyang, B., de Silva, T. I., Camara, B., Beloum, N., Kanteh, A., Manneh, J., Piters, W. A. A. D. S., Bogaert, D., Sesay, A. K., & Roca, A. (2024) · iScience · doi:10.1016/j.isci.2024.110626 · Cited by 8
Examining Different Analysis Protocols Targeting Hospital Sanitary Facility Microbiomes
Neidhöfer, C., Sib, E., Benhsain, A.-H., Mutschnik, C., Schwabe, A., Wollkopf, A. D., Wetzig, N., Sieber, M. A., Thiele, R., Döhla, M., et al. (2023) · Microorganisms · doi:10.3390/microorganisms11010185 · Cited by 8
Terrestrial Fauna and Hominin DNA from Sedimentary Archives
Murchie, T. J., Giguet‐Covex, C., Heintzman, P. D., Slon, V., & Wang, Y. (2023) · Developments in paleoenvironmental research · doi:10.1007/978-3-031-43799-1_11 · Cited by 9
Kumbhare, S. V., Patangia, D. V., Mongad, D., Bora, A., Bavdekar, A., & Shouche, Y. S. (2020) · FEMS Microbiology Letters · doi:10.1093/femsle/fnaa022 · Cited by 8
Effects of biocides and metals on antibiotic resistance: a genomic and metagenomic perspective
Pal, C. (2017) · Gothenburg University Publications Electronic Archive (Gothenburg University) · doi:10.13140/rg.2.2.27592.72967 · Cited by 7
Reproducibility: The Search for Microbiome Standards
Martin, J. (2019) · BioTechniques · doi:10.2144/btn-2019-0096 · Cited by 9
Precision run-on sequencing (PRO-seq) for microbiome transcriptomics
Vill, A. C., Rice, E. J., Vlaminck, I. D., Danko, C. G., & Brito, I. (2024) · Nature Microbiology · doi:10.1038/s41564-023-01558-w · Cited by 7
Sene, G., Obieze, C. C., Ezeokoli, O. T., Boyle, B., Quoreshi, A. M., & Khasa, D. P. (2025) · Fungal ecology · doi:10.1016/j.funeco.2025.101425 · Cited by 7
Akpulu, C., Lankapalli, A. K., Toufiq, R., Cook, K., Portal, E. A. R., Khalid, R. Y., Mukaddas, A. S., Gambo, S., Aminu, A., Iregbu, K. C., et al. (2025) · The Microbe · doi:10.1016/j.microb.2025.100398 · Cited by 7
Aphale, D., & Kulkarni, A. (2018) · Veterinary World · doi:10.14202/vetworld.2018.990-1000 · Cited by 7
AlKhater, S. A. (2020) · Journal of Asthma and Allergy · doi:10.2147/jaa.s272705 · Cited by 8
An introduction to metagenomic data generation, analysis, visualization, and interpretation
Singh, B., Crippen, T. L., & Tomberlin, J. K. (2017) · Wiley eBooks · doi:10.1002/9781119062585.ch5 · Cited by 8
Luise, D., Carta, S., Cremonesi, P., Marino, R., & Castiglioni, B. (2025) · Italian Journal of Animal Science · doi:10.1080/1828051x.2025.2486396 · Cited by 6
Song, X., Zhai, Y., Song, J., Zhang, J., & Li, X. (2023) · Folia Microbiologica · doi:10.1007/s12223-023-01031-5 · Cited by 5
Lemaitre, J. C., Popelka, D., Ribotta, B., Westlake, H. E., Chakrabarti, S., Li, X., Hanson, M. A., Jiang, H., Cara, F. D., Kurant, E., et al. (2025) · bioRxiv (Cold Spring Harbor Laboratory) · doi:10.1101/2025.07.07.663460 · Cited by 5
Metadata
- Authors
- Wesolowska-Andersen, A., Bahl, M. I., Carvalho, V., Kristiansen, K., Sicheritz-Pontén, T., Gupta, R., & Licht, T. R.
- Affiliations
- Technical University of Denmark (DK)
- University of Copenhagen (DK)
- Corresponding author
- Gupta, Ramneek
- Licht, Tine Rask
- Venue
- Microbiome
- Published
- 2014-06-05
- Volume
- 2
- Issue
- 1
- Pages
- 19-19
- ISSN
- 2049-2618 (ISSN-L)
- PMC
- PMC4063427
- OpenAlex
- W2161919313
- Cited by
- 277
- References
- 28
- Citations by year
- 2026: 19 · 2025: 19 · 2024: 15 · 2023: 19 · 2022: 17 · 2021: 31 · 2020: 26 · 2019: 23 · 2018: 29 · 2017: 32 · 2016: 30 · 2015: 15 · 2014: 1
- FWCI
- 10.65
- Type
- journal article
- Language
- en
- Open access
- gold
- doi.org
- Licence
- cc-by
- Locations
- Microbiome (publishedVersion, cc-by)
- Europe PMC (PubMed Central) (publishedVersion, cc-by)
- PubMed Central (publishedVersion, cc-by)
- PubMed (publishedVersion)
- Technical University of Denmark, DTU Orbit (Technical University of Denmark, DTU) (submittedVersion, other-oa)
- Funders
- Strategic Research Council
- Topics
- Life Sciences › Biochemistry, Genetics and Molecular Biology › Molecular Biology › Gut microbiota and health
- Life Sciences › Biochemistry, Genetics and Molecular Biology › Molecular Biology › Genomics and Phylogenetic Studies
- Physical Sciences › Environmental Science › Ecology › Microbial Community Ecology and Physiology
- Keywords
- bacterial DNA extraction, fecal microbiota, human gut microbiome, extraction method comparison, sample homogenization, Bacteroidetes, bacterial community structure, inter-study comparability
About these checks
Registry, retraction, Cites and statistics results are computed, not judged, with one exception: a printed reference that no index lists is read once by a model before it counts as a citation error. Claims are extracted by a model and kept only when their quote appears verbatim in the text; each cited source is then checked, with a model’s help, for whether it says what the claim relies on. Those verdicts can be wrong — read the claim’s quote and the cited source before relying on one.
Statistics and arithmetic are recomputed, not judged.
Confidence bands are shown only for fields calibrated on our annotated test set. None is calibrated yet, so no band is shown.
What counts as a claim ›How we measure confidence ›How we check this ›
Are you an author, or do you see a problem with this page? Request a review
