

The DOI matches its Crossref record; 56 of the 58 references it cites were found in a registry or an index.
Genome-wide prediction of transcription factor binding sites using an integrated model
Open accessAbstract
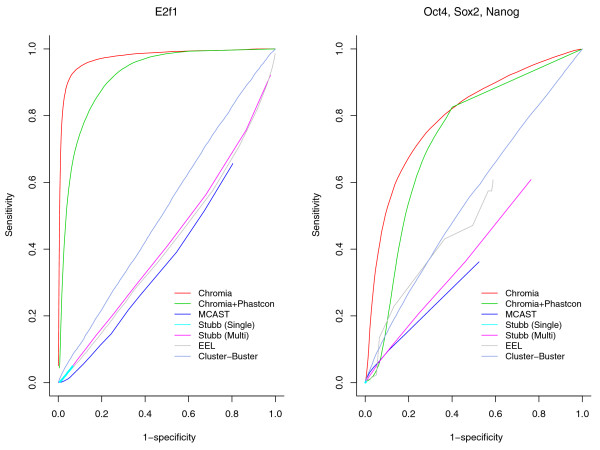
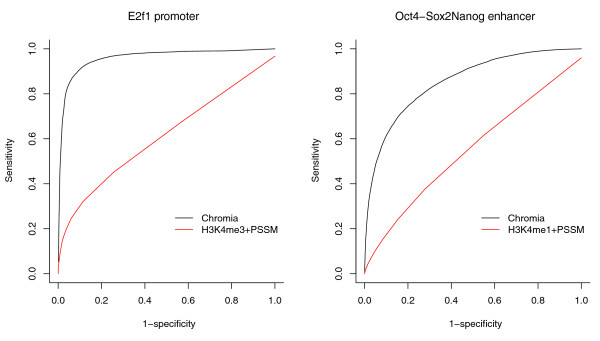
We present an integrated method called Chromia for the genome-wide identification of functional target loci of transcription factors. Designed to capture the characteristic patterns of transcription factor binding motif occurrences and the histone profiles associated with regulatory elements such as promoters and enhancers, Chromia significantly outperforms other methods in the identification of 13 transcription factor binding sites in mouse embryonic stem cells, evaluated by both binding (ChIP-seq) and functional (RNA interference knockdown) experiments.
Overview
The claims and statistics of this paper haven’t been checked yet.
Run the check — free, no account needed. It reads the open-access text and checks the sources it cites.
Integrity signals
Registry
Cites
Statistics
Figures
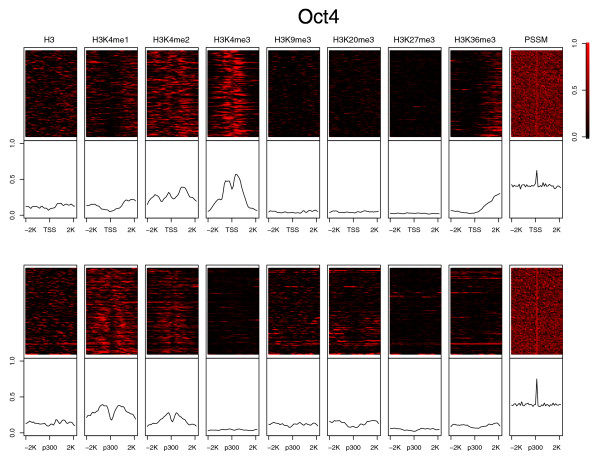
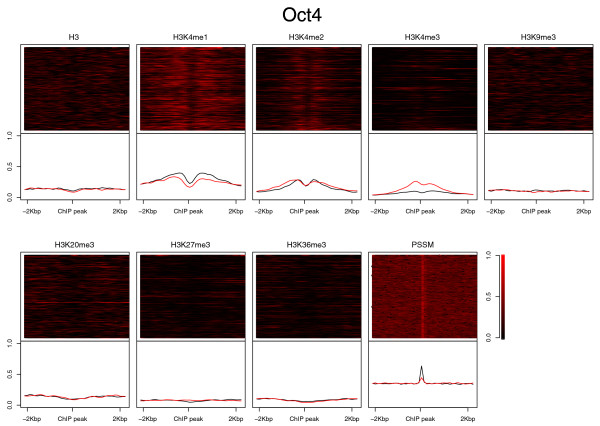
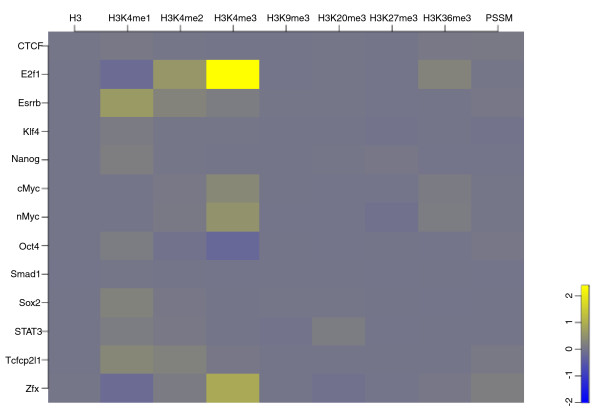
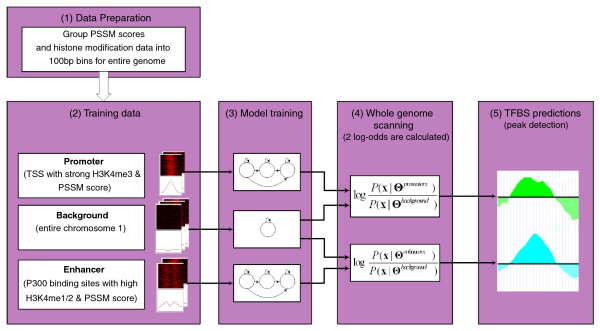
Verification
Claims the paper makes
The claims and statistics of this paper haven’t been checked yet.
Run the check — free, no account needed. It reads the open-access text and checks the sources it cites.
Claims other papers make about this one
Each is checked against this paper’s own text: does it say what the citing paper says it does?
The check wasn’t confident either way, so it gives no verdict — never disputed.
In the citing paper
“Prior work has shown that there is minimal variation in performance between chromosomes on this problem (Won et al., 2010; Alipanahi et al., 2015; Keilwagen et al., 2019), so we can approximate these training and test distributions as identical.”
From WILDS: A Benchmark of in-the-Wild Distribution Shifts (2020) · cites this paper as Won et al., 2010
Experimental — accuracy not yet measured
Self-check
Percentages, sums and reported differences re-computed from the paper’s own numbers.
The self-check needs the paper’s full text.
Citations
Cites
A tutorial on hidden Markov models and selected applications in speech recognition
Rabiner, L. R. (1989) · Proceedings of the IEEE · doi:10.1109/5.18626 · Cited by 22,743
The Human Genome Browser at UCSC
Kent, W. J., Sugnet, C. W., Furey, T. S., Roskin, K. M., Pringle, T. H., Zahler, A. M., & Haussler, A. D. (2002) · Genome Research · doi:10.1101/gr.229102 · Cited by 10,400
High-Resolution Profiling of Histone Methylations in the Human Genome
Barski, A., Cuddapah, S., Cui, K., Roh, T.-Y., Schones, D. E., Wang, Z., Wei, G., Chepelev, I., & Zhao, K. (2007) · Cell · doi:10.1016/j.cell.2007.05.009 · Cited by 6,845
Fitting a mixture model by expectation maximization to discover motifs in biopolymers.
Bailey, T. L., & Elkan, C. (1994) · PubMed · Cited by 4,982
Core Transcriptional Regulatory Circuitry in Human Embryonic Stem Cells
Boyer, L. A., Lee, T. I., Cole, M. F., Johnstone, S. E., Levine, S. S., Zucker, J. P., Guenther, M. G., Kumar, R. M., Murray, H. L., Jenner, R. G., et al. (2005) · Cell · doi:10.1016/j.cell.2005.08.020 · Cited by 4,505
Genome-wide maps of chromatin state in pluripotent and lineage-committed cells
Mikkelsen, T. S., Ku, M., Jaffe, D. B., Issac, B., Lieberman, E., Giannoukos, G., Alvarez, P., Brockman, W., Kim, T.-K., Koche, R. P., et al. (2007) · Nature · doi:10.1038/nature06008 · Cited by 4,129
Evolutionarily conserved elements in vertebrate, insect, worm, and yeast genomes
Siepel, A., Bejerano, G., Pedersen, J. S., Hinrichs, A. S., Hou, M., Rosenbloom, K., Clawson, H., Spieth, J., Hillier, L. W., Richards, S., et al. (2005) · Genome Research · doi:10.1101/gr.3715005 · Cited by 3,971 · cited 4×
“example, to calculating the conservation score in phyloHMM [38].”
BackgroundMethodInfluentialHeintzman, N. D., Stuart, R. K., Hon, G., Fu, Y., Ching, C. W., Hawkins, R. D., Barrera, L. O., Van Calcar, S., Qu, C., Ching, K. A., et al. (2007) · Nature Genetics · doi:10.1038/ng1966 · Cited by 3,398
Self-citationMEME: discovering and analyzing DNA and protein sequence motifs
Bailey, T. L., Williams, N., Misleh, C., & Li, W. W. (2006) · Nucleic Acids Research · doi:10.1093/nar/gkl198 · Cited by 2,671
Chen, X., Han, X., Yuan, P., Fang, F., Huss, M., Vega, V. B., Wong, E., Orlov, Y. L., Zhang, W., Jiang, J., et al. (2008) · Cell · doi:10.1016/j.cell.2008.04.043 · Cited by 2,547
Cited by
Sorted by citations
Pique-Regi, R., Degner, J. F., Pai, A. A., Gaffney, D. J., Gilad, Y., & Pritchard, J. K. (2011) · Genome Research · doi:10.1101/gr.112623.110 · Cited by 521
WILDS: A Benchmark of in-the-Wild Distribution Shifts
Koh, P. W., Sagawa, S., Marklund, H., Xie, S. M., Zhang, M., Balsubramani, A., Hu, W., Yasunaga, M., Phillips, R. L., Gao, I., et al. (2020) · arXiv · doi:10.48550/arxiv.2012.07421 · Cited by 518
Sequence and chromatin determinants of cell-type–specific transcription factor bindingPreprint
Arvey, A. J., Agius, P., Noble, W. S., & Leslie, C. S. (2012) · Genome Research · doi:10.1101/gr.127712.111 · Cited by 222
Li, X.-Y., Thomas, S., Sabo, P. J., Eisen, M. B., Stamatoyannopoulos, J. A., & Biggin, M. D. (2011) · Genome Biology · doi:10.1186/gb-2011-12-4-r34 · Cited by 217
Herrmann, C., de Sande, B. V., Potier, D., & Aerts, S. (2012) · Nucleic Acids Research · doi:10.1093/nar/gks543 · Cited by 211
Moyroud, E., Minguet, E. G., Ott, F., Yant, L. J., Posé, D., Monniaux, M., Blanchet, S., Bastien, O., Thévenon, E., Weigel, D., et al. (2011) · The Plant Cell · doi:10.1105/tpc.111.083329 · Cited by 160
Integrating Diverse Datasets Improves Developmental Enhancer Prediction
Erwin, G. D., Oksenberg, N., Truty, R., Kostka, D., Murphy, K. K., Ahituv, N., Pollard, K. S., & Capra, J. A. (2014) · PLoS Computational Biology · doi:10.1371/journal.pcbi.1003677 · Cited by 156
Kaplan, T., Li, X., Sabo, P. J., Thomas, S., Stamatoyannopoulos, J. A., Biggin, M. D., & Eisen, M. B. (2011) · PLoS Genetics · doi:10.1371/journal.pgen.1001290 · Cited by 166
ChIP-chip versus ChIP-seq: Lessons for experimental design and data analysis
Ho, J. W. K., Bishop, E. P., Karchenko, P. V., Nègre, N., White, K. P., & Park, P. J. (2011) · BMC Genomics · doi:10.1186/1471-2164-12-134 · Cited by 163
LncMAP: Pan-cancer atlas of long noncoding RNA-mediated transcriptional network perturbations
Li, Y., Li, X., Wang, Z., Pan, T., Sahni, N., Jin, X., Wang, G., Li, J., Zheng, X., Zhang, Y., et al. (2017) · Nucleic Acids Research · doi:10.1093/nar/gkx1311 · Cited by 139
Ligand-dependent dynamics of retinoic acid receptor binding during early neurogenesis
Mahony, S., Mazzoni, E. O., McCuine, S., Young, R. A., Wichterle, H., & Gifford, D. K. (2011) · Genome Biology · doi:10.1186/gb-2011-12-1-r2 · Cited by 142
Epigenetic priors for identifying active transcription factor binding sites
Cuéllar-Partida, G., Buske, F. A., McLeay, R. C., Whitington, T., Noble, W. S., & Bailey, T. L. (2011) · Bioinformatics · doi:10.1093/bioinformatics/btr614 · Cited by 122
Schmidt, F., Gasparoni, N., Gasparoni, G., Gianmoena, K., Cadenas, C., Polansky, J. K., Ebert, P., Nordström, K. J. V., Barann, M., Sinha, A. N., et al. (2016) · Nucleic Acids Research · doi:10.1093/nar/gkw1061 · Cited by 118
Supervised enhancer prediction with epigenetic pattern recognition and targeted validation
Sethi, A., Gu, M., Gumusgoz, E., Chan, L., Yan, K.-K., Rozowsky, J., Barozzi, I., Afzal, V., Akiyama, J. A., Plajzer-Frick, I., et al. (2020) · Nature Methods · doi:10.1038/s41592-020-0907-8 · Cited by 109
Campión, J., Milagro, F. I., & Martínez, J. A. (2010) · Progress in molecular biology and translational science · doi:10.1016/b978-0-12-375003-7.00011-x · Cited by 106
Machine learning and genome annotation: a match meant to be?
Yip, K. Y.-L., Cheng, C., & Gerstein, M. (2013) · Genome biology · doi:10.1186/gb-2013-14-5-205 · Cited by 102
Progress and challenges in bioinformatics approaches for enhancer identification
Kleftogiannis, D., Kalnis, P., & Bajić, V. B. (2015) · Briefings in Bioinformatics · doi:10.1093/bib/bbv101 · Cited by 92
Gusmao, E. G., Dieterich, C., Zenke, M., & Costa, I. G. (2014) · Bioinformatics · doi:10.1093/bioinformatics/btu519 · Cited by 84
Deng, X., Xu, M., Yuan, C., Yin, L., Chen, X., Zhou, X., Li, G., Fu, Y., Feghali‐Bostwick, C. A., & Pang, L. (2013) · The International Journal of Biochemistry & Cell Biology · doi:10.1016/j.biocel.2013.04.003 · Cited by 79
Assessing Computational Methods of Cis-Regulatory Module Prediction
Su, J., Teichmann, S. A., & Down, T. A. (2010) · PLoS Computational Biology · doi:10.1371/journal.pcbi.1001020 · Cited by 75
Ramsey, S. A., Knijnenburg, T., Kennedy, K. A., Zak, D. E., Gilchrist, M., Gold, E. S., Johnson, C. D., Lampano, A., Litvak, V., Navarro, G., et al. (2010) · Bioinformatics · doi:10.1093/bioinformatics/btq405 · Cited by 74
Chen, C., Morris, Q., & Mitchell, J. A. (2012) · BMC Genomics · doi:10.1186/1471-2164-13-152 · Cited by 75
Bass, J. I. F., Pons, C., Kozlowski, L., Reece-Hoyes, J. S., Shrestha, S., Holdorf, A. D., Mori, A., Myers, C. L., & Walhout, A. J. M. (2016) · Molecular Systems Biology · doi:10.15252/msb.20167131 · Cited by 67
A pitfall for machine learning methods aiming to predict across cell types
Schreiber, J. M., Singh, R., Bilmes, J. A., & Noble, W. S. (2020) · Genome biology · doi:10.1186/s13059-020-02177-y · Cited by 61
Aerts, S. (2012) · Current topics in developmental biology/Current Topics in Developmental Biology · doi:10.1016/b978-0-12-386499-4.00005-7 · Cited by 62
Cheng, C., Min, R., & Gerstein, M. (2011) · Bioinformatics · doi:10.1093/bioinformatics/btr552 · Cited by 56
Comparative annotation of functional regions in the human genome using epigenomic data
Won, K., Zhang, X., Wang, T., Ding, B., Raha, D., Snyder, M. P., Ren, B., & Wang, W. (2013) · Nucleic Acids Research · doi:10.1093/nar/gkt143 · Cited by 52
Self-citationLu, Y., Qu, W., Shan, G., & Zhang, C. (2015) · PLoS ONE · doi:10.1371/journal.pone.0130622 · Cited by 51
Identifying functional single nucleotide polymorphisms in the human CArGome
Benson, C. C., Zhou, Q., Long, X., & Miano, J. M. (2011) · Physiological Genomics · doi:10.1152/physiolgenomics.00098.2011 · Cited by 47
Base-resolution methylation patterns accurately predict transcription factor bindings in vivo
Xu, T., Li, B., Zhao, M., Szulwach, K. E., Street, R. C., Li, L., Yao, B., Zhang, F., Jin, P., Wu, H., et al. (2015) · Nucleic Acids Research · doi:10.1093/nar/gkv151 · Cited by 47
Zhang, Y., Wang, Z., Zeng, Y., Liu, Y., Xiong, S., Wang, M., Zhou, J., & Zou, Q. (2021) · Briefings in Bioinformatics · doi:10.1093/bib/bbab525 · Cited by 46
Finding Associations among Histone Modifications Using Sparse Partial Correlation Networks
Lasserre, J., Chung, H., & Vingron, M. (2013) · PLoS Computational Biology · doi:10.1371/journal.pcbi.1003168 · Cited by 44
Rye, M. B., Sætrom, P., Håndstad, T., & Drabløs, F. (2011) · BMC Biology · doi:10.1186/1741-7007-9-80 · Cited by 42
Wang, K., Zeng, X., Zhou, J., Liu, F., Luan, X., & Wang, X. (2024) · Briefings in Bioinformatics · doi:10.1093/bib/bbae195 · Cited by 35
Blatti, C. A., Kazemian, M., Wolfe, S. A., Brodsky, M., & Sinha, S. (2015) · Nucleic Acids Research · doi:10.1093/nar/gkv195 · Cited by 36
A neural network based model effectively predicts enhancers from clinical ATAC-seq samples
Thibodeau, A., Uyar, A., Khetan, S., Stitzel, M. L., & Ucar, D. (2018) · Scientific Reports · doi:10.1038/s41598-018-34420-9 · Cited by 31
Complex impact of DNA methylation on transcriptional dysregulation across 22 human cancer types
Wang, Z., Yin, J., Zhou, W., Bai, J., Xie, Y., Xu, K., Zheng, X., Xiao, J. Y., Zhou, L., Qi, X., et al. (2020) · Nucleic Acids Research · doi:10.1093/nar/gkaa041 · Cited by 32
Rye, M. B., Sandve, G. K., Daub, C. O., Kawaji, H., Carninci, P., Forrest, A. R. R., & Drabløs, F. (2014) · BMC Genomics · doi:10.1186/1471-2164-15-120 · Cited by 31
Predicting tissue specific transcription factor binding sites
Zhong, S., He, X., & Bar‐Joseph, Z. (2013) · BMC Genomics · doi:10.1186/1471-2164-14-796 · Cited by 30
Naval-Sánchez, M., Potier, D., Haagen, L., Sánchez, M., Munck, S., de Sande, B. V., Casares, F., Christiaens, V., & Aerts, S. (2012) · Genome Research · doi:10.1101/gr.140426.112 · Cited by 31
Klepper, K., & Drabløs, F. (2013) · BMC Bioinformatics · doi:10.1186/1471-2105-14-9 · Cited by 30
MTTFsite: cross-cell type TF binding site prediction by using multi-task learning
Zhou, J., Lu, Q., Gui, L., Xu, R., Long, Y., & Wang, H. (2019) · Bioinformatics · doi:10.1093/bioinformatics/btz451 · Cited by 29
Tsai, Z. T., Shiu, S., & Tsai, H. (2015) · PLoS Computational Biology · doi:10.1371/journal.pcbi.1004418 · Cited by 29
Gong, W., Koyano-Nakagawa, N., Li, T., & Garry, D. J. (2015) · BMC Bioinformatics · doi:10.1186/s12859-015-0460-0 · Cited by 26
Hybrid model for efficient prediction of poly(A) signals in human genomic DNA
Albalawi, F., Chahid, A., Guo, X., Albaradei, S., Magana-Mora, A., Janković, B. R., Uludağ, M., Neste, C. V., Essack, M., Laleg‐Kirati, T., et al. (2019) · Methods · doi:10.1016/j.ymeth.2019.04.001 · Cited by 26
Towards a better understanding of TF-DNA binding prediction from genomic features
Wang, Z., Gong, M., Liu, Y., Xiong, S., Wang, M., Zhou, J., & Zhang, Y. (2022) · Computers in Biology and Medicine · doi:10.1016/j.compbiomed.2022.105993 · Cited by 24
Nie, Y., Liu, H., & Sun, X. S. (2013) · PLoS ONE · doi:10.1371/journal.pone.0060002 · Cited by 26
G4mismatch: Deep neural networks to predict G-quadruplex propensity based on G4-seq data
Barshai, M., Engel, B., Haim, I., & Orenstein, Y. (2023) · PLoS Computational Biology · doi:10.1371/journal.pcbi.1010948 · Cited by 23
Svetlichnyy, D., Imrichová, H., Fiers, M. W. E. J., Atak, Z. K., & Aerts, S. (2015) · PLoS Computational Biology · doi:10.1371/journal.pcbi.1004590 · Cited by 22
Yang, J., & Ramsey, S. A. (2015) · Bioinformatics · doi:10.1093/bioinformatics/btv391 · Cited by 20
Yu, Y., Ding, P., Gao, H., Liu, G., Zhang, F., & Yu, B. (2023) · Briefings in Bioinformatics · doi:10.1093/bib/bbad036 · Cited by 19
A comprehensive review of computational prediction of genome-wide features
Xu, T., Zheng, X., Li, B., Jin, P., Qin, Z. S., & Wu, H. (2018) · Briefings in Bioinformatics · doi:10.1093/bib/bby110 · Cited by 20
Identification of regulatory regions of bidirectional genes in cervical cancer
Wang, G., Qi, K., Zhao, Y., Li, Y., Juan, L., Teng, M., Li, L., Liu, Y., & Wang, Y. (2013) · BMC Medical Genomics · doi:10.1186/1755-8794-6-s1-s5 · Cited by 19
Cheng, C., Shou, C., Yip, K. Y.-L., & Gerstein, M. (2011) · Genome biology · doi:10.1186/gb-2011-12-11-r111 · Cited by 18
Transcription Factor Binding Sites Prediction Based on Modified Nucleosomes
Talebzadeh, M., & Zare‐Mirakabad, F. (2014) · PLoS ONE · doi:10.1371/journal.pone.0089226 · Cited by 19
Gongqiang, L., Zhou, J., Xu, R., Lu, Q., & Wang, H. (2019) · International Journal of Molecular Sciences · doi:10.3390/ijms20143425 · Cited by 17
Hou, L., Li, S., Tong, Z., Yuan, X., Xu, J., & Li, J. (2021) · Industrial Crops and Products · doi:10.1016/j.indcrop.2021.113779 · Cited by 16
Genome-wide predictors of NF-κB recruitment and transcriptional activity
Cieslik, M. P., & Bekiranov, S. (2015) · BioData Mining · doi:10.1186/s13040-015-0071-3 · Cited by 16
Cis-regulatory determinants of MyoD function
Soleimani, V. D., Nguyen, D., Ramachandran, P., Palidwor, G., Porter, C. J., Yin, H., Perkins, T. J., & Rudnicki, M. A. (2018) · Nucleic Acids Research · doi:10.1093/nar/gky388 · Cited by 16
Prediction of TF-Binding Site by Inclusion of Higher Order Position Dependencies
Zhou, J., Lu, Q., Xu, R., Gui, L., & Wang, H. (2019) · IEEE Transactions on Computational Biology and Bioinformatics · doi:10.1109/tcbb.2019.2892124 · Cited by 15
Survey of protein–DNA interactions in Aspergillus oryzae on a genomic scale
Wang, C., Lv, Y., Wang, B., Yin, C., Lin, Y. C., & Pan, L. (2015) · Nucleic Acids Research · doi:10.1093/nar/gkv334 · Cited by 12
Won, K., Xu, Z. Q., Zhang, X., Whitaker, J. W., Shoemaker, R., Ren, B., Xu, Y., & Wang, W. (2012) · Nucleic Acids Research · doi:10.1093/nar/gks584 · Cited by 12
Self-citationRoccaro, M., Brocke‐Ahmadinejad, N., Colby, T., & Somssich, I. E. (2013) · BMC Plant Biology · doi:10.1186/1471-2229-13-164 · Cited by 12
CTF: a CRF-based transcription factor binding sites finding system
He, Y., Zhang, Y., Zheng, G., & Wei, C. (2012) · BMC Genomics · doi:10.1186/1471-2164-13-s8-s18 · Cited by 12
Chromatin-driven de novo discovery of DNA binding motifs in the human malaria parasite
Harris, E. Y., Ponts, N., Roch, K. G. L., & Lonardi, S. (2011) · BMC Genomics · doi:10.1186/1471-2164-12-601 · Cited by 11
Tissue-specific prediction of directly regulated genes
McLeay, R. C., Leat, C. J., & Bailey, T. L. (2011) · Bioinformatics · doi:10.1093/bioinformatics/btr399 · Cited by 11
Fish-Ing for Enhancers in the Heart
Parisi, C., Vashisht, S., & Winata, C. L. (2021) · International Journal of Molecular Sciences · doi:10.3390/ijms22083914 · Cited by 11
Won, K., Choi, I., LeRoy, G., Zee, B. M., Sidoli, S., Gonzales-Cope, M., & Garcia, B. A. (2015) · Epigenetics & Chromatin · doi:10.1186/s13072-015-0005-9 · Cited by 11
Self-citationChromatin Immunoprecipitation in Adult Zebrafish Red Cells
Trompouki, E., Bowman, T. V., DiBiase, A., Zhou, Y., & Zon, L. I. (2011) · Methods in cell biology · doi:10.1016/b978-0-12-374814-0.00019-7 · Cited by 10
Wang, J. (2011) · BMC Genomics · doi:10.1186/1471-2164-12-172 · Cited by 9
Wei, L. K., & Au, A. (2017) · Elsevier eBooks · doi:10.1016/b978-0-12-805388-1.00012-2 · Cited by 9
Bioinformatics of Epigenomic Data Generated From Next-Generation Sequencing
Hsu, F., Gohain, M., Chang, P. P.-C., Lu, R. J.-H., & Chen, P. (2018) · Elsevier eBooks · doi:10.1016/b978-0-12-812215-0.00004-2 · Cited by 8
Inhomogeneous Parsimonious Markov Models
Eggeling, R., Gohr, A., Bourguignon, P.-Y., Wingender, E., & Große, I. (2013) · Lecture notes in computer science · doi:10.1007/978-3-642-40988-2_21 · Cited by 8
Metamotifs - a generative model for building families of nucleotide position weight matrices
Piipari, M., Down, T. A., & Hubbard, T. (2010) · BMC Bioinformatics · doi:10.1186/1471-2105-11-348 · Cited by 7
Kaplan, T., & Biggin, M. D. (2012) · Methods in cell biology · doi:10.1016/b978-0-12-388403-9.00011-4 · Cited by 7
Zhou, W., Sherwood, B., & Ji, H. (2016) · Human Heredity · doi:10.1159/000450827 · Cited by 7
Zhang, Y., He, Y., Zheng, G., & Wei, C. (2015) · BMC Genomics · doi:10.1186/1471-2164-16-s7-s13 · Cited by 6
Sanchita, G., Baby, B. M., & Sharma, A. K. (2013) · Plant Omics · Cited by 6
Kin, K., Chen, X. X., Gonzalez‐Garay, M. L., & Fakhouri, W. D. (2016) · Human Molecular Genetics · doi:10.1093/hmg/ddw030 · Cited by 6
Wei, Y., Wu, G. Y., & Ji, H. (2012) · Statistics in Biosciences · doi:10.1007/s12561-012-9066-5 · Cited by 5
A penalized Bayesian approach to predicting sparse protein–DNA binding landscapes
Levinson, M. D., & Zhou, Q. (2013) · Bioinformatics · doi:10.1093/bioinformatics/btt585 · Cited by 5
Models incorporating chromatin modification data identify functionally important p53 binding sites
Lim, J., Iggo, R. D., & Barker, D. (2013) · Nucleic Acids Research · doi:10.1093/nar/gkt260 · Cited by 5
A Wavelet Approach to Detect Enriched Regions and Explore Epigenomic Landscapes
Nguyen, N., Vo, A., & Won, K. (2014) · Journal of Computational Biology · doi:10.1089/cmb.2014.0095 · Cited by 4
Self-citationOccupancy Classification of Position Weight Matrix-Inferred Transcription Factor Binding Sites
Wright, H., Cohen, A. M., Sönmez, K., Yochum, G. S., & McWeeney, S. K. (2011) · PLoS ONE · doi:10.1371/journal.pone.0026160 · Cited by 4
Integrating epigenetic marks for identification of transcriptionally active miRNAs
Xiao, Y., Liu, T., Zhao, H., Li, X., Guan, J., Xu, C., Ping, Y., Fan, H., Wang, L., Zhao, T., et al. (2014) · Genomics · doi:10.1016/j.ygeno.2014.07.003 · Cited by 3
Gusmao, E. G., Dieterich, C., & Costa, I. G. (2012) · Lecture notes in computer science · doi:10.1007/978-3-642-31927-3_10 · Cited by 3
Blanco, E., & Corominas, M. (2012) · BMC Genomics · doi:10.1186/1471-2164-13-688 · Cited by 3
Fast training on large genomics data using distributed Support Vector Machines
Theera-Ampornpunt, N., Kim, S., Ghoshal, A., Bagchi, S., Grama, A. Y., & Chaterji, S. (2016) · doi:10.1109/comsnets.2016.7439943 · Cited by 3
Fu, H., Yang, L., & Zhang, X. (2017) · Current Genomics · doi:10.2174/1389202918666170228143619 · Cited by 3
An intriguing characteristic of enhancer-promoter interactions
Talukder, A., Hu, H., & Li, X. (2021) · BMC Genomics · doi:10.1186/s12864-021-07440-5 · Cited by 3
Turner, M., Barshai, M., & Orenstein, Y. (2022) · ACM International Conference on Bioinformatics, Computational Biology, and Health Informatics (ACM-BCB) · doi:10.1145/3535508.3545534 · Cited by 2
Bioinformatics of epigenetic data generated from next-generation sequencing
Sheu, C.-Y. L., Huang, Y., Lin, P.-Y., Lin, G.-J., & Chen, P. (2023) · Elsevier eBooks · doi:10.1016/b978-0-443-18661-5.00006-3 · Cited by 2
Genome‐Wide Mapping of Protein–DNA Interactions by ChIP‐Seq
Ho, J. W. K., Alekseyenko, A. A., Kuroda, M. I., & Park, P. J. (2011) · doi:10.1002/9783527644582.ch9 · Cited by 2
TrFAST: A Tool to Predict Signaling Pathway-Specific Transcription Factor Binding Sites
Seemab, U., Ain, Q. U., Nawaz, M. S., Saeed, Z., & Rashid, S. (2012) · Genomics Proteomics & Bioinformatics · doi:10.1016/j.gpb.2012.06.007 · Cited by 1
Wang, T., & Liu, Z. (2026) · Interdisciplinary Sciences Computational Life Sciences · doi:10.1007/s12539-025-00807-2 · Cited by 1
TransG4: an interpretable deep-learning approach for sequence-based G-quadruplex prediction.
Yuan, Y.-N., Tian, Y., Liu, Z., & Ma, J. (2026) · Physical Chemistry, Chemical Physics - PCCP · doi:10.1039/d6cp00173d · Cited by 1
Gaussian derivative wavelets identify dynamic changes in histone modification
Nguyen, N., & Won, K. (2014) · IEEE Conference on Computational Intelligence in Bioinformatics and Computational Biology (CIBCB) · doi:10.1109/cibcb.2014.6845533 · Cited by 1
Self-citationDu, Z., Huang, T., Li, J., & Uversky, V. N. (2023) · IEEE International Conference on Bioinformatics and Biomedicine (BIBM) · doi:10.1109/bibm58861.2023.10385552 · Cited by 1
A computational approach to discovering p53 binding sites in the human genome
Lim, J. (2013) · St Andrews Research Repository (St Andrews Research Repository)
Statistical Learning and Modeling of TF-DNA Binding
Jiang, B., & Liu, J. S. (2011) · Springer eBooks · doi:10.1007/978-3-642-16345-6_3
Metadata
- Authors
- Won, K.-J., Ren, B., & Wang, W.
- Affiliations
- University of California San Diego (US)
- Ludwig Cancer Research (BE)
- Corresponding author
- Wang, Wei
- Venue
- Genome Biology
- Published
- 2010-01-22
- Volume
- 11
- Issue
- 1
- Pages
- R7-R7
- ISSN
- 1465-6906 (ISSN-L)
- 1474-760X
- PMC
- PMC2847719
- OpenAlex
- W2078034709
- Cited by
- 116
- References
- 58
- Citations by year
- 2026: 2 · 2024: 1 · 2023: 4 · 2022: 2 · 2021: 6 · 2020: 4 · 2019: 4 · 2018: 4 · 2017: 3 · 2016: 5 · 2015: 13 · 2014: 10 · 2013: 19 · 2012: 12
- FWCI
- 7.56
- Type
- journal article
- Language
- en
- Open access
- gold
- doi.org
- Locations
- Genome biology (publishedVersion, cc-by)
- PubMed Central (publishedVersion, cc-by)
- PubMed (publishedVersion)
- eScholarship (California Digital Library) (submittedVersion)
- Funders
- National Institutes of Health
- National Institute of General Medical Sciences (R01GM072856)
- Topics
- Life Sciences › Biochemistry, Genetics and Molecular Biology › Molecular Biology › Genomics and Chromatin Dynamics
- Life Sciences › Biochemistry, Genetics and Molecular Biology › Molecular Biology › Genomics and Phylogenetic Studies
- Life Sciences › Biochemistry, Genetics and Molecular Biology › Molecular Biology › Chromatin Remodeling and Cancer
- Keywords
- transcription factor binding sites, chromia, regulatory elements, promoter, enhancers, mouse embryonic stem cells, ChIP-seq, RNAi knockdown, genomic prediction
- MeSH terms
- Animals, Binding Sites, Chromatin, Enhancer Elements, Genetic, Models, Genetic, Promoter Regions, Genetic, ROC Curve, Transcription Factors, Genome, Computational Biology, Amino Acid Motifs, RNA Interference, Chromatin Immunoprecipitation, Mice, Embryonic Stem Cells
About these checks
Registry, retraction, Cites and statistics results are computed, not judged, with one exception: a printed reference that no index lists is read once by a model before it counts as a citation error. Claims are extracted by a model and kept only when their quote appears verbatim in the text; each cited source is then checked, with a model’s help, for whether it says what the claim relies on. Those verdicts can be wrong — read the claim’s quote and the cited source before relying on one.
Statistics and arithmetic are recomputed, not judged.
Confidence bands are shown only for fields calibrated on our annotated test set. None is calibrated yet, so no band is shown.
What counts as a claim ›How we measure confidence ›How we check this ›
Are you an author, or do you see a problem with this page? Request a review
