

The DOI matches its Crossref record; 35 of the 35 references it cites were found in a registry or an index.
Cytosine methylation changes in enhancer regions of core pro-fibrotic genes characterize kidney fibrosis development
Open accessAbstract
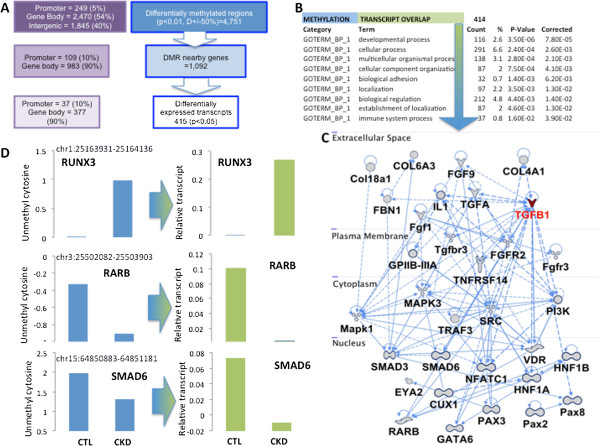
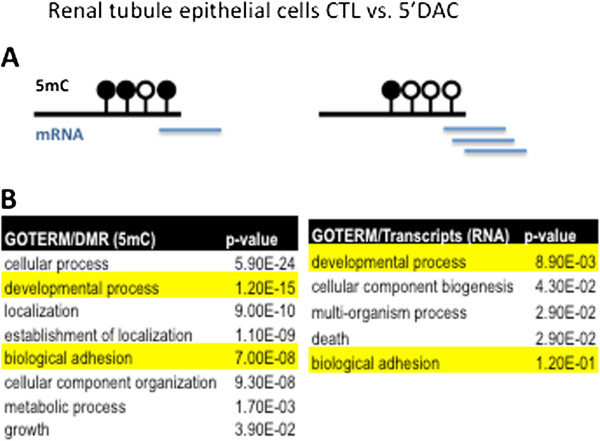
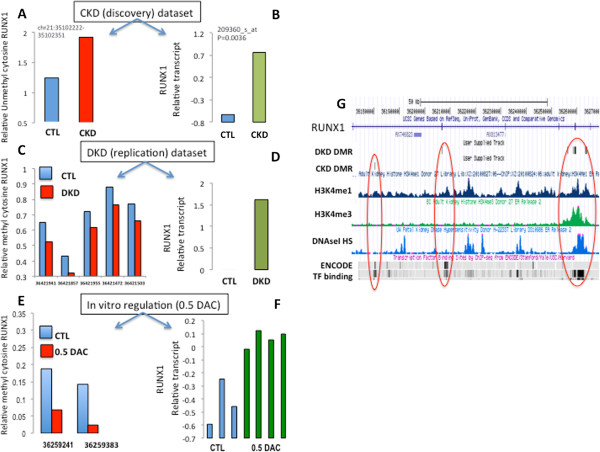
Background: One in eleven people is affected by chronic kidney disease, a condition characterized by kidney fibrosis and progressive loss of kidney function. Epidemiological studies indicate that adverse intrauterine and postnatal environments have a long-lasting role in chronic kidney disease development. Epigenetic information represents a plausible carrier for mediating this programming effect. Here we demonstrate that genome-wide cytosine methylation patterns of healthy and chronic kidney disease tubule samples obtained from patients show significant differences. Results: We identify differentially methylated regions and validate these in a large replication dataset. The differentially methylated regions are rarely observed on promoters, but mostly overlap with putative enhancer regions, and they are enriched in consensus binding sequences for important renal transcription factors. This indicates their importance in gene expression regulation. A core set of genes that are known to be related to kidney fibrosis, including genes encoding collagens, show cytosine methylation changes correlating with downstream transcript levels. Conclusions: Our report raises the possibility that epigenetic dysregulation plays a role in chronic kidney disease development via influencing core pro-fibrotic pathways and can aid the development of novel biomarkers and future therapeutics.
Overview
The claims and statistics of this paper haven’t been checked yet.
Run the check — free, no account needed. It reads the open-access text and checks the sources it cites.
Integrity signals
Registry
Cites
Statistics
Figures
Verification
Claims the paper makes
The claims and statistics of this paper haven’t been checked yet.
Run the check — free, no account needed. It reads the open-access text and checks the sources it cites.
Claims other papers make about this one
Each is checked against this paper’s own text: does it say what the citing paper says it does?
In the citing paper
“In a genome-wide DNA methylation study of human kidney tubules, several genes that are associated with kidney fibrosis were characterized by methylation changes and alterations of downstream transcript levels in CKD samples compared with controls197.”
From The gut microbiota and the brain–gut–kidney axis in hypertension and chronic kidney disease (2018) · cites this paper as [197]
Self-check
Percentages, sums and reported differences re-computed from the paper’s own numbers.
The self-check needs the paper’s full text.
Citations
Cites
The accessible chromatin landscape of the human genome
Thurman, R. E., Rynes, E., Humbert, R., Vierstra, J., Maurano, M. T., Haugen, E., Sheffield, N. C., Stergachis, A. B., Wang, H., Vernot, B., et al. (2012) · Nature · doi:10.1038/nature11232 · Cited by 2,679
ChromHMM: automating chromatin-state discovery and characterization
Ernst, J., & Kellis, M. (2012) · Nature Methods · doi:10.1038/nmeth.1906 · Cited by 2,482
Cancer-epigenetics comes of age
Jones, P. A., & Laird, P. W. (1999) · Nature Genetics · doi:10.1038/5947 · Cited by 2,358
Identifying ChIP-seq enrichment using MACS
Feng, J., Liu, T., Qin, B., Zhang, Y., & Liu, X. S. (2012) · Nature Protocols · doi:10.1038/nprot.2012.101 · Cited by 1,848
Principles and challenges of genome-wide DNA methylation analysis
Laird, P. W. (2010) · Nature Reviews Genetics · doi:10.1038/nrg2732 · Cited by 1,611
Cancer Genetics and Epigenetics: Two Sides of the Same Coin?
You, J. S., & Jones, P. A. (2012) · Cancer Cell · doi:10.1016/j.ccr.2012.06.008 · Cited by 1,206
Transcriptome Analysis of Human Diabetic Kidney Disease
Woroniecka, K. I., Park, A. S. D., Mohtat, D., Thomas, D. B., Pullman, J. M., & Suszták, K. (2011) · Diabetes · doi:10.2337/db10-1181 · Cited by 651
Self-citationEmerging Biomarkers for Evaluating Cardiovascular Risk in the Chronic Kidney Disease Patient
Stenvinkel, P., Carrero, J. J., Axelsson, J., Lindholm, B., Heimbürger, O., & Massy, Z. A. (2008) · Clinical Journal of the American Society of Nephrology · doi:10.2215/cjn.03670807 · Cited by 577
Regulatory Sequence Analysis Tools
van Helden, J. (2003) · Nucleic Acids Research · doi:10.1093/nar/gkg567 · Cited by 545
Comparative isoschizomer profiling of cytosine methylation: The HELP assayPreprint
Khulan, B., Thompson, R. F., Ye, K. Q., Fazzari, M. J., Suzuki, M., Stasiek, E., Figueroa, M. E., Glass, J. L., Chen, Q., Montagna, C., et al. (2006) · Genome Research · doi:10.1101/gr.5273806 · Cited by 400
Self-citation
Cited by
Sorted by citations
Items 201–226 of 226
Epigenetics analysis of SOCS1 gene and its association with chronic periodontitis
Planello, A. C. (2014) · doi:10.47749/t/unicamp.2014.927598 · Cited by 1
Curcumin and Analogues as Potential Epigenetic Modulators: Prevention of Metabolic DiseasesPreprint
Tang, C., Liu, Y., Liu, S., Yang, C., Chen, L., Fengru, T. A. N. G., Wang, F., Zan, L., Deng, H., Lin, Y., et al. (2024) · doi:10.22541/au.170666150.09141621/v1 · Cited by 1
The Developmental Origins of Renal Dysfunction
Cuffe, J. S. M., Walton, S. L., & Moritz, K. M. (2015) · Elsevier eBooks · doi:10.1016/b978-0-12-801383-0.00015-3
Neuroepigenomics and Human Disease
Greally, J. M., & Nestler, E. J. (2016) · Elsevier eBooks · doi:10.1016/b978-0-12-800105-9.00005-6
Self-citationIntragenomic Redistribution of Host Transcription Factor Binding With Toxoplasma Gondii InfectionPreprint
Ulahannan, N., Suzuki, M., Simões‐Pires, C. A., Wicik, Z., Wijetunga, N. A., Croken, M. M., Bhattacharyya, S., Johnston, A. D., Kong, Y., Maqbool, S. B., et al. (2017) · bioRxiv (Cold Spring Harbor Laboratory) · doi:10.1101/132076
Self-citationDiabetic nephropathy—emerging epigenetic
Natarajan, R. D. (2014)
Insights into Glomerular Cell Biology in Health and Disease
Alghamdi, T. A. (2019) · TSpace (University of Toronto)
Big Data and Its Emerging Role in Precision Medicine and Therapeutic Response
Epsi, N. J., Panja, S., & Mitrofanova, A. (2020) · Royal Society of Chemistry eBooks · doi:10.1039/9781788019958-00088
On the Relationship of Diabetes and Sleep Apnea: Evolution and Epigenetics
Wilson, N. R. C. (2021) · ScholarsArchive (Brigham Young University)
Alqahtani, S. M. (2022) · Journal of Biosciences and Medicines · doi:10.4236/jbm.2022.1012006
“It was reported that there were dynamic changes in the area of microglia and astrocyte populations at early stages, which were accompanied by different transcriptional pathways in both mouse models of ALS and human postmortem nervous tissue [68].”
Ahrtz, L. (2024) · El Servicio de Difusión de la Creación Intelectual (National University of La Plata) · doi:10.35537/10915/175148
The Role of Fatty Acid Oxidation in Peritoneal Dialysis Related Peritoneal Fibrosis
徐, 李. (2025) · Advances in Clinical Medicine · doi:10.12677/acm.2025.152482
The Impact of Epigenomics on Understanding Kidney Diseases
Agrawal, S. S. (2025) · Indian Journal of Nephrology · doi:10.25259/ijn_136_2025
Diabetic Kidney Disease: A Versatile Disease
Granados‐Silvestre, M. D. L. Á., Ortiz‐López, M. G., & Sanchez-Pozos, K. A. (2025) · BENTHAM SCIENCE PUBLISHERS eBooks · doi:10.2174/9789815305692125010013
Sagy, N., Meyrom, N., Beckerman, P., Pleniceanu, O., & Bar, D. Z. (2024) · Figshare · doi:10.6084/m9.figshare.26680082
Sagy, N., Meyrom, N., Beckerman, P., Pleniceanu, O., & Bar, D. Z. (2024) · Figshare · doi:10.6084/m9.figshare.26680085
Sagy, N., Meyrom, N., Beckerman, P., Pleniceanu, O., & Bar, D. Z. (2024) · Figshare · doi:10.6084/m9.figshare.26680088
Novos biomarcadores para estratificação do risco de DRC: uma revisão da literatura
Khan, S. M., Zobairi, A., Rehan, E. A., & Mohammed, A. H. (2026) · Brazilian Journal of Nephrology · doi:10.1590/2175-8239-jbn-2025-0109pt
“…e ao aumento de estresse oxidativo, calcificação vascular e fibrose, levando, em última instância, ao agravamento dos desfechos da DRC. Além disso, Ko et al. 64 investigaram o perfil de metilação em todo o genoma e detectaram uma extensa hipometilação global do DNA em pacientes com DRC,…”
The role of epigenetic modifications in cancer-associated fibroblasts
Yan, B., Yang, C., Liu, X., Zuo, Q., Wang, J., Yang, W., & Chen, H. (2026) · Frontiers in Medicine · doi:10.3389/fmed.2026.1780734
Parental Obesity and Offspring Risk for Cardiorenal Diseases
do Carmo, J. M., Hall, J. E., Wang, Z., Mouton, A. J., Omoto, A. C. M., Jorge, L., & da Silva, A. A. (2026) · Current Hypertension Reports · doi:10.1007/s11906-026-01379-2
“Epi-genetic mechanisms are also implicated in the development of CKD [76], as supported by evidence showing that renal tubules from patients with CKD exhibit significant DNA methylation changes, particularly at enhancer regions associated with increased expression of key fibrotic genes [ 46].”
Larkin, B. P., Nguyen, L. T., Parthiban, N. K., Chen, H., Faiz, A., Jayawickreme, K. P., Glastras, S. J., Pollock, C. A., & Saad, S. (2026) · Nutrients · doi:10.3390/nu18193212
Rawat, A., Prasad, N., Komalkumar, C., Singh, H., Chaturvedi, S., Ahmed, S., Kumar, B., & Kushwaha, R. S. (2026) · Frontiers in Immunology · doi:10.3389/fimmu.2026.1910925
Liu, H., Liu, X., Zhang, S., Lv, J., Li, S., Shang, S., Jia, S., Wei, Y., Wang, F., Su, J., et al. (2016) · doi:10.24347/omic_19748_2.2.1/lm8664
吴娟, Sheng, P., Lu, Y., & Chen, K. (2026) · Clinical and Translational Medicine · doi:10.1002/ctm2.70866
“For the kidney specifically, methylation serves as a cell-of-origin tag and as a disease signal in its own right, since Ko et al. 121 showed that cytosine methylation changes in enhancers of profibrotic genes characterize kidney fibrosis, and Gluck et al. 122 showed that kidney methylation states…”
Metadata
- Authors
- Ko, Y.-A., Mohtat, D., Suzuki, M., Park, A. S. D., Izquierdo, M. C., Han, S. Y., Kang, H. M., Si, H., Hostetter, T., Pullman, J. M., Fazzari, M., Verma, A., Zheng, D., Greally, J. M., & Susztak, K.
- Affiliations
- University of Pennsylvania (US)
- Albert Einstein College of Medicine (US)
- Case Western Reserve University (US)
- Montefiore Medical Center (US)
- Corresponding author
- Greally, John M
- ORCID
- Venue
- Genome Biology
- Published
- 2013-12-10
- Volume
- 14
- Issue
- 10
- Pages
- R108-R108
- ISSN
- 1465-6906 (ISSN-L)
- 1474-760X
- PMC
- PMC4053753
- OpenAlex
- W2130816592
- Cited by
- 225
- References
- 35
- Citations by year
- 2026: 9 · 2025: 10 · 2024: 19 · 2023: 9 · 2022: 10 · 2021: 14 · 2020: 16 · 2019: 24 · 2018: 29 · 2017: 20 · 2016: 16 · 2015: 30 · 2014: 16 · 2013: 3
- FWCI
- 9.71
- Type
- journal article
- Language
- en
- Open access
- gold
- doi.org
- Locations
- Genome biology (publishedVersion, cc-by)
- Europe PMC (PubMed Central) (publishedVersion, cc-by)
- PubMed Central (publishedVersion, cc-by)
- PubMed (publishedVersion)
- Funders
- National Institutes of Health
- National Institute of Diabetes and Digestive and Kidney Diseases (R01DK087635)
- Topics
- Life Sciences › Biochemistry, Genetics and Molecular Biology › Molecular Biology › Epigenetics and DNA Methylation
- Health Sciences › Medicine › Nephrology › Chronic Kidney Disease and Diabetes
- Life Sciences › Biochemistry, Genetics and Molecular Biology › Molecular Biology › Genomics and Chromatin Dynamics
- Keywords
- cytosine methylation, renal fibrosis, chronic kidney disease, differentially methylated regions, enhancers, epigenetic dysregulation, collagen genes, gene expression regulation, developmental programming, biomarkers
- MeSH terms
- Aged, Base Sequence, Binding Sites, Cytosine, Enhancer Elements, Genetic, Fibrosis, Gene Expression Regulation, Humans, Kidney, Middle Aged, Transcription Factors, Transcription, Genetic, Reproducibility of Results, Cluster Analysis, Case-Control Studies, DNA Methylation, Gene Expression Profiling, Renal Insufficiency, Chronic, Gene Regulatory Networks, Position-Specific Scoring Matrices, Nucleotide Motifs
About these checks
Registry, retraction, Cites and statistics results are computed, not judged, with one exception: a printed reference that no index lists is read once by a model before it counts as a citation error. Claims are extracted by a model and kept only when their quote appears verbatim in the text; each cited source is then checked, with a model’s help, for whether it says what the claim relies on. Those verdicts can be wrong — read the claim’s quote and the cited source before relying on one.
Statistics and arithmetic are recomputed, not judged.
Confidence bands are shown only for fields calibrated on our annotated test set. None is calibrated yet, so no band is shown.
What counts as a claim ›How we measure confidence ›How we check this ›
Are you an author, or do you see a problem with this page? Request a review
