

The DOI matches its Crossref record; 26 of the 26 references it cites were found in a registry or an index.
Oxidation precursor dependence of atomic layer deposited Al2O3 films in a-Si:H(i)/Al2O3 surface passivation stacks
Open accessAbstract
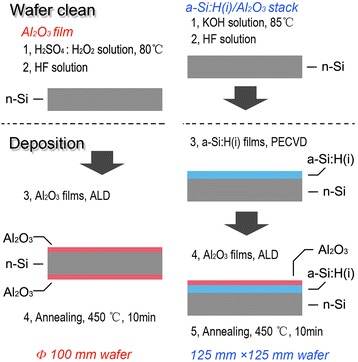
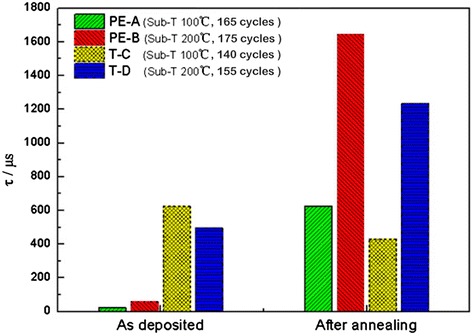
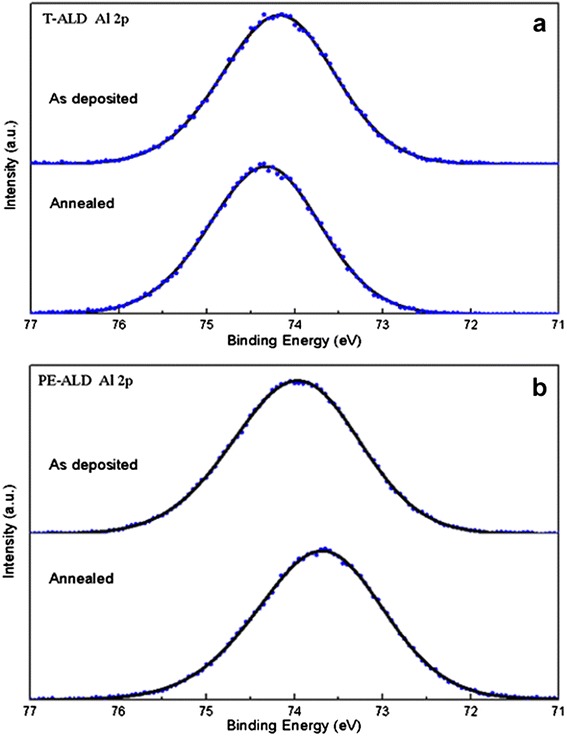
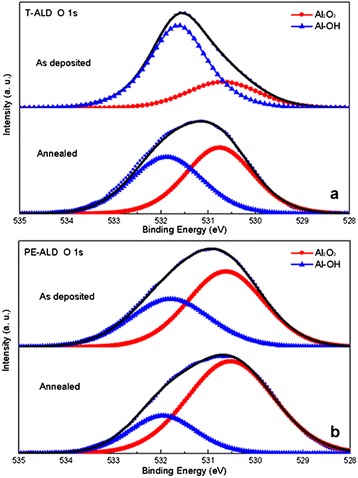
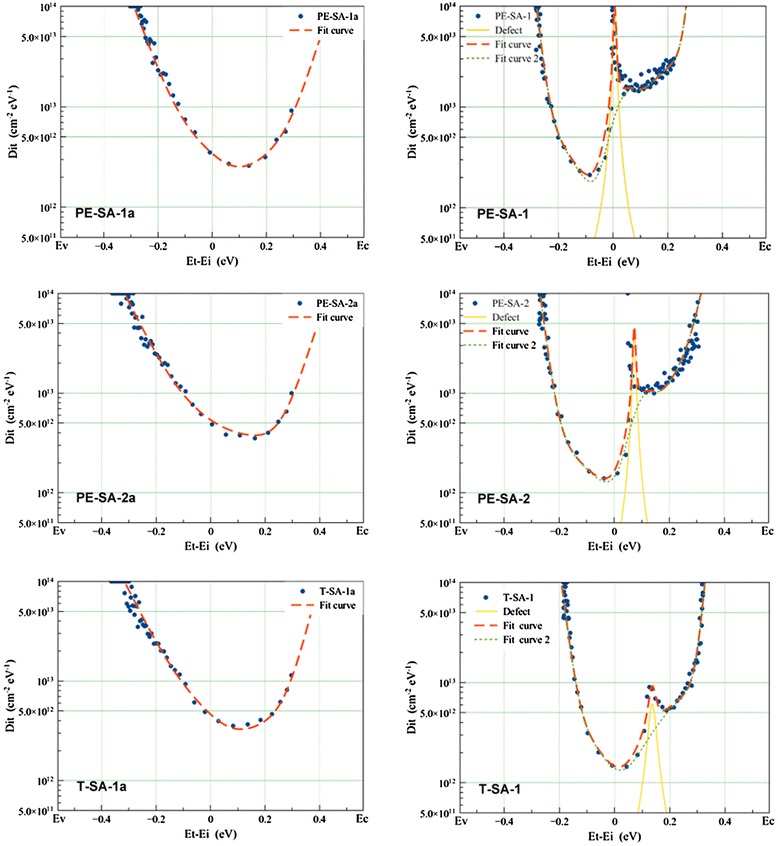
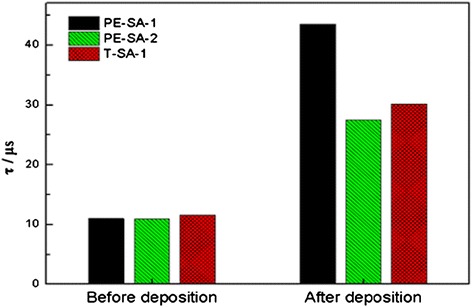
In order to obtain a good passivation of a silicon surface, more and more stack passivation schemes have been used in high-efficiency silicon solar cell fabrication. In this work, we prepared a-Si:H(i)/Al 2 O 3 stacks on KOH solution-polished n-type solar grade mono-silicon(100) wafers. For the Al 2 O 3 film deposition, both thermal atomic layer deposition (T-ALD) and plasma enhanced atomic layer deposition (PE-ALD) were used. Interface trap density spectra were obtained for Si passivation with a-Si films and a-Si:H(i)/Al 2 O 3 stacks by a non-contact corona C-V technique. After the fabrication of a-Si:H(i)/Al 2 O 3 stacks, the minimum interface trap density was reduced from original 3 × 10 12 to 1 × 10 12 cm −2 eV −1 , the surface total charge density increased by nearly one order of magnitude for PE-ALD samples and about 0.4 × 10 12 cm −2 for a T-ALD sample, and the carrier lifetimes increased by a factor of three (from about 10 μs to about 30 μs). Combining these results with an X-ray photoelectron spectroscopy analysis, we discussed the influence of an oxidation precursor for ALD Al 2 O 3 deposition on Al 2 O 3 single layers and a-Si:H(i)/Al 2 O 3 stack surface passivation from field-effect passivation and chemical passivation perspectives. In addition, the influence of the stack fabrication process on the a-Si film structure was also discussed in this study.
Overview
The claims and statistics of this paper haven’t been checked yet.
Run the check — free, no account needed. It reads the open-access text and checks the sources it cites.
Integrity signals
Registry
Cites
Statistics
Figures
Verification
Claims the paper makes
The claims and statistics of this paper haven’t been checked yet.
Run the check — free, no account needed. It reads the open-access text and checks the sources it cites.
Claims other papers make about this one
Each is checked against this paper’s own text: does it say what the citing paper says it does?
The source backs part of the claim, not all of it — or backs it for a different population, condition or comparison.
In the citing paper
“we replaced the oxidant for the Al2O3 tunneling layer from H2O to O3 to reduce the H-passivated traps30–33, thereby improving the programming speed”
From Flexible self-rectifying synapse array for energy-efficient edge multiplication in electrocardiogram diagnosis (2025) · cites this paper as [30]
Experimental — accuracy not yet measured
Self-check
Percentages, sums and reported differences re-computed from the paper’s own numbers.
The self-check needs the paper’s full text.
Citations
Cites
Pal, M., Pal, U., Gracia‐Jiménez, J. M., & Pérez-Rodríguez, F. (2012) · Nanoscale Research Letters · doi:10.1186/1556-276x-7-1 · Cited by 2,621
On the c-Si surface passivation mechanism by the negative-charge-dielectric Al2O3
Hoex, B., Gielis, J. J. H., van de Sanden, M. C. M., & Kessels, W. M. M. (2008) · Journal of Applied Physics · doi:10.1063/1.3021091 · Cited by 547
Surface passivation of high‐efficiency silicon solar cells by atomic‐layer‐deposited Al2O3
Schmidt, J., Merkle, A., Brendel, R., Hoex, B., van de Sanden, M. C. M., & Kessels, W. M. M. (2008) · Progress in Photovoltaics Research and Applications · doi:10.1002/pip.823 · Cited by 461
HITTM cells?high-efficiency crystalline Si cells with novel structure
Taguchi, M., Kawamoto, K., Tsuge, S., Baba, T., Sakata, H., Morizane, M., Uchihashi, K., Nakamura, N., Kiyama, S., & Oota, O. (2000) · Progress in Photovoltaics Research and Applications · doi:10.1002/1099-159x(200009/10)8:5 · Cited by 405
Improved defect-pool model for charged defects in amorphous silicon
Powell, M. J., & Deane, S. C. (1993) · Physical review. B, Condensed matter · doi:10.1103/physrevb.48.10815 · Cited by 298
Plasma and Thermal ALD of Al[sub 2]O[sub 3] in a Commercial 200 mm ALD Reactor
van Hemmen, J. L., Heil, S. B. S., Klootwijk, J. H., Roozeboom, F., Hodson, C. J., van de Sanden, M. C. M., & Kessels, W. M. M. (2007) · Journal of The Electrochemical Society · doi:10.1149/1.2737629 · Cited by 279
Hydrogen induced passivation of Si interfaces by Al2O3 films and SiO2/Al2O3 stacks
Dingemans, G., Beyer, W., van de Sanden, M. C. M., & Kessels, W. M. M. (2010) · Applied Physics Letters · doi:10.1063/1.3497014 · Cited by 181
Dingemans, G., Einsele, F., Beyer, W., van de Sanden, M. C. M., & Kessels, W. M. M. (2012) · Journal of Applied Physics · doi:10.1063/1.4709729 · Cited by 174
Influence of the Oxidant on the Chemical and Field-Effect Passivation of Si by ALD Al[sub 2]O[sub 3]
Dingemans, G., Terlinden, N. M., Pierreux, D., Profijt, H. B., van de Sanden, M. C. M., & Kessels, W. M. M. (2010) · Electrochemical and Solid-State Letters · doi:10.1149/1.3501970 · Cited by 166
Stability of Al2O3 and Al2O3/a-SiNx:H stacks for surface passivation of crystalline silicon
Dingemans, G., Engelhart, P., Seguin, R., Einsele, F., Hoex, B., van de Sanden, M. C. M., & Kessels, W. M. M. (2009) · Journal of Applied Physics · doi:10.1063/1.3264572 · Cited by 158
Research works printed but not linked: 1
- Savtchouk MW A, Edelman P, Lagowski J, Zhan X, Rong Y, Ted G, et al. Interface traps at intrinsic ia-Si:H/c-Si interfaces. In: 24th Workshop on Crystalline Silicon Solar Cells & Modules: Materials and Processes. 2014.
Cited by
Sorted by citations
Kaur, G., Dwivedi, N., Zheng, X., Liao, B., Peng, L. Z., Danner, A. J., Stangl, R., & Bhatia, C. S. (2017) · IEEE Journal of Photovoltaics · doi:10.1109/jphotov.2017.2717040 · Cited by 47
Wang, Z., Bandyopadhyay, A., Kumar, H., Li, M., Venkatakrishnan, A., Shenoy, V. B., & Detsi, E. (2019) · Journal of Energy Storage · doi:10.1016/j.est.2019.02.022 · Cited by 26
Lee, Y., Rhee, H., Kim, G., Cheong, W. H., Kim, D. H., Song, H., Kay, S. N., Lee, J., & Kim, K. M. (2025) · Nature Communications · doi:10.1038/s41467-025-59589-2 · Cited by 19
Low, R. S., Asubar, J. T., Baratov, A., Kamiya, S., Nagase, I., Urano, S., Kawabata, S., Tokuda, H., Kuzuhara, M., Nakamura, Y., et al. (2021) · Applied Physics Express · doi:10.35848/1882-0786/abe19e · Cited by 17
Thermodynamically driven Al migration across ultrathin Ag layered electrodes without thermal loading
Zhao, G., Jeong, E., Lee, S., Bae, J.-S., Yu, S. M., Han, S. Z., Lee, G.-H., Choi, E., & Yun, J. (2022) · Applied Surface Science · doi:10.1016/j.apsusc.2022.152907 · Cited by 13
Understanding the role of engineered cluster evolution in enhancing Ag layer growth on oxides
Zhao, G., Tan, Y., Wang, B., Jeong, E., Zhang, L., Wang, T., Yu, H., Min, G., Han, S. Z., Sun, Y., et al. (2023) · Applied Surface Science · doi:10.1016/j.apsusc.2023.158745 · Cited by 10
Influence of Gas Annealing on Sensitivity of AlN/4H-SiC-Based Temperature Sensors
Jung, S.-W., Shin, M.-C., Schweitz, M. A., Oh, J., & Koo, S. (2021) · Materials · doi:10.3390/ma14030683 · Cited by 10
Prajapati, P., & Lodha, S. (2024) · Applied Physics Letters · doi:10.1063/5.0214589 · Cited by 9
Cheng, X., Haug, H., Sabatino, M. D., Zhu, J., & Marstein, E. S. (2016) · IEEE Journal of Photovoltaics · doi:10.1109/jphotov.2016.2581421 · Cited by 7
Kang, W. J., Ahn, C. H., Kim, K. S., Jung, S. H., Cho, S. W., Cho, H. K., & Kim, Y. (2018) · Journal of Alloys and Compounds · doi:10.1016/j.jallcom.2018.02.028 · Cited by 7
Yatabe, Z., Nishiyama, K., Tsuda, T., & Nakamura, Y. (2019) · Journal of the Ceramic Society of Japan · doi:10.2109/jcersj2.19017 · Cited by 7
Passivation Characteristics of New Silicon Oxide
Gong, L., Zhou, C., Zhu, J., & Wang, W. (2019) · IEEE Journal of Photovoltaics · doi:10.1109/jphotov.2019.2929445 · Cited by 6
Self-citationKumar, A., Devi, M., Tomer, S., Dutta, M., Prathap, P., & Vandana, V. (2024) · Surfaces and Interfaces · doi:10.1016/j.surfin.2024.104127 · Cited by 5
Double Layers of Ultrathin a-Si:H and SiNx for Surface Passivation of n-type Crystalline Si Wafers
Cheng, X., Marstein, E. S., Haug, H., & Sabatino, M. D. (2016) · Energy Procedia · doi:10.1016/j.egypro.2016.07.094 · Cited by 4
Chaiworn, P., Pramukkul, P., Pluengphon, P., Wongrat, E., Raksa, P., Nedkun, P., & Tubtimtae, A. (2026) · Materials Chemistry and Physics · doi:10.1016/j.matchemphys.2026.132752 · Cited by 3
Kwon, Y. A., Kim, J., Won, D. Y., Park, S.-J., Yoo, Y., Kim, S., Kim, D., & Cho, J. H. (2026) · Advanced Functional Materials · doi:10.1002/adfm.202600078 · Cited by 2
Ultrathin nanocapacitor assembled via atomic layer deposition
Medina, J. A. L., Mejía-Salazar, J. R., Carvalho, W. O. F., López-Mercado, C. A., Nedev, N., Gómez, F. R., Oliveira, O. N., Farías, M. H., & Tiznado, H. (2024) · Nanotechnology · doi:10.1088/1361-6528/ad7f5c · Cited by 2
Atomic Layer Deposition of AlO x /SnO y Passivating Charge Transport Bilayer for Silicon Solar Cells
Mandol, B., Raitani, K., Chawla, S., Prajapat, P., Singha, A., Aggarwal, G., Lal, K., Nair, P. R., & Balasubramaniam, K. R. (2026) · Solar RRL · doi:10.1002/solr.70452
Metadata
- Authors
- Xiang, Y., Zhou, C., Jia, E., & Wang, W.
- Affiliations
- Chinese Academy of Sciences (CN)
- Corresponding author
- Zhou, Chunlan
- Venue
- Nanoscale Research Letters
- Published
- 2015-03-19
- Volume
- 10
- Issue
- 1
- Pages
- 137-137
- ISSN
- 1556-276X (ISSN-L)
- 1931-7573
- PMC
- PMC4385324
- OpenAlex
- W2068597222
- Cited by
- 18
- References
- 26
- Citations by year
- 2026: 3 · 2025: 1 · 2024: 3 · 2023: 1 · 2022: 1 · 2021: 2 · 2019: 3 · 2018: 1 · 2017: 1 · 2016: 2
- FWCI
- 0.64
- Type
- journal article
- Language
- en
- Open access
- gold
- doi.org
- Locations
- Nanoscale Research Letters (publishedVersion, cc-by)
- Europe PMC (PubMed Central) (publishedVersion, cc-by)
- PubMed Central (publishedVersion, cc-by)
- PubMed (publishedVersion)
- Topics
- Physical Sciences › Engineering › Electrical and Electronic Engineering › Silicon and Solar Cell Technologies
- Physical Sciences › Engineering › Electrical and Electronic Engineering › Semiconductor materials and devices
- Physical Sciences › Engineering › Electrical and Electronic Engineering › Thin-Film Transistor Technologies
- Keywords
- Al2O3 thin films, atomic layer deposition, surface passivation, interface trap density, silicon solar cells, plasma-enhanced ALD, thermal ALD, carrier lifetime, field-effect passivation, chemical passivation
About these checks
Registry, retraction, Cites and statistics results are computed, not judged, with one exception: a printed reference that no index lists is read once by a model before it counts as a citation error. Claims are extracted by a model and kept only when their quote appears verbatim in the text; each cited source is then checked, with a model’s help, for whether it says what the claim relies on. Those verdicts can be wrong — read the claim’s quote and the cited source before relying on one.
Statistics and arithmetic are recomputed, not judged.
Confidence bands are shown only for fields calibrated on our annotated test set. None is calibrated yet, so no band is shown.
What counts as a claim ›How we measure confidence ›How we check this ›
Are you an author, or do you see a problem with this page? Request a review
