

The DOI matches its Crossref record; 96 of the 97 references it cites were found in a registry or an index, and 1 are not checked yet.
Semantic and cognitive tools to aid statistical science: replace confidence and significance by compatibility and surprise
Open accessAbstract
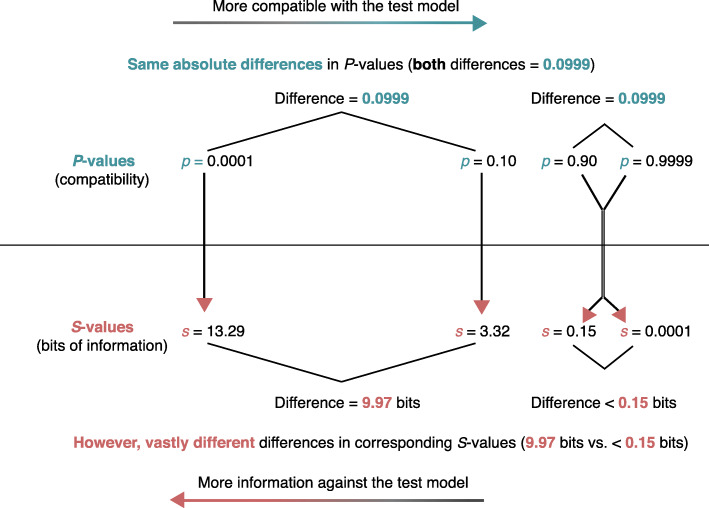
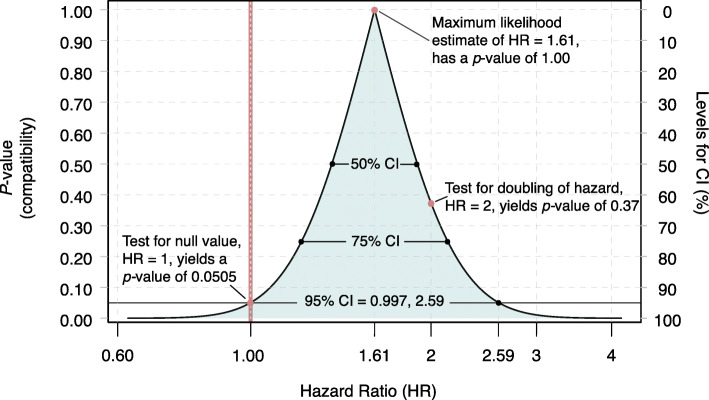
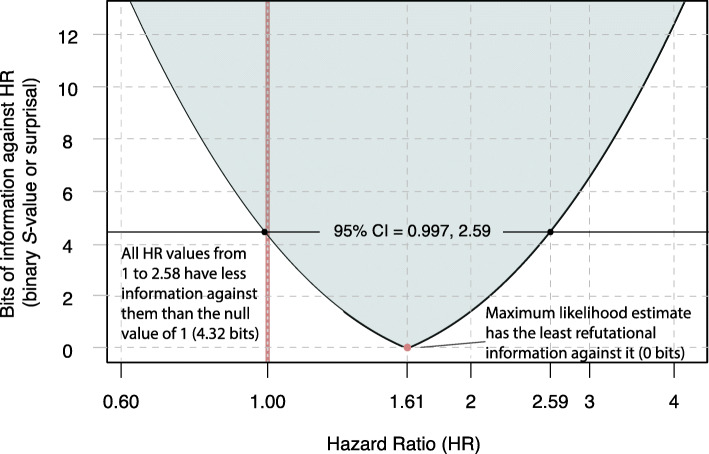
BACKGROUND: Researchers often misinterpret and misrepresent statistical outputs. This abuse has led to a large literature on modification or replacement of testing thresholds and P-values with confidence intervals, Bayes factors, and other devices. Because the core problems appear cognitive rather than statistical, we review some simple methods to aid researchers in interpreting statistical outputs. These methods emphasize logical and information concepts over probability, and thus may be more robust to common misinterpretations than are traditional descriptions. METHODS: (p), to provide a measure of the information supplied by the testing procedure, and to help calibrate intuitions against simple physical experiments like coin tossing. We also use tables or graphs of test statistics for alternative hypotheses, and interval estimates for different percentile levels, to thwart fallacies arising from arbitrary dichotomies. Finally, we reinterpret P-values and interval estimates in unconditional terms, which describe compatibility of data with the entire set of analysis assumptions. We illustrate these methods with a reanalysis of data from an existing record-based cohort study. CONCLUSIONS: In line with other recent recommendations, we advise that teaching materials and research reports discuss P-values as measures of compatibility rather than significance, compute P-values for alternative hypotheses whenever they are computed for null hypotheses, and interpret interval estimates as showing values of high compatibility with data, rather than regions of confidence. Our recommendations emphasize cognitive devices for displaying the compatibility of the observed data with various hypotheses of interest, rather than focusing on single hypothesis tests or interval estimates. We believe these simple reforms are well worth the minor effort they require.
Overview
The claims and statistics of this paper haven’t been checked yet.
Run the check — free, no account needed. It reads the open-access text and checks the sources it cites.
Integrity signals
Registry
Cites
Statistics
Figures
Verification
Claims the paper makes
The claims and statistics of this paper haven’t been checked yet.
Run the check — free, no account needed. It reads the open-access text and checks the sources it cites.
Claims other papers make about this one
Each is checked against this paper’s own text: does it say what the citing paper says it does?
The check wasn’t confident either way, so it gives no verdict — never disputed.
In the citing paper
“The 95 % CIs[13,14] calculated are therefore only approximate because we do not know which patients had multiple events.”
From Serious adverse events of special interest following mRNA COVID-19 vaccination in randomized trials in adults (2022) · cites this paper as [14]
Experimental — accuracy not yet measured
Self-check
Percentages, sums and reported differences re-computed from the paper’s own numbers.
The self-check needs the paper’s full text.
Citations
Cites
A Mathematical Theory of Communication
Shannon, C. E. (1948) · Bell System Technical Journal · doi:10.1002/j.1538-7305.1948.tb01338.x · Cited by 88,486
Tversky, A., & Kahneman, D. (1974) · Science · doi:10.1126/science.185.4157.1124 · Cited by 28,810 · cited 1×
“, see the anthologies of [76, 77]), with increasing attention to the harms of null-hypothesis significance testing (e.”
Judgment under Uncertainty: Heuristics and Biases
Tversky, A., & Kahneman, D. (1975) · Utility, Probability, and Human Decision Making · doi:10.1007/978-94-010-1834-0_8 · Cited by 22,650
Statistical Methods for Research Workers
Fisher, R. A. (1945) · American Journal of Clinical Pathology · doi:10.1093/ajcp/15.11.552b · Cited by 10,883
Measuring agreement in method comparison studies
Bland, J. M., & Altman, D. G. (1999) · Statistical Methods in Medical Research · doi:10.1177/096228029900800204 · Cited by 9,619
Estimating the reproducibility of psychological science
Open Science Collaboration (2015) · Science · doi:10.1126/science.aac4716 · Cited by 8,515
Simmons, J. P., Nelson, L. D., & Simonsohn, U. (2011) · Psychological Science · doi:10.1177/0956797611417632 · Cited by 6,567
Pearson, K. (1900) · The London Edinburgh and Dublin Philosophical Magazine and Journal of Science · doi:10.1080/14786440009463897 · Cited by 4,411
Heuristics and Biases: The Psychology of Intuitive Judgment
Bottom, W. P., Gilovich, T. D., Griffin, D., & Kahneman, D. J. (2004) · Academy of Management Review · doi:10.2307/20159081 · Cited by 3,583
Statistical tests, P values, confidence intervals, and power: a guide to misinterpretations
Greenland, S., Senn, S. J., Rothman, K. J., Carlin, J. B., Poole, C., Goodman, S. N., & Altman, D. G. (2016) · European Journal of Epidemiology · doi:10.1007/s10654-016-0149-3 · Cited by 3,200
Self-citation
Research works printed but not linked: 6
- Tyler RW. What is statistical significance? Educ Res Bull. 1931;10:115–42.
- Cole SR, Edwards JK, Greenland S. Surprise! Am J Epidemiol. 2020; doi: https://doi.org/10/gg63md.
- Stigler SM. Attempts to Revive the Binomial. In: The history of statistics: the measurement of uncertainty before 1900: Harvard University Press; 1986. https://books.google.com/books?id=M7yvkERHIIMC.
- Rothman KJ, Greenland S, Lash TL. Precision and statistics in epidemiologic studies. In: Rothman KJ, Greenland S, Lash TL, editors. Modern Epidemiology. 3rd edition: Lippincott Williams & Wilkins; 2008. p. 148–67. https://books.google.com/books/about/Modern_Epidemiology.html?id=Z3vjT9ALxHUC.
- Greenland S, Rothman KJ. Fundamentals of epidemiologic data analysis. In: Rothman KJ, Greenland S, Lash TL, editors. Modern Epidemiology. 3rd edition: Lippincott Williams & Wilkins; 2008. p. 213–37. https://books.google.com/books/about/Modern_Epidemiology.html?id=Z3vjT9ALxHUC.
- Cox DR, Hinkley DV. Chapter 3, pure significance tests. In: Theoretical Statistics: Chapman and Hall/CRC; 1974. p. 64–87. https://doi.org/10.1201/b14832. · DOI
Cited by
Sorted by citations
Mansournia, M. A., Collins, P. G. S., Nielsen, R. O., Nazemipour, M., Jewell, N. P., Altman, D. G., & Campbell, M. J. (2021) · British Journal of Sports Medicine · doi:10.1136/bjsports-2020-103652 · Cited by 268
Fraiman, J., Erviti, J., Jones, M., Greenland, S., Whelan, P., Kaplan, R. M., & Doshi, P. (2022) · Vaccine · doi:10.1016/j.vaccine.2022.08.036 · Cited by 228
“The 95 % CIs[13,14] calculated are therefore only approximate because we do not know which patients had multiple events.”
BackgroundSelf-citationPractical advice on variable selection and reporting using Akaike information criterion
Sutherland, C. S., Hare, D., Johnson, P. J., Linden, D. W., Montgomery, R. A., & Dröge, E. (2023) · Proceedings of the Royal Society B Biological Sciences · doi:10.1098/rspb.2023.1261 · Cited by 250
Miller, M. D., Steinmaus, C., Golub, M. S., Castorina, R., Thilakartne, R., Bradman, A., & Marty, M. A. (2022) · Environmental Health · doi:10.1186/s12940-022-00849-9 · Cited by 128
Exploring Equivalence Testing with the Updated TOSTER R PackagePreprint
Caldwell, A. R. (2022) · doi:10.31234/osf.io/ty8de · Cited by 148
Metadata
- Authors
- Rafi, Z., & Greenland, S.
- Affiliations
- NYU Langone Health (US)
- University of California, Los Angeles (US)
- Corresponding author
- Rafi, Zad
- Venue
- BMC Medical Research Methodology
- Published
- 2020-09-30
- Volume
- 20
- Issue
- 1
- Pages
- 244-244
- ISSN
- 1471-2288 (ISSN-L)
- PMC
- PMC7528258
- OpenAlex
- W2974063679
- Cited by
- 243
- References
- 97
- Citations by year
- 2026: 14 · 2025: 46 · 2024: 45 · 2023: 51 · 2022: 52 · 2021: 31 · 2020: 3
- FWCI
- 5.56
- Type
- journal article
- Language
- en
- Open access
- gold
- doi.org
- Locations
- BMC Medical Research Methodology (publishedVersion, cc-by)
- PubMed (publishedVersion)
- arXiv (Cornell University) (submittedVersion)
- DOAJ (DOAJ: Directory of Open Access Journals) (submittedVersion, cc-by-sa)
- arXiv (Cornell University)
- Zenodo (CERN European Organization for Nuclear Research) (cc-by)
- Topics
- Physical Sciences › Mathematics › Statistics and Probability › Statistical Methods in Epidemiology
- Physical Sciences › Mathematics › Statistics and Probability › Statistics Education and Methodologies
- Physical Sciences › Mathematics › Statistics and Probability › Statistical Methods and Bayesian Inference
- Keywords
- p-value interpretation, surprise, statistical misinterpretation, confidence intervals, Bayes factor, statistical reporting, cognitive tools, statistics education, hypothesis testing
- MeSH terms
- Bayes Theorem, Cognition, Humans, Probability, Semantics, Cohort Studies, Confidence Intervals
About these checks
Registry, retraction, Cites and statistics results are computed, not judged, with one exception: a printed reference that no index lists is read once by a model before it counts as a citation error. Claims are extracted by a model and kept only when their quote appears verbatim in the text; each cited source is then checked, with a model’s help, for whether it says what the claim relies on. Those verdicts can be wrong — read the claim’s quote and the cited source before relying on one.
Statistics and arithmetic are recomputed, not judged.
Confidence bands are shown only for fields calibrated on our annotated test set. None is calibrated yet, so no band is shown.
What counts as a claim ›How we measure confidence ›How we check this ›
Are you an author, or do you see a problem with this page? Request a review
