

The DOI matches its Crossref record; 37 of the 39 references it cites were found in a registry or an index.
SARS-CoV-2 vaccine effectiveness against infection, symptomatic and severe COVID-19: a systematic review and meta-analysis
Open accessAbstract
Background: The temporal evolution of SARS-CoV-2 vaccine efficacy and effectiveness (VE) against infection, symptomatic, and severe COVID-19 is incompletely defined. The temporal evolution of VE could be dependent on age, vaccine types, variants of the virus, and geographic region. We aimed to conduct a systematic review and meta-analysis of the duration of VE against SARS-CoV-2 infection, symptomatic COVID-19 and severe COVID-19. Methods: MEDLINE, Scopus, Cochrane Central Register of Controlled Trials, Cochrane Database of Systematic Reviews, the World Health Organization Global Literature on Coronavirus Disease, and CoronaCentral databases were searched and studies were selected. Independent reviewers selected randomized controlled trials and cohort studies with the outcome of interest. Independent reviewers extracted data, and assessed the risk of bias. Meta-analysis was performed with the DerSimonian-Laird random-effects model with Hartung-Knapp-Sidik-Jonkman variance correction. The GRADE (Grading of Recommendations, Assessment, Development and Evaluation) approach was used to assess certainty (quality) of the evidence. Primary outcomes included VE as a function of time against SARS-CoV-2 infection, symptomatic and severe COVID-19. Results: Eighteen studies were included representing nearly 7 million individuals. VE against all SARS-CoV-2 infections declined from 83% in the first month after completion of the original vaccination series to 22% at 5 months or longer. Similarly, VE against symptomatic COVID-19 declined from 94% in the first month after vaccination to 64% by the fourth month. VE against severe COVID-19 for all ages was high overall, with the level being 90% (95% CI, 87–92%) at five months or longer after being fully vaccinated. VE against severe COVID-19 was lower in individuals ≥ 65 years and those who received Ad26.COV2.S. Conclusions: VE against SARS-CoV-2 infection and symptomatic COVID-19 waned over time but protection remained high against severe COVID-19. These data can be used to inform public health decisions around the need for booster vaccination.
Overview
The claims and statistics of this paper haven’t been checked yet.
Run the check — free, no account needed. It reads the open-access text and checks the sources it cites.
Integrity signals
Registry
Cites
Statistics
Figures
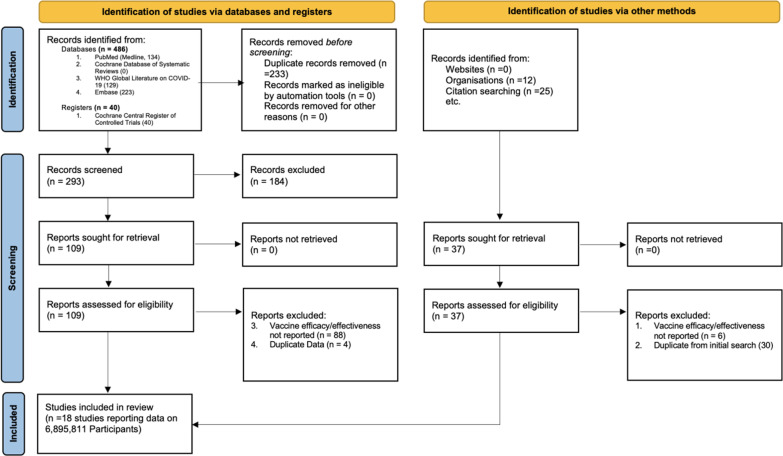
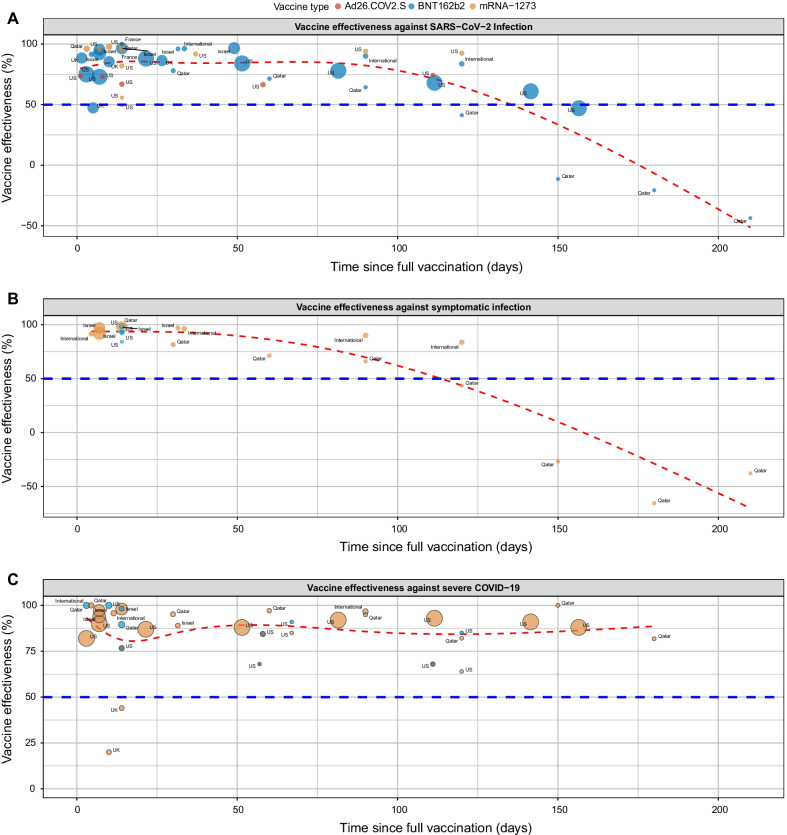
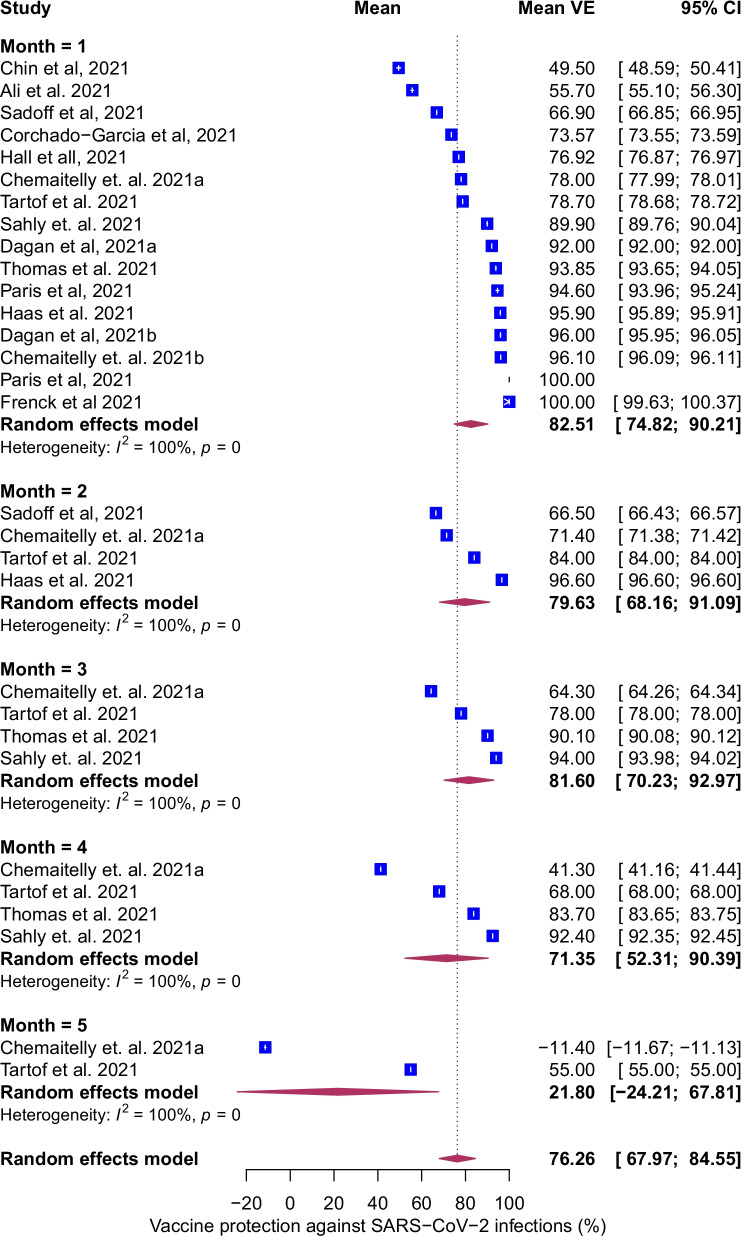
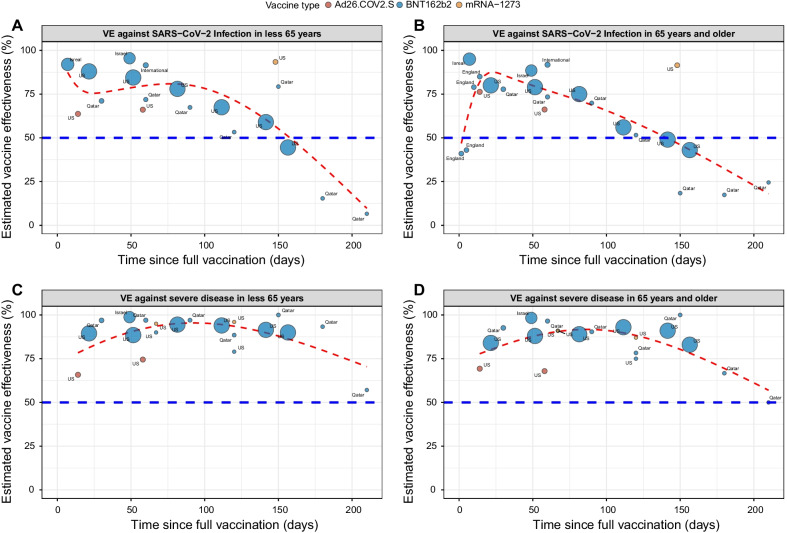
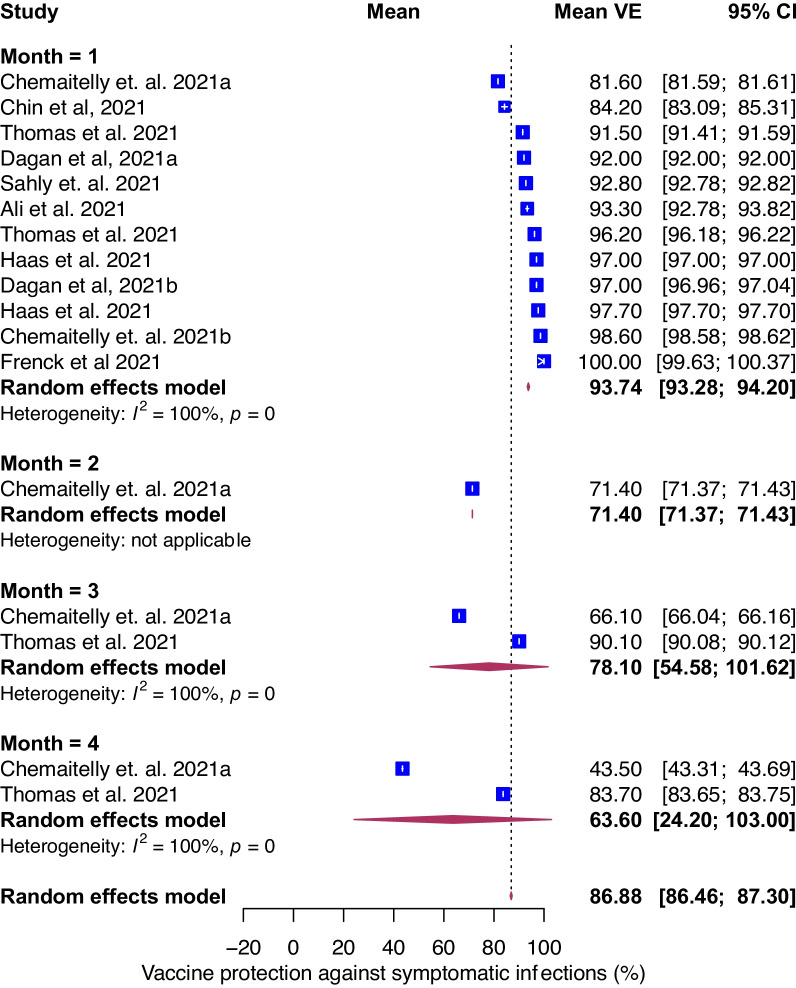
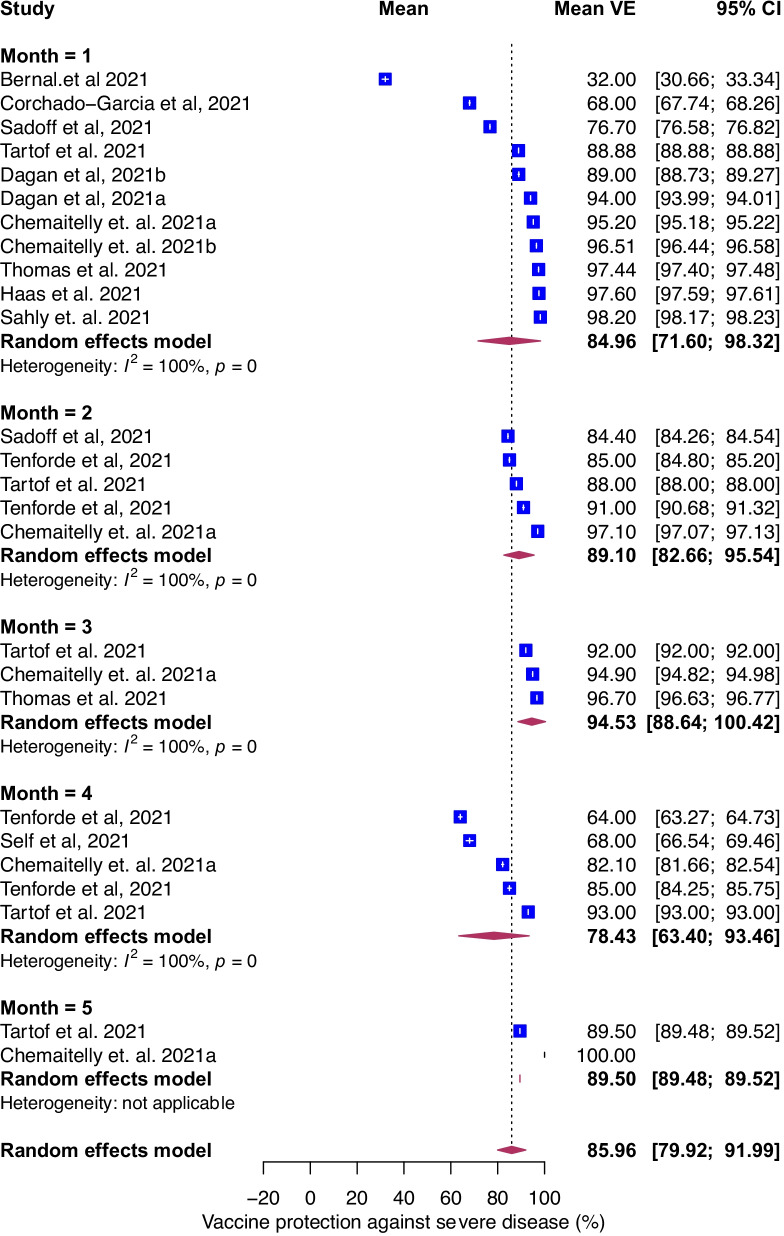
Verification
Claims the paper makes
The claims and statistics of this paper haven’t been checked yet.
Run the check — free, no account needed. It reads the open-access text and checks the sources it cites.
Claims other papers make about this one
Each is checked against this paper’s own text: does it say what the citing paper says it does?
The cited source says what the claim attributes to it.
In the citing paper
“however, none have assessed the magnitude and duration of protection conferred by booster doses of mRNA vaccines, particularly for the fourth dose, for a comprehensive range of COVID-19 outcomes caused by the Omicron subvariant and its sublineages.”
From Protection of the third-dose and fourth-dose mRNA vaccines against SARS-CoV-2 Omicron subvariant: a systematic review and meta-analysis (2023) · cites this paper as [17]
Experimental — accuracy not yet measuredThe cited source says what the claim attributes to it.
In the citing paper
“Several systematic reviews of COVID-19 vaccine efficacy and effectiveness, with or without meta-analyses, have been published11 17–22”
From Protection of the third-dose and fourth-dose mRNA vaccines against SARS-CoV-2 Omicron subvariant: a systematic review and meta-analysis (2023) · cites this paper as [17]
Self-check
Percentages, sums and reported differences re-computed from the paper’s own numbers.
The self-check needs the paper’s full text.
Citations
Cites
The PRISMA 2020 statement: An updated guideline for reporting systematic reviews
Page, M. J., McKenzie, J. E., Bossuyt, P. M., Boutron, I., Hoffmann, T. C., Mulrow, C. D., Shamseer, L., Tetzlaff, J. M., Akl, E. A., Brennan, S. E., et al. (2021) · BMJ · doi:10.1136/bmj.n71 · Cited by 108,283
Measuring inconsistency in meta-analyses
Higgins, J. P. T., Thompson, S. G., Deeks, J. J., & Altman, D. G. (2003) · BMJ · doi:10.1136/bmj.327.7414.557 · Cited by 63,139
Bias in meta-analysis detected by a simple, graphical test
Egger, M., Smith, G. D., Schneider, M., & Minder, C. (1997) · BMJ · doi:10.1136/bmj.315.7109.629 · Cited by 56,722
GRADE: an emerging consensus on rating quality of evidence and strength of recommendations
Guyatt, G. H., Oxman, A. D., Vist, G. E., Kunz, R., Falck-Ytter, Y., Alonso-Coello, P., & Schünemann, H. J. (2008) · BMJ · doi:10.1136/bmj.39489.470347.ad · Cited by 23,305 · cited 1×
“Grading the quality of evidence We assessed the quality of evidence using the GRADE (Grading of Recommendations, Assessment, Development and Evaluations) framework using four levels of quality of evidence: very low, low, moderate and high [10].”
MethodOperating characteristics of a rank correlation test for publication bias
Begg, C. B., & Mazumdar, M. (1994) · Biometrics · doi:10.2307/2533446 · Cited by 16,955
Safety and Efficacy of the BNT162b2 mRNA Covid-19 Vaccine
Polack, F. P., Thomas, S. J., Kitchin, N., Absalon, J., Gurtman, A., Lockhart, S., Perez, J. L., Pérez Marc, G., Moreira, E. D., Zerbini, C., et al. (2020) · New England Journal of Medicine · doi:10.1056/nejmoa2034577 · Cited by 14,592 · cited 1×
“In the United States (US), SARS-CoV-2 vaccines include two messenger RNA vaccines (mRNA) BNT162b2 [2] and mRNA-1273 [3] and one adenovirus vector vaccine (Ad26.”
BackgroundEfficacy and Safety of the mRNA-1273 SARS-CoV-2 Vaccine
Baden, L. R., El Sahly, H. M., Essink, B., Kotloff, K., Frey, S., Novak, R., Diemert, D., Spector, S. A., Rouphael, N., Creech, C. B., et al. (2021) · New England Journal of Medicine · doi:10.1056/nejmoa2035389 · Cited by 10,119
Assessing Risk of Bias in Included Studies
Higgins, J. P., & Altman, D. G. (2008) · Cochrane Handbook for Systematic Reviews of Interventions · doi:10.1002/9780470712184.ch8 · Cited by 3,396
Methley, A. M., Campbell, S., Chew-Graham, C., McNally, R., & Cheraghi-Sohi, S. (2014) · BMC Health Services Research · doi:10.1186/s12913-014-0579-0 · Cited by 2,706
BNT162b2 mRNA Covid-19 Vaccine in a Nationwide Mass Vaccination Setting
Dagan, N., Barda, N., Kepten, E., Miron, O., Perchik, S., Katz, M. A., Hernán, M. A., Lipsitch, M., Reis, B., & Balicer, R. D. (2021) · New England Journal of Medicine · doi:10.1056/nejmoa2101765 · Cited by 2,527
Research works printed but not linked: 5
- Wells GA, Shea B, O’Connell D, Peterson J, Welch V, Losos M, Tugwell P. The Newcastle-Ottawa Scale (NOS) for assessing the quality of nonrandomised studies in meta-analyses. In.: Oxford; 2000.
- Corchado-Garcia J, Hughes T, Cristea-Platon T, Lenehan P, Pawlowski C, Bade S, O'Horo JC, Gores GJ, Williams AW, Badley AD. Real-world effectiveness of Ad26. COV2. S adenoviral vector vaccine for COVID-19. 2021. · DOI
- Patalon T, Gazit S, Pitzer VE, Prunas O, Warren JL, Weinberger DM. Short term reduction in the odds of testing positive for SARS-CoV-2; a comparison between two doses and three doses of the BNT162b2 vaccine. medRxiv. 2021;384:403.
- Andrews N, Stowe J, Kirsebom F, Gower C, Ramsay M, Bernal JL. Effectiveness of BNT162b2 (Comirnaty, Pfizer-BioNTech) COVID-19 booster vaccine against covid-19 related symptoms in England: test negative case-control study. Medrxiv. 2021;397:1646.
- Andrews N, Stowe J, Kirsebom F, Toffa S, Rickeard T, Gallagher E, Gower C, Kall M, Groves N, O’Connell A-M. COVID-19 vaccine effectiveness against the omicron (B. 1.1. 529) variant. New Engl J Med. 2022;386:1532. · DOI · Paper page
Cited by
Sorted by citations
A multinational Delphi consensus to end the COVID-19 public health threat
Lazarus, J. V., Romero, D., Kopka, C. J., Karim, S. A., Abu-Raddad, L. J., Almeida, G., Baptista-Leite, R., Barocas, J. A., Barreto, M. L., Bar-Yam, Y., et al. (2022) · Nature · doi:10.1038/s41586-022-05398-2 · Cited by 226
Gao, P., Liu, J., & Liu, M. (2022) · International Journal of Environmental Research and Public Health · doi:10.3390/ijerph191912422 · Cited by 205
Relan, P., Motaze, N. V., Kothari, K. U., Askie, L. M., de Waroux, O. L. P., Kerkhove, M. D. V., Diaz, J. V., & Vijayaraghavan, B. K. T. (2023) · BMJ Global Health · doi:10.1136/bmjgh-2023-012328 · Cited by 121
Durability of Vaccine-Induced and Natural Immunity Against COVID-19: A Narrative Review
Pooley, N., Karim, S. S. A., Combadière, B., Ooi, E. E., Harris, R. C., Guerche‐Séblain, C. E., Kisomi, M., & Shaikh, N. (2023) · Infectious Diseases and Therapy · doi:10.1007/s40121-022-00753-2 · Cited by 95
Myocarditis in SARS-CoV-2 infection vs. COVID-19 vaccination: A systematic review and meta-analysis
Voleti, N., Reddy, S. P., & Ssentongo, P. (2022) · Frontiers in Cardiovascular Medicine · doi:10.3389/fcvm.2022.951314 · Cited by 98
Self-citation
Metadata
- Authors
- Ssentongo, P., Ssentongo, A. E., Voleti, N., Groff, D., Sun, A., Ba, D. M., Nunez, J., Parent, L. J., Chinchilli, V. M., & Paules, C. I.
- Affiliations
- Pennsylvania State University (US)
- Corresponding author
- Ssentongo, Paddy
- ORCID
- Venue
- BMC Infectious Diseases
- Published
- 2022-05-07
- Volume
- 22
- Issue
- 1
- Pages
- 439-439
- ISSN
- 1471-2334 (ISSN-L)
- PMC
- PMC9077344
- OpenAlex
- W4229081322
- Cited by
- 260
- References
- 39
- Citations by year
- 2026: 18 · 2025: 36 · 2024: 66 · 2023: 98 · 2022: 42
- FWCI
- 9.31
- Type
- journal article
- Language
- en
- Open access
- gold
- doi.org
- Locations
- BMC Infectious Diseases (publishedVersion, cc-by)
- PubMed Central (publishedVersion, cc-by)
- PubMed (publishedVersion)
- DOAJ (DOAJ: Directory of Open Access Journals) (submittedVersion, cc-by-sa)
- Topics
- Health Sciences › Medicine › Infectious Diseases › SARS-CoV-2 and COVID-19 Research
- Health Sciences › Medicine › Infectious Diseases › COVID-19 Clinical Research Studies
- Physical Sciences › Mathematics › Modeling and Simulation › COVID-19 epidemiological studies
- Keywords
- SARS-CoV-2, COVID-19 vaccines, vaccine effectiveness, waning immunity, duration of protection, symptomatic COVID-19, severe COVID-19, Ad26.COV2-S, booster vaccination, older adults
- MeSH terms
- COVID-19, SARS-CoV-2, COVID-19 Vaccines, Vaccine Efficacy, Ad26COVS1, Child, Humans
About these checks
Registry, retraction, Cites and statistics results are computed, not judged, with one exception: a printed reference that no index lists is read once by a model before it counts as a citation error. Claims are extracted by a model and kept only when their quote appears verbatim in the text; each cited source is then checked, with a model’s help, for whether it says what the claim relies on. Those verdicts can be wrong — read the claim’s quote and the cited source before relying on one.
Statistics and arithmetic are recomputed, not judged.
Confidence bands are shown only for fields calibrated on our annotated test set. None is calibrated yet, so no band is shown.
What counts as a claim ›How we measure confidence ›How we check this ›
Are you an author, or do you see a problem with this page? Request a review
