

The DOI matches its Crossref record; 91 of the 94 references it cites were found in a registry or an index.
Quality of life and mortality in the general population: a systematic review and meta-analysis
Open accessPublished version of a preprint
Abstract
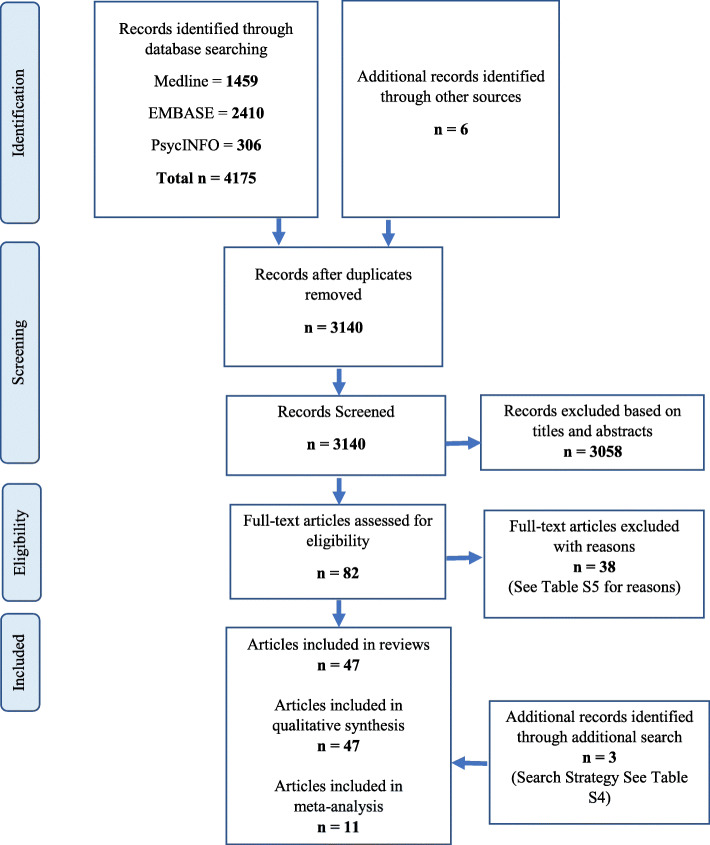
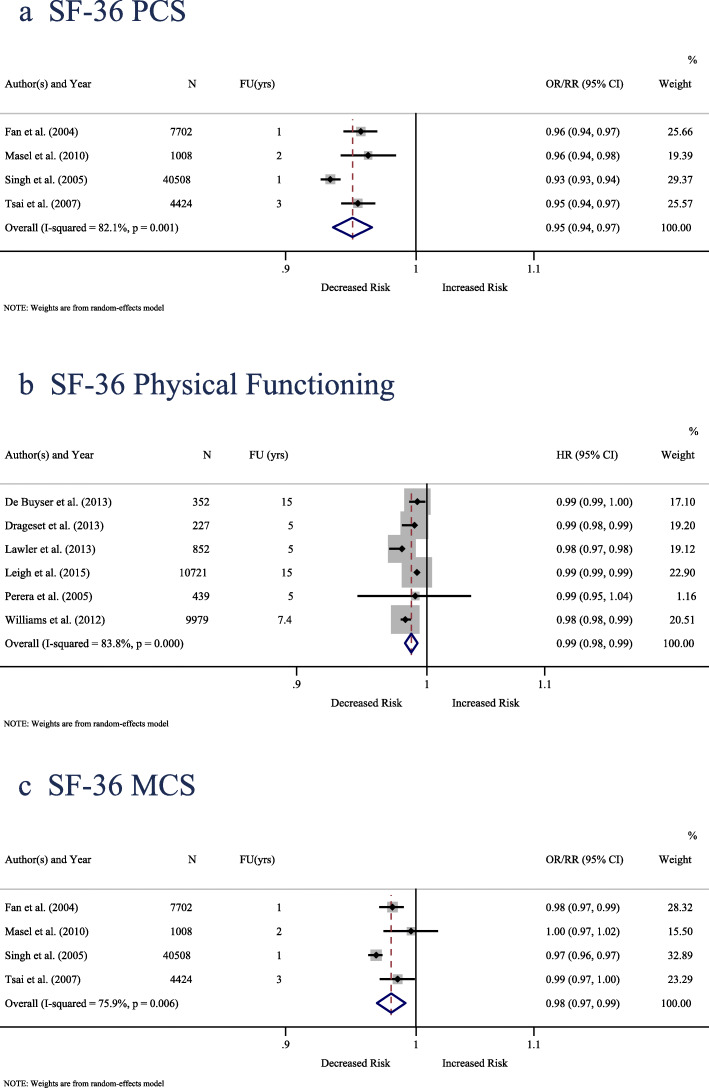
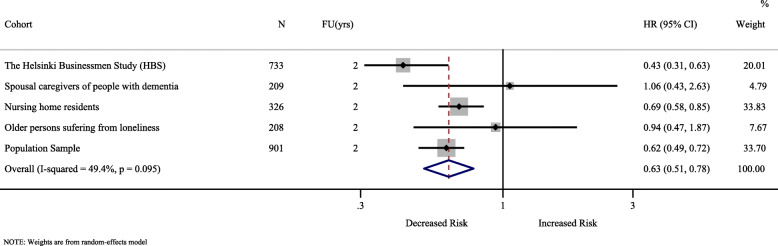
BACKGROUND: Quality of life (QoL) is multi-dimensional concept of an individual' general well-being status in relation to their value, environment, cultural and social context in which they live. This study aimed to quantitatively synthesise available evidence on the association between QoL and mortality in the general population. METHODS: An electronic search was conducted using three bibliographic databases, MEDLINE, EMBASE and PsycINFO. Inclusion criteria were studies that assessed QoL using standardized tools and examined mortality risk in a non-patient population. Qualitative data synthesis and meta-analyses using a random-effects model were performed. RESULTS: Of 4184 articles identified, 47 were eligible for inclusion, involving approximately 1,200,000 participants. Studies were highly heterogeneous in terms of QoL measures, population characteristics and data analysis. In total, 43 studies (91.5%) reported that better QoL was associated with lower mortality risk. The results of four meta-analyses indicated that higher health-related QoL (HRQoL) is associated with lower mortality risk, which was consistent for overall HRQoL (HR 0.633, 95% CI: 0.514 to 0.780), physical function (HR 0.987, 95% CI: 0.982 to 0.992), physical component score (OR 0.950, 95% CI: 0.935 to 0.965), and mental component score (OR 0.980, 95% CI: 0.969 to 0.992). CONCLUSION: These findings provide evidence that better QoL/HRQoL was associated with lower mortality risk. The utility of these measures in predicting mortality risk indicates that they should be considered further as potential screening tools in general clinical practice, beyond the traditional objective measures such as body mass index and the results of laboratory tests.
Overview
The claims and statistics of this paper haven’t been checked yet.
Run the check — free, no account needed. It reads the open-access text and checks the sources it cites.
Integrity signals
Registry
Cites
Statistics
Figures
Verification
Claims the paper makes
The claims and statistics of this paper haven’t been checked yet.
Run the check — free, no account needed. It reads the open-access text and checks the sources it cites.
Claims other papers make about this one
Each is checked against this paper’s own text: does it say what the citing paper says it does?
The source backs part of the claim, not all of it — or backs it for a different population, condition or comparison.
In the citing paper
“While the SF‐36v2 provides participants' subjective responses, these measures are relevant, as they have been shown to predict long‐term mortality risk.”
From Body composition changes during weight reduction with tirzepatide in the SURMOUNT ‐1 study of adults with obesity or overweight (2025) · cites this paper as [20]
Experimental — accuracy not yet measured
Self-check
Percentages, sums and reported differences re-computed from the paper’s own numbers.
The self-check needs the paper’s full text.
Citations
Cites
Liberati, A., Altman, D. G., Tetzlaff, J., Mulrow, C., Gotzsche, P. C., Ioannidis, J. P. A., Clarke, M., Devereaux, P. J., Kleijnen, J., & Moher, D. (2009) · BMJ · doi:10.1136/bmj.b2700 · Cited by 17,648
Liberati, A., Altman, D. G., Tetzlaff, J., Mulrow, C., Gøtzsche, P. C., Ioannidis, J. P. A., Clarke, M., Devereaux, P. J., Kleijnen, J., & Moher, D. (2009) · Annals of Internal Medicine · doi:10.7326/0003-4819-151-4-200908180-00136 · Cited by 10,349
(1995) · Social Science & Medicine · doi:10.1016/0277-9536(95)00112-k · Cited by 7,643
Health, Health-Related Quality of Life, and Quality of Life: What is the Difference?
Karimi, M., & Brazier, J. (2016) · PharmacoEconomics · doi:10.1007/s40273-016-0389-9 · Cited by 1,646
Journal of the American Geriatrics Society
(1976) · Journal of the American Geriatrics Society · doi:10.1111/j.1532-5415.1976.tb03307.x · Cited by 1,309
Salomon, J. A., Wang, H., Freeman, M. K., Vos, T., Flaxman, A. D., Lopez, A. D., & Murray, C. J. (2012) · The Lancet · doi:10.1016/s0140-6736(12)61690-0 · Cited by 1,116
Ottawa Hospital Research Institute
Bouhassira, E. E. (2015) · Sage eBooks · doi:10.4135/9781483347660.n335 · Cited by 851
A Comparative Review of Generic Quality-of-Life Instruments
Coons, S. J., Rao, S. R., Keininger, D. L., & Hays, R. D. (2000) · PharmacoEconomics · doi:10.2165/00019053-200017010-00002 · Cited by 834
Multimorbidity and quality of life: Systematic literature review and meta-analysis
Makovski, T. T., Schmitz, S., Zeegers, M. P., Stranges, S., & van den Akker, M. (2019) · Ageing Research Reviews · doi:10.1016/j.arr.2019.04.005 · Cited by 722
Predicting Mortality and Healthcare Utilization with a Single Question
DeSalvo, K. B., Fan, V. S., McDonell, M. B., & Fihn, S. D. (2005) · Health Services Research · doi:10.1111/j.1475-6773.2005.00404.x · Cited by 677
Research works printed but not linked: 3
- World Health Organization. International Classification of Functioning, disability, and Health: Children and Youth Version: ICF-CY. Geneva: World Health Organization; 2007.
- Phyo. AZZ, Craig. H, Gonzalez-Chica. DA, Stocks. N, Freak-Poli. R, Ryan. J, et al. Quality of life as a predictor of mortality: a systematic review and meta-analysis PROSPERO 2019 CRD42019139994 [cited 2019 September 8,]. Available from: https://www.crd.york.ac.uk/prospero/display_record.php? ID=CRD42019139994. · DOI
- Covidence systematic review software, Veritas Health Innovation, Melbourne, Australia [cited 2019 June 10]. Available from: www.covidence.org .
Cited by
Sorted by citations
Sarcopenia and health‐related quality of life: A systematic review and meta‐analysis
Beaudart, C., Demonceau, C., Reginster, J., Locquet, M., Cesari, M., Cruz-Jentoft, A. J., & Bruyère, O. (2023) · Journal of Cachexia Sarcopenia and Muscle · doi:10.1002/jcsm.13243 · Cited by 265
Look, M., Dunn, J. P., Kushner, R. F., Cao, D., Harris, C., Gibble, T. H., Stefanski, A., & Griffin, R. (2025) · Diabetes, Obesity and Metabolism · doi:10.1111/dom.16275 · Cited by 181
Zangger, G., Bricca, A., Liaghat, B., Juhl, C. B., Mortensen, S. R., Andersen, R. M., Damsted, C., Hamborg, T. G., Ried-Larsen, M., Tang, L. H., et al. (2023) · Journal of Medical Internet Research · doi:10.2196/46439 · Cited by 116
Predictors and consequences of loneliness during the COVID-19 Pandemic
Rumas, R., Shamblaw, A. L., Jagtap, S., & Best, M. W. (2021) · Psychiatry Research · doi:10.1016/j.psychres.2021.113934 · Cited by 90
Veronese, N., Koyanagi, A., Cereda, E., Maggi, S., Barbagallo, M., Domínguez, L., & Smith, L. (2022) · European Geriatric Medicine · doi:10.1007/s41999-022-00627-3 · Cited by 68
Metadata
- Authors
- Phyo, A. Z. Z., Freak-Poli, R., Craig, H., Gasevic, D., Stocks, N. P., Gonzalez-Chica, D. A., & Ryan, J.
- Affiliations
- Monash University (AU)
- The University of Adelaide (AU)
- Inserm (FR)
- Corresponding author
- Ryan, Joanne
- Venue
- BMC Public Health
- Published
- 2020-11-06
- Volume
- 20
- Issue
- 1
- Pages
- 1596-1596
- ISSN
- 1471-2458 (ISSN-L)
- PMC
- PMC7646076
- OpenAlex
- W3097138102
- Cited by
- 243
- References
- 94
- Citations by year
- 2026: 26 · 2025: 68 · 2024: 58 · 2023: 41 · 2022: 29 · 2021: 18 · 2020: 1
- FWCI
- 3.49
- Type
- journal article
- Language
- en
- Open access
- gold
- doi.org
- Locations
- BMC Public Health (publishedVersion, cc-by)
- Research Square (acceptedVersion, cc-by)
- PubMed Central (publishedVersion, cc-by)
- PubMed (publishedVersion)
- EUR Research Repository (Erasmus University Rotterdam) (publishedVersion, other-oa)
- Cross Connect (Southern Cross University) (submittedVersion)
- Minerva Access (University of Melbourne) (submittedVersion, cc-by)
- Edinburgh Research Explorer (University of Edinburgh) (submittedVersion, cc-by)
- EUR Research Repository (Erasmus University Rotterdam) (submittedVersion, other-oa)
- RePub (Erasmus University Rotterdam) (submittedVersion, other-oa)
- Adelaide Research & Scholarship (AR&S) (University of Adelaide) (submittedVersion, cc-by)
- DOAJ (DOAJ: Directory of Open Access Journals) (submittedVersion, cc-by-sa)
- Figshare (cc-by)
- Funders
- Monash University (Monash International Tuition Scholarship and Monash Graduate Scholarship Student ID: 30072360)
- National Health and Medical Research Council (Dementia Research Leader Fellowship (APP1135727))
- Topics
- Social Sciences › Health › Health disparities and outcomes
- Social Sciences › Psychology › Clinical Psychology › Health and Well-being Studies
- Social Sciences › Economics, Econometrics and Finance › Economics and Econometrics › Health Systems, Economic Evaluations, Quality of Life
- Keywords
- quality of life, health-related quality of life, mortality risk, physical function, physical component summary, mental component score, mortality prediction, screening tool, general population
- MeSH terms
- Humans, Mass Screening, Quality of Life
About these checks
Registry, retraction, Cites and statistics results are computed, not judged, with one exception: a printed reference that no index lists is read once by a model before it counts as a citation error. Claims are extracted by a model and kept only when their quote appears verbatim in the text; each cited source is then checked, with a model’s help, for whether it says what the claim relies on. Those verdicts can be wrong — read the claim’s quote and the cited source before relying on one.
Statistics and arithmetic are recomputed, not judged.
Confidence bands are shown only for fields calibrated on our annotated test set. None is calibrated yet, so no band is shown.
What counts as a claim ›How we measure confidence ›How we check this ›
Are you an author, or do you see a problem with this page? Request a review
