

The DOI matches its Crossref record; 108 of the 111 references it cites were found in a registry or an index.
Meta-evaluation of meta-analysis: ten appraisal questions for biologists
Open accessAbstract
Meta-analysis is a statistical procedure for analyzing the combined data from different studies, and can be a major source of concise up-to-date information. The overall conclusions of a meta-analysis, however, depend heavily on the quality of the meta-analytic process, and an appropriate evaluation of the quality of meta-analysis (meta-evaluation) can be challenging. We outline ten questions biologists can ask to critically appraise a meta-analysis. These questions could also act as simple and accessible guidelines for the authors of meta-analyses. We focus on meta-analyses using non-human species, which we term 'biological' meta-analysis. Our ten questions are aimed at enabling a biologist to evaluate whether a biological meta-analysis embodies 'mega-enlightenment', a 'mega-mistake', or something in between.
Overview
The claims and statistics of this paper haven’t been checked yet.
Run the check — free, no account needed. It reads the open-access text and checks the sources it cites.
Integrity signals
Registry
Cites
Statistics
Figures
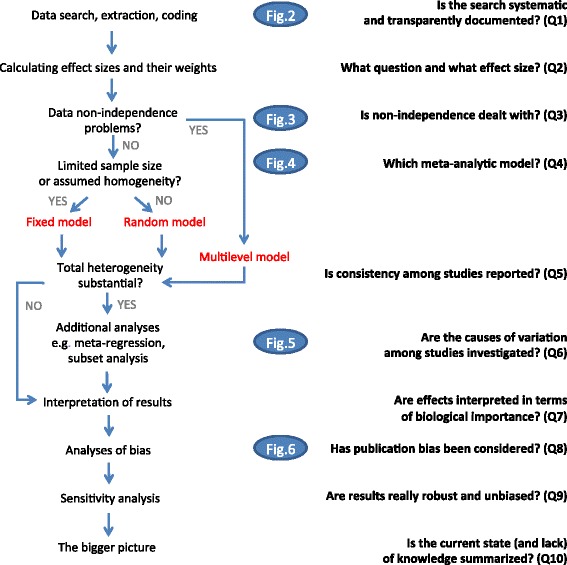
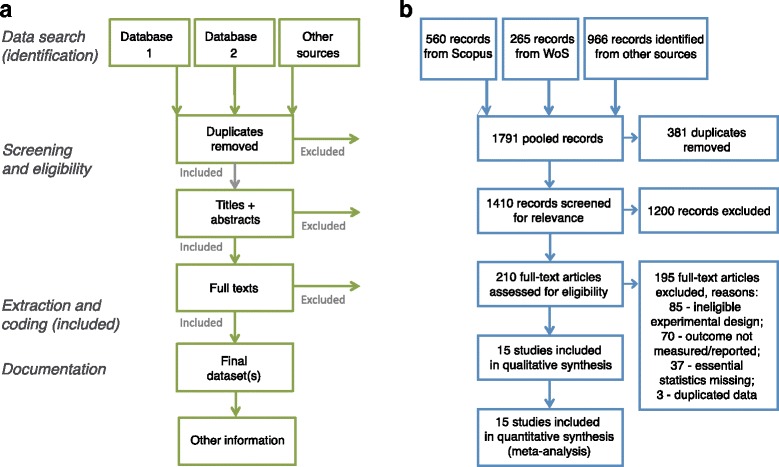
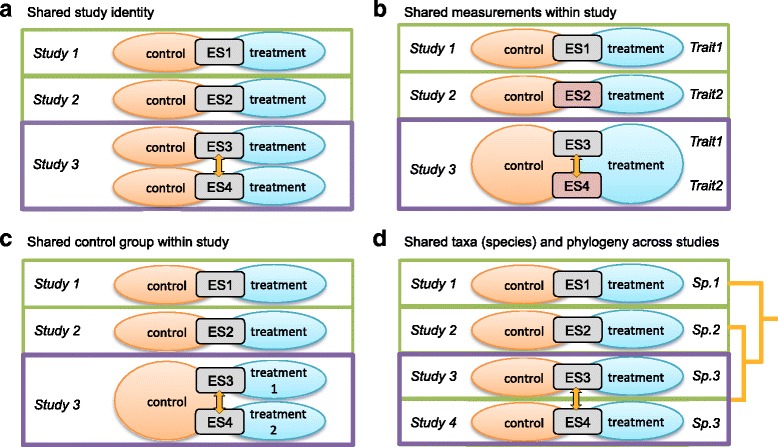
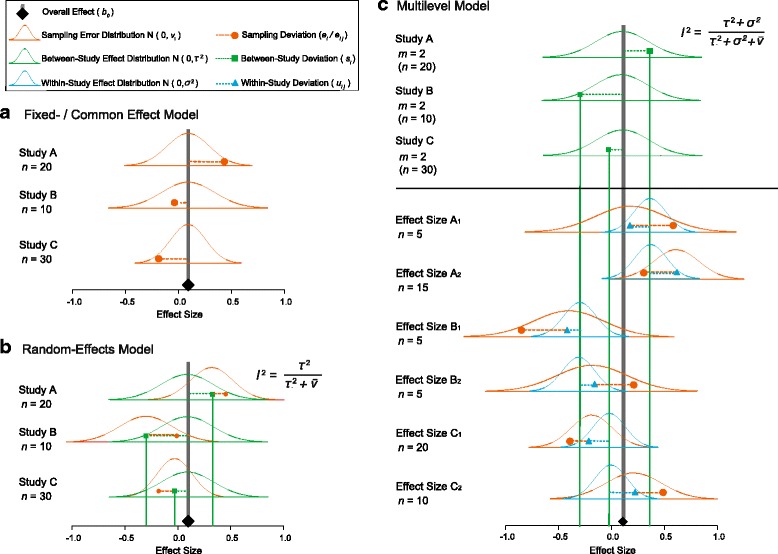
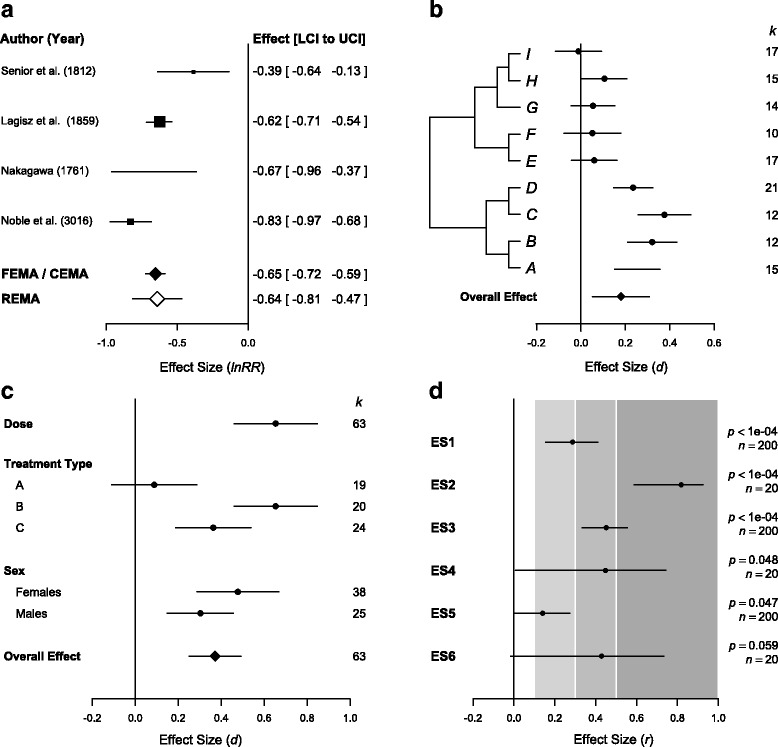
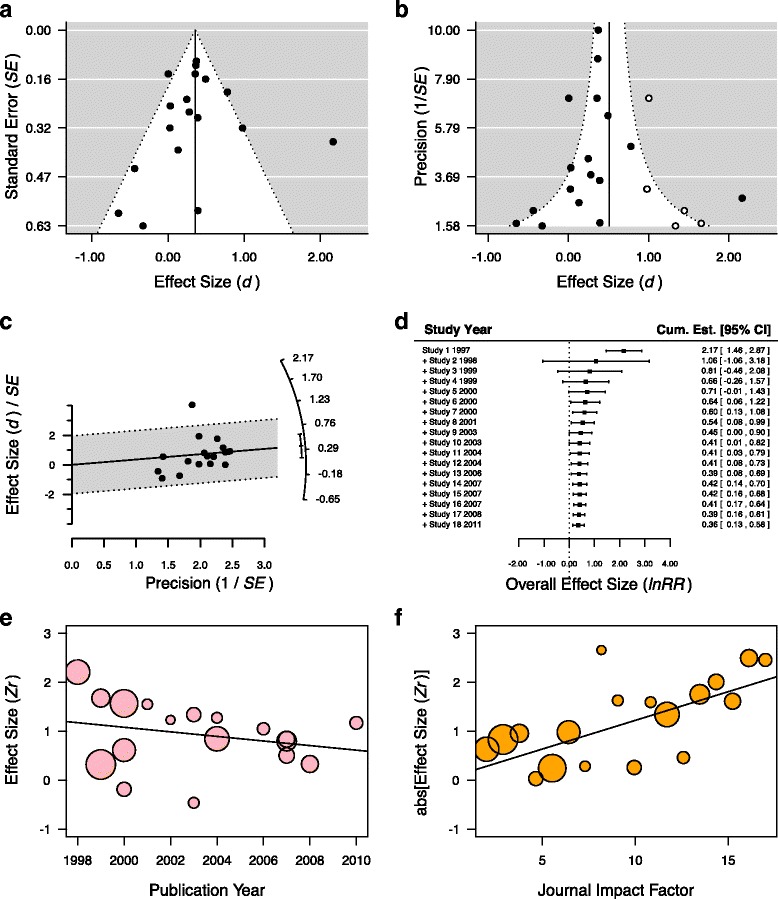
Verification
Claims the paper makes
The claims and statistics of this paper haven’t been checked yet.
Run the check — free, no account needed. It reads the open-access text and checks the sources it cites.
Claims other papers make about this one
Each is checked against this paper’s own text: does it say what the citing paper says it does?
The cited source says what the claim attributes to it.
In the citing paper
“This bias, known as publication bias, can be mitigated by gathering the most comprehensive database possible (Lortie et al., 2007; Nakagawa et al., 2017).”
From Acoustic indices as proxies for biodiversity: a meta‐analysis (2022) · cites this paper as Nakagawa et al., 2017
In the citing paper
“since poorly and inexpertly conducted meta-analyses can provide biased and misleading results (24, 32).”
From Agricultural diversification promotes multiple ecosystem services without compromising yield (2020) · cites this paper as [32]
In the citing paper
“While the number of published meta-analyses has continued to increase rapidly within and among disciplines, too many meta-analyses are of low quality 13-15 .”
From Meta-analysis and the science of research synthesis (2018) · cites this paper as [15]
Self-check
Percentages, sums and reported differences re-computed from the paper’s own numbers.
The self-check needs the paper’s full text.
Citations
Cites
Preferred Reporting Items for Systematic Reviews and Meta-Analyses: the PRISMA statement
Moher, D., Liberati, A., Tetzlaff, J., Altman, D. G., & for the PRISMA Group (2009) · BMJ · doi:10.1136/bmj.b2535 · Cited by 83,823
Measuring inconsistency in meta-analyses
Higgins, J. P. T., Thompson, S. G., Deeks, J. J., & Altman, D. G. (2003) · BMJ · doi:10.1136/bmj.327.7414.557 · Cited by 63,139
Bias in meta-analysis detected by a simple, graphical test
Egger, M., Smith, G. D., Schneider, M., & Minder, C. (1997) · BMJ · doi:10.1136/bmj.315.7109.629 · Cited by 56,722
Preferred reporting items for systematic reviews and meta-analyses: the PRISMA Statement.
(2009) · PubMed Central · Cited by 44,859
Preferred reporting items for systematic reviews and meta-analyses: The PRISMA statement
Moher, D., Liberati, A., Tetzlaff, J., Altman, D. G., & the PRISMA Group* (2009) · Annals of Internal Medicine · doi:10.7326/0003-4819-151-4-200908180-00135 · Cited by 37,554
Quantifying heterogeneity in a meta‐analysis
Higgins, J. P. T., & Thompson, S. G. (2002) · Statistics in Medicine · doi:10.1002/sim.1186 · Cited by 36,763
Liberati, A., Altman, D. G., Tetzlaff, J., Mulrow, C., Gøtzsche, P. C., Ioannidis, J. P. A., Clarke, M., Devereaux, P. J., Kleijnen, J., & Moher, D. (2009) · PLoS Medicine · doi:10.1371/journal.pmed.1000100 · Cited by 28,164
Cochrane Handbook for Systematic Reviews of Interventions: Cochrane Book Series
(2008) · doi:10.1002/9780470712184 · Cited by 25,048
Conducting Meta-Analyses in R with the metafor Package
Viechtbauer, W. (2010) · Journal of Statistical Software · doi:10.18637/jss.v036.i03 · Cited by 20,464
Borenstein, M., Hedges, L. V., Higgins, J. P. T., & Rothstein, H. R. (2009) · doi:10.1002/9780470743386 · Cited by 14,225
Research works printed but not linked: 10
- Hedges L, Olkin I. Statistical methods for meta-analysis. New York: Academic Press; 1985.
- Nakagawa S, Kubo T. Statistical models for meta-analysis in ecology and evolution (in Japanese). Proc Inst Stat Math. 2016;64(1):105–21.
- Borenstein M. Effect size for continuous data. In: Cooper H, Hedges LV, Valentine JC, editors. The handbook of research synthesis and meta-analysis. New York: Russell Sage Foundation; 2009. p. 221–35.
- Fleiss JL, Berlin JA. Effect sizes for dichotomous data. In: Cooper H, Hedges LV, Valentine JC, editors. The handbook of research synthesis and meta-analysis. New York: Russell Sage Foundation; 2009. p. 237–53.
- Rosenberg MS, Adams DC, Gurevitch J. MetaWin: statistical software for meta-analysis. 2nd ed. Sunderland: Sinauer; 2000.
- Lajeunesse MJ. Meta-analysis and the comparative phylogenetic method. Am Nat. 2009;174:369–81. · DOI
- Vetter D, Rucker G, Storch I. Meta-analysis: a need for well-defined usage in ecology and conservation biology. Ecosphere. 2013;4(6):1–24. · DOI
- Higgins JPT, Green S. Cochrane handbook for systematic reviews of interventions. West Sussex: Wiley-Blackwell; 2009.
- Cohen J. Statistical power analysis for the beahvioral sciences. 2nd ed. Hillsdale: Lawrence Erlbaum; 1988.
- Sutton AJ. Publication bias. In: Cooper H, Hedges L, Valentine J, editors. The handbook of research synthesis and meta-analysis. New York: Russell Sage Foundation; 2009. p. 435–52.
Cited by
Sorted by citations
Meta-analysis and the science of research synthesis
Gurevitch, J., Koricheva, J., Nakagawa, S., & Stewart, G. (2018) · Nature · doi:10.1038/nature25753 · Cited by 1,709
Self-citationAgricultural diversification promotes multiple ecosystem services without compromising yield
Tamburini, G., Bommarco, R., Wanger, T. C., Kremen, C., van der Heijden, M. G. A., Liebman, M., & Hallin, S. (2020) · Science Advances · doi:10.1126/sciadv.aba1715 · Cited by 1,110
O’Dea, R. E., Lagisz, M., Jennions, M. D., Koricheva, J., Noble, D. W. A., Parker, T. H., Gurevitch, J., Page, M. J., Stewart, G. B., Moher, D., et al. (2021) · Biological reviews/Biological reviews of the Cambridge Philosophical Society · doi:10.1111/brv.12721 · Cited by 825
Self-citationPositive but variable effects of crop diversification on biodiversity and ecosystem services
Beillouin, D., Ben‐Ari, T., Malézieux, E., Seufert, V., & Makowski, D. (2021) · Global Change Biology · doi:10.1111/gcb.15747 · Cited by 590
PD-L1 expression by dendritic cells is a key regulator of T-cell immunity in cancer
Oh, S. A., Wu, D.-C., Cheung, J., Navarro, A., Xiong, H., Cubas, R. A., Tótpál, K., Chiu, H. H., Wu, Y., Comps‐Agrar, L., et al. (2020) · Nature Cancer · doi:10.1038/s43018-020-0075-x · Cited by 466
Metadata
- Authors
- Nakagawa, S., Noble, D. W. A., Senior, A. M., & Lagisz, M.
- Affiliations
- Garvan Institute of Medical Research (AU)
- UNSW Sydney (AU)
- The University of Sydney (AU)
- Corresponding author
- Nakagawa, Shinichi
- Venue
- BMC Biology
- Published
- 2017-03-03
- Volume
- 15
- Issue
- 1
- Pages
- 18-18
- ISSN
- 1741-7007 (ISSN-L)
- PMC
- PMC5336618
- OpenAlex
- W2593372779
- Cited by
- 579
- References
- 111
- Citations by year
- 2026: 84 · 2025: 74 · 2024: 71 · 2023: 66 · 2022: 77 · 2021: 50 · 2020: 64 · 2019: 44 · 2018: 37 · 2017: 12
- FWCI
- 10.65
- Type
- journal article
- Language
- en
- Open access
- gold
- doi.org
- Licence
- cc-by
- Locations
- BMC Biology (publishedVersion, cc-by)
- PubMed Central (publishedVersion, cc-by)
- PubMed (publishedVersion)
- UNSWorks (University of New South Wales, Sydney, Australia) (submittedVersion, cc-by-nc-nd)
- Funders
- University of New South Wales
- University of Sydney
- Australian Research Council (DE150101774, FT130100268)
- Topics
- Social Sciences › Decision Sciences › Statistics, Probability and Uncertainty › Meta-analysis and systematic reviews
- Social Sciences › Library and Information Sciences › scientometrics and bibliometrics research
- Social Sciences › Psychology › Experimental and Cognitive Psychology › Psychology Research and Bibliometrics
- Keywords
- meta-evaluation, meta-analysis quality, critical appraisal, non-human species
- MeSH terms
- Documentation, Humans, Models, Theoretical, Publications, Meta-Analysis as Topic, Publication Bias, Knowledge
About these checks
Registry, retraction, Cites and statistics results are computed, not judged, with one exception: a printed reference that no index lists is read once by a model before it counts as a citation error. Claims are extracted by a model and kept only when their quote appears verbatim in the text; each cited source is then checked, with a model’s help, for whether it says what the claim relies on. Those verdicts can be wrong — read the claim’s quote and the cited source before relying on one.
Statistics and arithmetic are recomputed, not judged.
Confidence bands are shown only for fields calibrated on our annotated test set. None is calibrated yet, so no band is shown.
What counts as a claim ›How we measure confidence ›How we check this ›
Are you an author, or do you see a problem with this page? Request a review
