

The DOI matches its Crossref record; 87 of the 89 references it cites were found in a registry or an index; 54 of the 79 sources its claims cite were checked for support.
Single-cell transcriptome reveals the reprogramming of immune microenvironment during the transition from MASH to HCC
Open accessAbstract
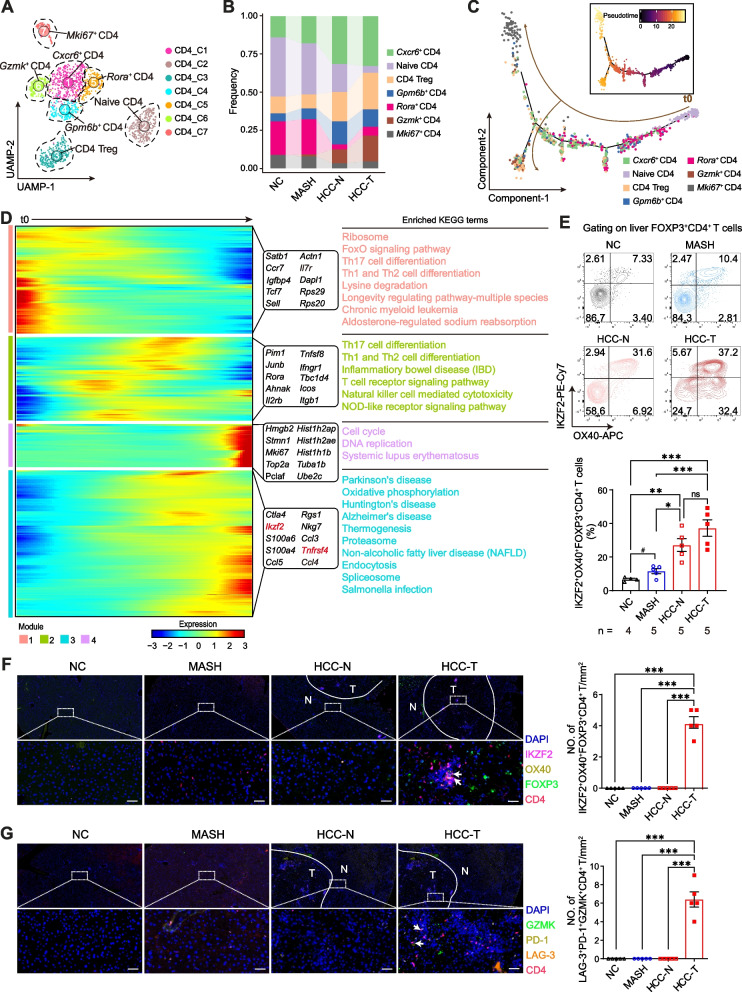
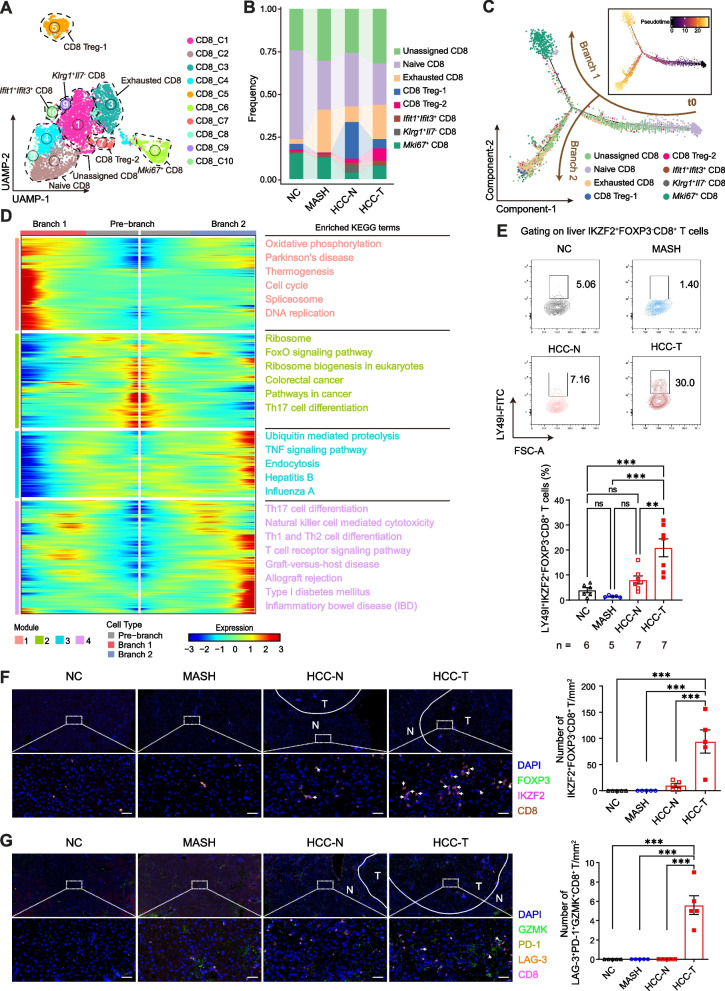
The immunological landscape of metabolic dysfunction-associated steatohepatitis (MASH)-driven hepatocellular carcinoma (HCC) is not well understood. Herein, we aim to delineate the immunological landscape in the MASH-to-HCC transition and to identify the critical genes that contribute to the pathogenesis of MASH-related HCC. A well-established MASH-driven HCC mouse model, STAM model, was first constructed. Thereafter, we applied single-cell RNA sequencing (scRNA-seq) analysis of CD45 + cells sorted from livers of mice with normal chow or MASH, as well as paired paracancerous and cancer tissues from mice with HCC. Flow cytometry and multiplexed immunohistochemistry were performed to validate the analysis results of scRNA-seq. Finally, STAM model was applied between apolipoprotein E (ApoE)-deficient mice and wild type controls. We identified 23 major clusters corresponding to nine populations among 31,822 cells. Obviously, immunosuppressive and exhausted CD4 + T (IKZF2 + OX40 + FOXP3 + CD4 + and GZMK + LAG-3 + PD-1 + CD4 + ), CD8 + T (LY49I + LY49G + IKZF2 + FOXP3 − CD8 + , IKZF2 + FOXP3 + CD8 + and GZMK + LAG-3 + PD-1 + CD8 + ) and γδ T cells (γδ Treg and exhausted γδ T cells) were induced in the MASH-to-HCC transition. As MASH-related HCC progressed, B cells matured and differentiated into immunosuppressive cells. Natural killer cells (NKs) were found to be strikingly reduced at HCC stage. Particularly, the activation of liver-infiltrated NK cells was inhibited, leading to attenuation of anti-tumor capacity in the MASH-to-HCC transition. Moreover, tumor-associated macrophages were increased in MASH-related HCC. Importantly, multiple immune cells highly expressed ApoE in HCC, and ablation of ApoE impeded MASH-driven hepatocarcinogenesis by disrupting both ApoE-PI3K-AKT-NF-κB and ApoE-PI3K-AKT-c-Jun/c-Fos signaling pathways. We illustrate the profound reprogramming of the liver immune microenvironment in the MASH-to-HCC transition and clarify the role of ApoE in MASH-driven HCC, implying that ApoE may serve as a potential therapeutic target for MASH-related HCC.
Overview
CoChat Summary
## TL;DR
This study used single-cell RNA sequencing of immune cells from a MASH-to-HCC mouse model to map how the liver immune microenvironment changes during hepatocarcinogenesis. The authors found increased exhausted/immunosuppressive T and B cells and tumor-associated macrophages, reduced activated NK cells, and identified ApoE as a potential driver and therapeutic target.
## Key findings
- scRNA-seq profiled 31,822 cells and identified 23 major clusters across 9 immune populations from normal chow, MASH, paracancerous HCC, and tumor tissues.
- During the MASH-to-HCC transition, the authors reported induction of immunosuppressive/exhausted CD4+ T cells, CD8+ T cells, and γδ T cells, including populations such as IKZF2+OX40+FOXP3+CD4+, GZMK+LAG-3+PD-1+CD4+, CD8 Treg-1, CD8 Treg-2, and GZMK+LAG-3+PD-1+CD8+.
- B cells were reported to mature toward immunosuppressive states, including IgA+ plasma cells and Gm31243hi B cells; NK cells were “strikingly reduced” at the HCC stage and activated NK-cell function was attenuated.
- Apoe was the only overlapping upregulated top-10 DEG across immune cell populations; ApoE ablation reduced HCC tumorigenesis in the STAM model and reduced tumor infiltration by macrophages, with reduced p-PI3K, p-AKT, NF-κB, c-Jun, and c-Fos signaling.
## Methods
- The study used a mouse STAM model of MASH-driven HCC and compared immune cells from normal chow (n = 5), MASH (n = 5), paracancerous HCC (n = 5), and tumor (n = 5) liver tissues; an ApoE-deficient vs wild-type comparison was also performed in the STAM model.
- CD45+ liver/tumor immune cells were sorted by flow cytometry and subjected to 10x Genomics scRNA-seq; the authors also performed whole-transcriptome sequencing, flow cytometry, IHC/mIHC, pseudotime analysis (Monocle2), GSVA, SCENIC, and CellChat.
- Main analyses included clustering and annotation in Seurat, trajectory inference, pathway enrichment, regulon analysis, cell-cell communication analysis, and differential expression testing.
## Limitations
- The paper states that further validation in MASH-related HCC patients and pharmacological validation of ApoE are needed for broader human application.
- The authors state that conditioned knockout of ApoE in specific immune cells was not investigated, so the cell-type-specific role of ApoE remains unresolved.
- The paper notes that human ApoE has different variants with opposite functions in MASH, so the exact translational target may differ by ApoE variant.
Model-written summary. Check it against the paper before relying on it.
Integrity signals
Registry
Cites
Statistics
Figures



Verification
Claims the paper makes
41 Valid · 1 Not valid · 13 Not checked · 155 Own results and interpretations
The cited sources support only part of this claim — read each source’s verdict below.
In the paper
“Of note, 36.6 ~ 50% of HCC in MASH patients develop without cirrhosis [7–9]”
§ Single-cell transcriptome reveals the reprogramming of immune microenvironment during the transition from MASH to HCC > Background
What the sources say
- Partly supportedcites [7] Tateishi R, Okanoue T, Fujiwara N, Okita K, Kiyosawa K, Omata M, et al. Clinical characteristics, treatment, and prognosis of non-B, non-C hepatocellular carcinoma: a large retrospective multicenter cohort study. J Gastroenterol. 2015;50:350–60. sourceExperimental — accuracy not yet measured
Table 1 (Results, Patient profiles; page not supplied) reports cirrhosis in 63.4% of patients with NAFLD-related HCC, implying 36.6% were non-cirrhotic. The paper does not report that percentage specifically for MASH patients or establish the upper end of the stated 36.6–50% range. (LLM, conf=0.90)
- Not checked — no full text of the sourcecites [8] Piscaglia F, Svegliati-Baroni G, Barchetti A, Pecorelli A, Marinelli S, Tiribelli C, et al. Clinical patterns of hepatocellular carcinoma in nonalcoholic fatty liver disease: A multicenter prospective study. Hepatology. 2016;63:827–38. source
- Partly supportedcites [9] Stine JG, Wentworth BJ, Zimmet A, Rinella ME, Loomba R, Caldwell SH, et al. Systematic review with meta-analysis: risk of hepatocellular carcinoma in non-alcoholic steatohepatitis without cirrhosis compared to other liver diseases. Aliment Pharmacol Ther. 2018;48:696–703. sourceExperimental — accuracy not yet measured
The Introduction states that NASH-associated HCC can develop without cirrhosis. The Results section on HCC in NASH patients without cirrhosis reports 38.0% as the prevalence of HCC among noncirrhotic NASH patients—not the percentage of NASH-associated HCC cases that arise without cirrhosis. It does not establish the claimed 36.6–50% range. (LLM, conf=0.88)
plain- Asserted: passes — The authors put it forward as true.
- Checkable: passes — It can be checked against evidence.
- Load-bearing: passes — The paper’s conclusions depend on it.
- Based: passes — The paper gives a reason why it holds.
- Partly supported
The sources with a verdict support this claim; the rest weren’t checked yet, have no full text we could read, or their verdicts aren’t rated yet.
In the paper
“Additionally, enriched pathways that were upregulated during the transition from MASH to HCC were similar to those altered in human HCC [44, 45] (Fig. S1E).”
§ Single-cell transcriptome reveals the reprogramming of immune microenvironment during the transition from MASH to HCC > Results > The hepatic immune cellular landscape in the MASH-to-HCC transition
What the sources say
- Not checked — no full text of the sourcecites [44] Totoki Y, Tatsuno K, Covington KR, Ueda H, Creighton CJ, Kato M, et al. Trans-ancestry mutational landscape of hepatocellular carcinoma genomes. Nat Genet. 2014;46:1267–73. source
- Supportedcites [45] Schulze K, Imbeaud S, Letouze E, Alexandrov LB, Calderaro J, Rebouissou S, et al. Exome sequencing of hepatocellular carcinomas identifies new mutational signatures and potential therapeutic targets. Nat Genet. 2015;47:505–11. source
The paper’s Abstract reports 11 pathways altered in human HCC, including WNT/β-catenin, PI3K/AKT/mTOR, and TP53/cell cycle. The citation supports the human-HCC pathway comparison; the MASH-to-HCC upregulation and similarity analysis are presented as the citing authors’ own findings (Fig. S1E). (LLM, conf=0.89)
plainstates an association- Asserted: passes — The authors put it forward as true.
- Checkable: passes — It can be checked against evidence.
- Load-bearing: unclear — It is unclear whether the paper’s conclusions depend on it.
- Based: passes — The paper gives a reason why it holds.
Every source the paper cites for this claim was checked and supports it.
In the paper
“Currently, there are no approved therapies for MASH [10]”
§ Single-cell transcriptome reveals the reprogramming of immune microenvironment during the transition from MASH to HCC > Background
What the sources say
- Supportedcites [10] Llovet JM, Willoughby CE, Singal AG, Greten TF, Heikenwalder M, El-Serag HB, et al. Nonalcoholic steatohepatitis-related hepatocellular carcinoma: pathogenesis and treatment. Nat Rev Gastroenterol Hepatol. 2023;20:487–503. source
In the Epidemiology > Pathogenesis section, the paper explicitly states that there are no approved therapies for NASH. MASH is the updated name for the condition referred to here as NASH. (LLM, conf=0.94)
plain- Asserted: passes — The authors put it forward as true.
- Checkable: passes — It can be checked against evidence.
- Load-bearing: unclear — It is unclear whether the paper’s conclusions depend on it.
- Based: passes — The paper gives a reason why it holds.
- Supported
The cited sources support only part of this claim — read each source’s verdict below.
In the paper
“Importantly, educated CD8+ T cells, such as CXCR6+PD-1+CD8+ T cells, are able to elicit auto-aggressive killing of liver cells, accelerating the MASH-to-HCC transition [16].”
§ Single-cell transcriptome reveals the reprogramming of immune microenvironment during the transition from MASH to HCC > Background
What the sources say
- Partly supportedcites [16] Dudek M, Pfister D, Donakonda S, Filpe P, Schneider A, Laschinger M, et al. Auto-aggressive CXCR6(+) CD8 T cells cause liver immune pathology in NASH. Nature. 2021;592:444–9. sourceExperimental — accuracy not yet measured
The title in our indexed copy identifies auto-aggressive CXCR6+ CD8 T cells as causing liver immune pathology in NASH. The retrieved passages do not establish that these cells are PD-1+, that they kill liver cells, or that they accelerate progression from MASH to HCC; searches for PD-1, hepatocyte killing, and hepatocellular carcinoma returned no supporting passage. (LLM, conf=0.76)
plainstates a cause- Asserted: passes — The authors put it forward as true.
- Checkable: passes — It can be checked against evidence.
- Load-bearing: unclear — It is unclear whether the paper’s conclusions depend on it.
- Based: passes — The paper gives a reason why it holds.
- Partly supported
The cited sources support only part of this claim — read each source’s verdict below.
In the paper
“Interestingly, CXCR6+PD-1+CD8+ T cells also accumulate in tumors that are unresponsive to anti–PD-1 therapy [17]”
§ Single-cell transcriptome reveals the reprogramming of immune microenvironment during the transition from MASH to HCC > Background
What the sources say
- Partly supportedcites [17] Pfister D, Nunez NG, Pinyol R, Govaere O, Pinter M, Szydlowska M, et al. NASH limits anti-tumour surveillance in immunotherapy-treated HCC. Nature. 2021;592:450–6. sourceExperimental — accuracy not yet measured
In “Hepatic CD8+PD1+ T cells increase in NASH” (page unavailable), the paper reports increased CD8+PD1+ T cells in liver tumours that did not regress after anti-PD1 treatment, alongside cells expressing Cxcr6 mRNA. “CD8+ T cells promote HCC in NASH” (page unavailable) identifies increased hepatic CD8+PD1+CXCR6+ cells, but does not establish that the triple-positive cells specifically accumulated within the nonresponsive tumours. The finding is also limited to NASH-associated HCC, rather than unresponsive tumours generally. (LLM, conf=0.84)
plainstates an association- Asserted: passes — The authors put it forward as true.
- Checkable: passes — It can be checked against evidence.
- Load-bearing: passes — The paper’s conclusions depend on it.
- Based: passes — The paper gives a reason why it holds.
- Partly supported
115 more claims · 9 with their cited sources checked
Create a free account to see all 210 claims and to verify the 9 references still open.
- Probably not a substantial claim. 33
- It may state two separate claims as one. 74
- Borderline: one of the tests for a substantial claim is unclear. 1
Self-check
Percentages, sums and reported differences re-computed from the paper’s own numbers.
Each contradiction between two passages listed here was confirmed by an independent check.
Rated minor: it would not touch a result — a value no result rests on, a p-value that stays on the same side of the significance level, or a conflict that is clerical, resolved elsewhere in the paper, or outside its own findings.
In the paper
§ Single-cell transcriptome reveals the reprogramming of immune microenvironment during the transition from MASH to HCC > Abstract > Results
“We identified 23 major clusters corresponding to nine populations among 31,822 cells.”
§ Single-cell transcriptome reveals the reprogramming of immune microenvironment during the transition from MASH to HCC > Results > The hepatic immune cellular landscape in the MASH-to-HCC transition
“A total of 31,882 cells (7,304 from NC; 8,494 from MASH; 7,702 from HCC-N; 8,382 from HCC-T) were obtained from the above-mentioned mice”
Citations
Cites
Subramanian, A., Tamayo, P., Mootha, V. K., Mukherjee, S., Ebert, B. L., Gillette, M. A., Paulovich, A., Pomeroy, S. L., Golub, T. R., Lander, E. S., et al. (2005) · Proceedings of the National Academy of Sciences · doi:10.1073/pnas.0506580102 · Cited by 53,625 · cited 1×
“Specially, gene set enrichment analysis (GSEA) [42, 43] was performed to identify the hallmark gene sets according to the instruction.”
Integrated analysis of multimodal single-cell data
Hao, Y., Hao, S., Andersen-Nissen, E., Mauck, W. M., Zheng, S., Butler, A., Lee, M. J., Wilk, A. J., Darby, C., Zagar, M., et al. (2020) · doi:10.1101/2020.10.12.335331 · Cited by 15,508
GSVA: gene set variation analysis for microarray and RNA-Seq data
Hänzelmann, S., Castelo, R., & Guinney, J. (2013) · BMC Bioinformatics · doi:10.1186/1471-2105-14-7 · Cited by 15,440
Mootha, V. K., Lindgren, C. M., Eriksson, K.-F., Subramanian, A., Sihag, S., Lehar, J., Puigserver, P., Carlsson, E., Ridderstråle, M., Laurila, E., et al. (2003) · Nature Genetics · doi:10.1038/ng1180 · Cited by 10,197
Trapnell, C., Cacchiarelli, D., Grimsby, J., Pokharel, P., Li, S., Morse, M., Lennon, N. J., Livak, K. J., Mikkelsen, T. S., & Rinn, J. L. (2014) · Nature Biotechnology · doi:10.1038/nbt.2859 · Cited by 7,314
Llovet, J. M., Kelley, R. K., Villanueva, A., Singal, A. G., Pikarsky, E., Roayaie, S., Lencioni, R., Koike, K., Zucman-Rossi, J., & Finn, R. S. (2021) · Nature Reviews Disease Primers · doi:10.1038/s41572-020-00240-3 · Cited by 7,055
Scenic: single-cell regulatory network inference and clustering.
Aibar, S., González-Blas, C. B., Moerman, T., Huynh-Thu, V. A., Imrichova, H., Hulselmans, G., Rambow, F., Marine, J.-C., Geurts, P., Aerts, J., et al. (2017) · Nature Methods · doi:10.1038/nmeth.4463 · Cited by 6,520
McGinnis, C. S., Murrow, L. M., & Gartner, Z. J. (2019) · Cell Systems · doi:10.1016/j.cels.2019.03.003 · Cited by 4,521
A multisociety Delphi consensus statement on new fatty liver disease nomenclature
Rinella, M. E., Lazarus, J. V., Ratziu, V., Francque, S. M., Sanyal, A. J., Kanwal, F., Romero, D., Abdelmalek, M. F., Anstee, Q. M., Arab, J. P., et al. (2023) · Journal of Hepatology · doi:10.1016/j.jhep.2023.06.003 · Cited by 3,100 · cited 2×
“MASLD affects a quarter of the global population, with approximately 20% of cases develop to a severe subtype called metabolic dysfunction-associated steato-hepatitis (MASH) [3], formerly known as non-alcoholic steatohepatitis (NASH).”
Global epidemiology of NAFLD-related HCC: trends, predictions, risk factors and prevention
Huang, D. Q., El-Serag, H. B., & Loomba, R. (2021) · Nature Reviews Gastroenterology & Hepatology · doi:10.1038/s41575-020-00381-6 · Cited by 1,855
Cited by
Gao, D., Kan, P., He, Y., Sun, S., Tang, L., & Yang, F. (2025) · Frontiers in Immunology · doi:10.3389/fimmu.2025.1656733 · Cited by 26
Dong, H., #, M. S., Tao, Z., Wang, Z., Gao, Z., Qiu, W., & Peng, M. (2026) · Biomaterials Science · doi:10.1039/d5bm01798j · Cited by 5
Targeting Inflammation and Immune Regulation in Chronic Inflammation Associated Cancers
Rabiu, L., Chinn, M., Chen, F., Yerkinkazhina, Y., Tian, Y., & Zhu, W. (2026) · Cancer Science · doi:10.1111/cas.70360 · Cited by 9
Chen, Y., Yu, H., Kai, X., Yin, R., Ouyang, Z., Wei, Y., & Zhang, C. (2026) · Biochemical Pharmacology · doi:10.1016/j.bcp.2026.117702 · Cited by 5
Hu, K., Liu, S., Sheng, S., Zhang, S., Li, B., Sun, B., & Xia, A. (2026) · iLiver · doi:10.1016/j.iliver.2026.100234 · Cited by 5
Metadata
- Authors
- Huang, Y., Xie, Y., Zhang, Y., Liu, Z., Jiang, W., Ye, Y., Tang, J., Li, Z., Yin, Z., & Lin, X.-J.
- Affiliations
- Jinan University (CN)
- Guangdong Pharmaceutical University (CN)
- Corresponding author
- Li, Zhenhua
- Yin, Zhinan
- Lin, Xue-Jia
- Venue
- Molecular Cancer
- Published
- 2025-06-11
- Volume
- 24
- Issue
- 1
- Pages
- 177-177
- ISSN
- 1476-4598 (ISSN-L)
- PMC
- PMC12153197
- OpenAlex
- W4411211873
- Cited by
- 41
- References
- 89
- Citations by year
- 2026: 37 · 2025: 4
- FWCI
- 16.84
- Type
- journal article
- Language
- en
- Open access
- gold
- doi.org
- Licence
- cc-by-nc-nd
- creativecommons.org/licenses/by-nc-nd/4.0 (tdm)
- creativecommons.org/licenses/by-nc-nd/4.0 (vor)
- Locations
- Molecular Cancer (publishedVersion, cc-by-nc-nd)
- PubMed Central (publishedVersion, cc-by-nc-nd)
- PubMed (publishedVersion)
- DOAJ (DOAJ: Directory of Open Access Journals) (submittedVersion, cc-by-sa)
- Funders
- National Natural Science Foundation of China (32100695, 32030036, 82372797)
- Guangdong Major Project of Basic and Applied Basic Research (2023B0303000004)
- National Key Research and Development Program of China (2020YFA0803502)
- 111 Project (B16021)
- Tip-top Scientific and Technical Innovative Youth Talents of Guangdong Special Support Program (2019TQ05Y110)
- Pearl River S & T Nova Program of Guangzhou, China (201906010085)
- Topics
- Health Sciences › Medicine › Oncology › Cancer Immunotherapy and Biomarkers
- Health Sciences › Medicine › Hepatology › Hepatocellular Carcinoma Treatment and Prognosis
- Health Sciences › Medicine › Hepatology › Liver physiology and pathology
- Keywords
- nonalcoholic steatohepatitis, hepatocellular carcinoma, liver immune microenvironment, apolipoprotein E, tumor-associated macrophages, exhausted T cells, NK cell dysfunction, B cell differentiation, γδ T cells, PI3K/Akt signaling, NF-κB signaling
- MeSH terms
- Single-Cell Gene Expression Analysis, Animals, Apolipoproteins E, B-Lymphocytes, Cell Differentiation, Fatty Liver, Carcinoma, Hepatocellular, Liver Neoplasms, Male, Mice, Inbred C57BL, T-Lymphocytes, Cell Lineage, Mice, Transcriptome, Cellular Reprogramming
About these checks
Registry, retraction, Cites and statistics results are computed, not judged, with one exception: a printed reference that no index lists is read once by a model before it counts as a citation error. Claims are extracted by a model and kept only when their quote appears verbatim in the text; each cited source is then checked, with a model’s help, for whether it says what the claim relies on. Those verdicts can be wrong — read the claim’s quote and the cited source before relying on one.
The claim verdicts this report counts are experimental: their accuracy is not yet measured.
A language model drew the claims from the paper on 2026-10-10, under version 3 of the claim definition (model deepseek-v4.1-flash, prompt extract-v3).
A second model labelled each claim on 2026-10-10 (model jev-1.13-20260917, definition revision gold-guideline-v0.2).
Cited sources are checked with a language model’s help (gpt-6-sol).
Statistics and arithmetic are recomputed, not judged.
Confidence bands are shown only for fields calibrated on our annotated test set. None is calibrated yet, so no band is shown.
What counts as a claim ›How we measure confidence ›How we check this ›
Are you an author, or do you see a problem with this page? Request a review
How to cite
Cite CoChat for the checks on this page, and the paper for its own findings.
- This page
- CoChat. (2026). Citation check: Single-cell transcriptome reveals the reprogramming of immune microenvironment during the transition from MASH to HCC. https://app.cochat.ai/papers/10.1186/s12943-025-02370-2
- The paper
- Huang, Y., Xie, Y., Zhang, Y., Liu, Z., Jiang, W., Ye, Y., Tang, J., Li, Z., Yin, Z., & Lin, X.-J. (2025). Single-cell transcriptome reveals the reprogramming of immune microenvironment during the transition from MASH to HCC. Molecular Cancer. https://doi.org/10.1186/s12943-025-02370-2
Data sources
Bibliographic data: Semantic Scholar, OpenAlex, Crossref.
Contains information from the Semantic Scholar Academic Graph Datasets, made available under the ODC Attribution License (ODC-BY 1.0).
Semantic Scholar’s data is described in: Kinney, R., et al. (2023). The Semantic Scholar Open Data Platform. arXiv:2301.10140.
