

The DOI matches its Crossref record; 52 of the 54 references it cites were found in a registry or an index.
Exosome-based biomimetic nanoparticles targeted to inflamed joints for enhanced treatment of rheumatoid arthritis
Open accessPublished version of a preprint
Abstract
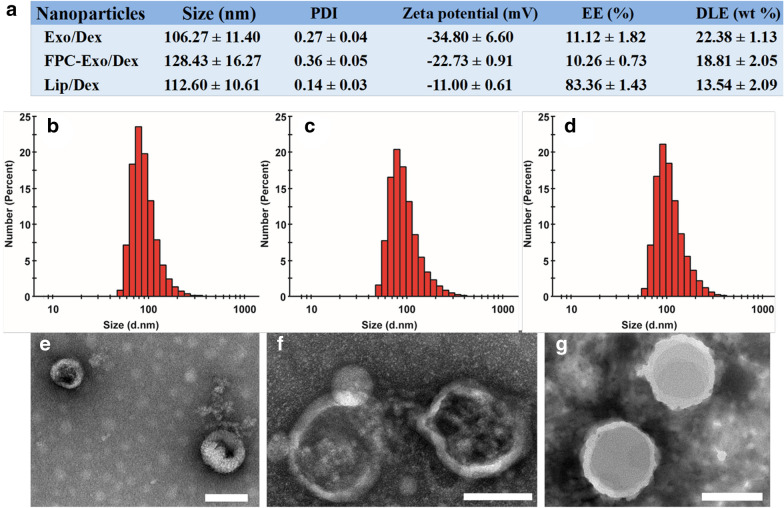
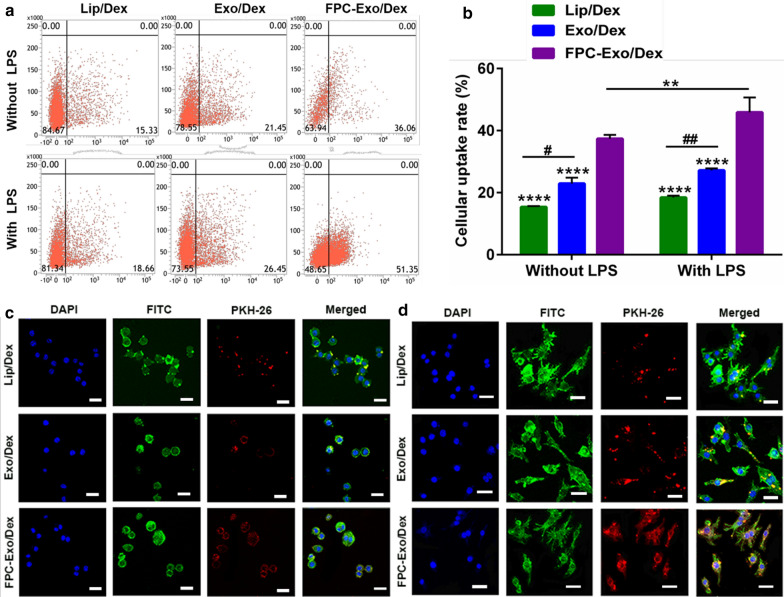
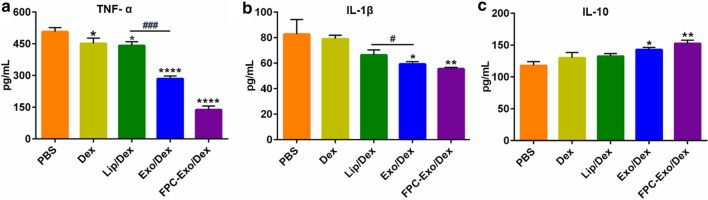
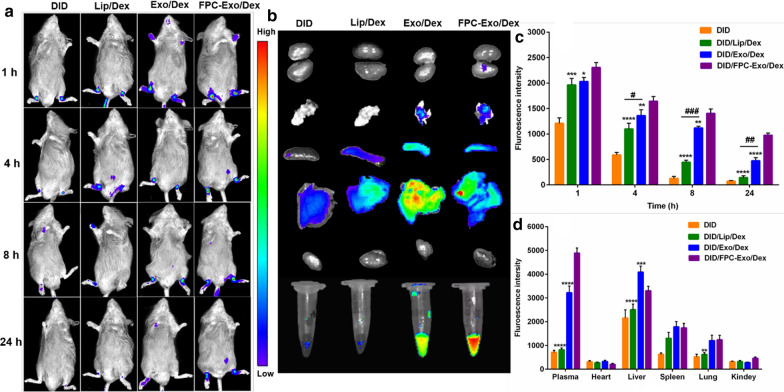
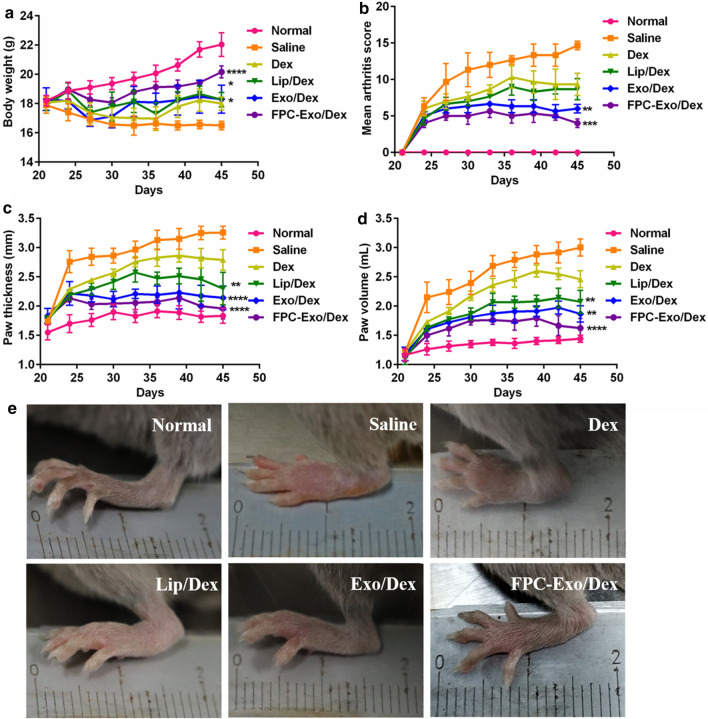
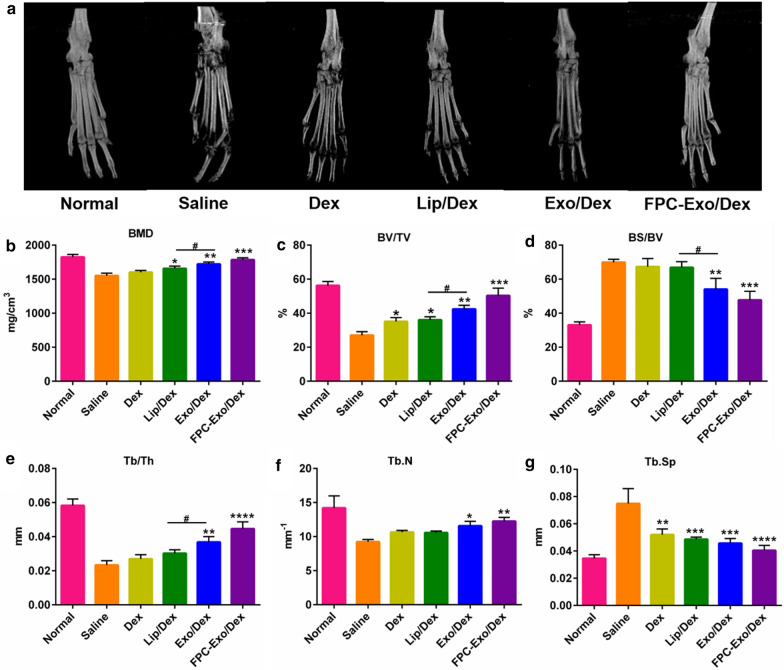
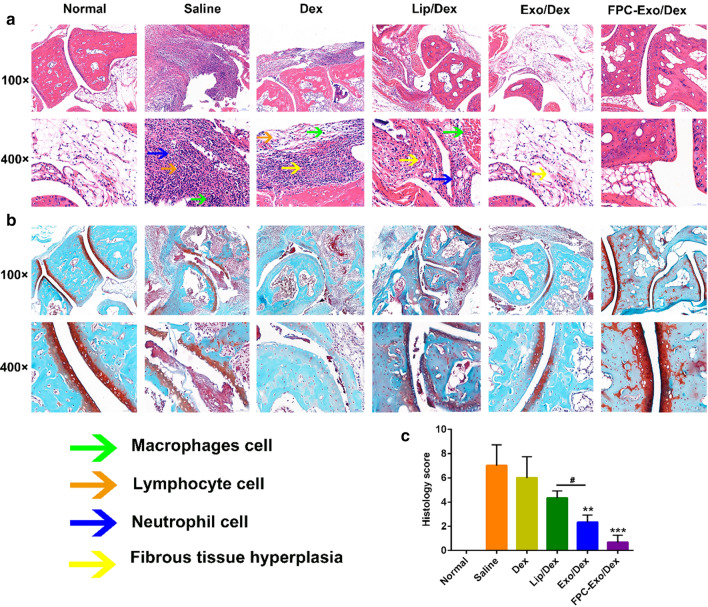
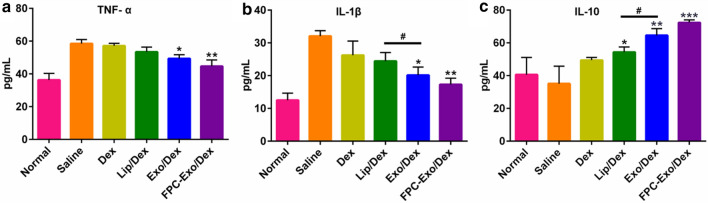
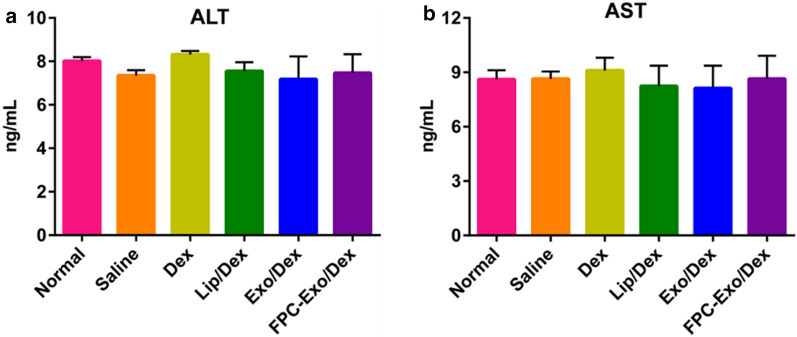
BACKGROUND: Glucocorticoids (GCs) show powerful treatment effect on rheumatoid arthritis (RA). However, the clinical application is limited by their nonspecific distribution after systemic administration, serious adverse reactions during long-term administration. To achieve better treatment, reduce side effect, we here established a biomimetic exosome (Exo) encapsulating dexamethasone sodium phosphate (Dex) nanoparticle (Exo/Dex), whose surface was modified with folic acid (FA)-polyethylene glycol (PEG)-cholesterol (Chol) compound to attain FPC-Exo/Dex active targeting drug delivery system. RESULTS: The size of FPC-Exo/Dex was 128.43 ± 16.27 nm, with a polydispersity index (PDI) of 0.36 ± 0.05, and the Zeta potential was - 22.73 ± 0.91 mV. The encapsulation efficiency (EE) of the preparation was 10.26 ± 0.73%, with drug loading efficiency (DLE) of 18.81 ± 2.05%. In vitro study showed this system displayed enhanced endocytosis and excellent anti-inflammation effect against RAW264.7 cells by suppressing pro-inflammatory cytokines and increasing anti-inflammatory cytokine. Further biodistribution study showed the fluorescence intensity of FPC-Exo/Dex was stronger than other Dex formulations in joints, suggesting its enhanced accumulation to inflammation sites. In vivo biodistribution experiment displayed FPC-Exo/Dex could preserve the bone and cartilage of CIA mice better and significantly reduce inflamed joints. Next in vivo safety evaluation demonstrated this biomimetic drug delivery system had no obvious hepatotoxicity and exhibited desirable biocompatibility. CONCLUSION: The present study provides a promising strategy for using exosome as nanocarrier to enhance the therapeutic effect of GCs against RA.
Overview
The claims and statistics of this paper haven’t been checked yet.
Run the check — free, no account needed. It reads the open-access text and checks the sources it cites.
Integrity signals
Registry
Cites
Statistics
Figures
Verification
Claims the paper makes
The claims and statistics of this paper haven’t been checked yet.
Run the check — free, no account needed. It reads the open-access text and checks the sources it cites.
Claims other papers make about this one
Each is checked against this paper’s own text: does it say what the citing paper says it does?
In the citing paper
“In vivo biodistribution experiments showed that these engineered exosomes better protected bone and cartilage in CIA mice and reduced joint inflammation without obvious liver toxicity.”
From The Therapeutic Potential and Clinical Significance of Exosomes as Carriers of Drug Delivery System (2022) · cites this paper as [82]
Self-check
Percentages, sums and reported differences re-computed from the paper’s own numbers.
The self-check needs the paper’s full text.
Citations
Cites
Exosomes as drug delivery vehicles for Parkinson’s disease therapy
Haney, M. J., Klyachko, N. L., Zhao, Y., Gupta, R., Plotnikova, E. G., He, Z., Patel, T., Piroyan, A., Sokolsky, M., Kabanov, A. V., et al. (2015) · Journal of Controlled Release · doi:10.1016/j.jconrel.2015.03.033 · Cited by 2,009
Tian, Y., Li, S., Song, J., Ji, T., Zhu, M., Anderson, G. J., Wei, J., & Nie, G. (2013) · Biomaterials · doi:10.1016/j.biomaterials.2013.11.083 · Cited by 1,841
Anti-inflammatory Actions of Glucocorticoids: Molecular Mechanisms
Barnes, P. J. (1998) · Clinical Science · doi:10.1042/cs0940557 · Cited by 1,591
Development of exosome-encapsulated paclitaxel to overcome MDR in cancer cells
Kim, M. S., Haney, M. J., Zhao, Y., Mahajan, V., Deygen, I., Klyachko, N. L., Inskoe, E., Piroyan, A., Sokolsky, M., Okolie, O., et al. (2016) · Nanomedicine: Nanotechnology, Biology and Medicine · doi:10.1016/j.nano.2015.10.012 · Cited by 1,410
Yang, T., Martin, P. B., Fogarty, B., Brown, A. H., Schurman, K., Phipps, R. J., Yin, V. P., Lockman, P. R., & Bai, S. (2015) · Pharmaceutical Research · doi:10.1007/s11095-014-1593-y · Cited by 980
Recent progress in drug delivery
Li, C., Wang, J., Wang, Y., Gao, H., Wei, G., Huang, Y., Yu, H., Gan, Y., Wang, Y., Mei, L., et al. (2019) · Acta Pharmaceutica Sinica B · doi:10.1016/j.apsb.2019.08.003 · Cited by 818
Self-citationMacrophages in rheumatoid arthritis.
Kinne, R. W., Bräuer, R., Stuhlmüller, B., Palombo‐Kinne, E., & Burmester, G. R. (2000) · Arthritis Research · doi:10.1186/ar86 · Cited by 758
PEGylated and targeted extracellular vesicles display enhanced cell specificity and circulation time
Kooijmans, S. A. A., Fliervoet, L. A. L., van der Meel, R., Fens, M. H. A. M., Heijnen, H. F. G., Henegouwen, P. M. P. V. B. E., Vader, P., & Schiffelers, R. M. (2016) · Journal of Controlled Release · doi:10.1016/j.jconrel.2016.01.009 · Cited by 645
Recent advancements in the use of exosomes as drug delivery systems
Bunggulawa, E. J., Wang, W., Yin, T., Wang, N., Durkan, C., Wang, Y., & Wang, G. (2018) · Journal of Nanobiotechnology · doi:10.1186/s12951-018-0403-9 · Cited by 608
Self-citationMacrophage exosomes as natural nanocarriers for protein delivery to inflamed brain
Yuan, D., Zhao, Y., Banks, W. A., Bullock, K. M., Haney, M., Batrakova, E., & Kabanov, A. V. (2017) · Biomaterials · doi:10.1016/j.biomaterials.2017.07.011 · Cited by 607
Cited by
Sorted by citations
Exosomes: Large-scale production, isolation, drug loading efficiency, and biodistribution and uptake
Kimiz-Gebologlu, I., & Oncel, S. S. (2022) · Journal of Controlled Release · doi:10.1016/j.jconrel.2022.05.027 · Cited by 722
Cardiac fibrosis: Myofibroblast-mediated pathological regulation and drug delivery strategies
Liu, M., Abad, B. L. D. J., & Cheng, K. (2021) · Advanced Drug Delivery Reviews · doi:10.1016/j.addr.2021.03.021 · Cited by 370
Extracellular vesicles: a rising star for therapeutics and drug delivery
Du, S., Guan, Y., Xie, A., Yan, Z., Gao, S., Li, W., Rao, L., Chen, X., & Chen, T. (2023) · Journal of Nanobiotechnology · doi:10.1186/s12951-023-01973-5 · Cited by 343
Self-citationM2-type exosomes nanoparticles for rheumatoid arthritis therapy via macrophage re-polarization
Li, H., Feng, Y., Zheng, X. C., Jia, M., Mei, Z., Wang, Y., Zhang, Z., Zhou, M., & Li, C. (2021) · Journal of Controlled Release · doi:10.1016/j.jconrel.2021.11.019 · Cited by 266
Self-citationExosome-Based Drug Delivery: Translation from Bench to Clinic
Koh, H. B., Kim, H. J., Kang, S.-W., & Yoo, T.-H. (2023) · Pharmaceutics · doi:10.3390/pharmaceutics15082042 · Cited by 259
Metadata
- Authors
- Yan, F., Zhong, Z., Wang, Y., Feng, Y., Mei, Z., Li, H., Chen, X., Cai, L., & Li, C.
- Affiliations
- Southwest Medical University (CN)
- Affiliated Hospital of Southwest Medical University (CN)
- Sichuan University (CN)
- Corresponding author
- Cai, Liang
- Li, Chunhong
- Venue
- Journal of Nanobiotechnology
- Published
- 2020-08-20
- Volume
- 18
- Issue
- 1
- Pages
- 115-115
- ISSN
- 1477-3155 (ISSN-L)
- PMC
- PMC7441703
- OpenAlex
- W3050111167
- Cited by
- 197
- References
- 54
- Citations by year
- 2026: 18 · 2025: 36 · 2024: 43 · 2023: 36 · 2022: 39 · 2021: 24 · 2020: 1
- FWCI
- 6.50
- Type
- journal article
- Language
- en
- Open access
- gold
- doi.org
- Locations
- Journal of Nanobiotechnology (publishedVersion, cc-by)
- Research Square (acceptedVersion, cc-by)
- PubMed Central (publishedVersion, cc-by)
- PubMed (publishedVersion)
- DOAJ (DOAJ: Directory of Open Access Journals) (submittedVersion, cc-by-sa)
- Funders
- National Major Science and Technology Projects of China (81803478)
- Topics
- Physical Sciences › Materials Science › Biomaterials › Nanoparticle-Based Drug Delivery
- Life Sciences › Biochemistry, Genetics and Molecular Biology › Molecular Biology › Extracellular vesicles in disease
- Health Sciences › Medicine › Rheumatology › Rheumatoid Arthritis Research and Therapies
- Keywords
- rheumatoid arthritis, exosomes, biomimetic nanoparticles, dexamethasone, glucocorticoids, targeted drug delivery, folic acid, joint inflammation, anti-inflammatory cytokines, collagen-induced arthritis, tissue distribution, biocompatibility, nanocarriers
- MeSH terms
- RAW 264.7 Cells, Animals, Anti-Inflammatory Agents, Arthritis, Rheumatoid, Cholesterol, Dexamethasone, Folic Acid, Joints, Male, Polyethylene Glycols, Biomimetic Materials, Mice, Nanoparticles, Exosomes
About these checks
Registry, retraction, Cites and statistics results are computed, not judged, with one exception: a printed reference that no index lists is read once by a model before it counts as a citation error. Claims are extracted by a model and kept only when their quote appears verbatim in the text; each cited source is then checked, with a model’s help, for whether it says what the claim relies on. Those verdicts can be wrong — read the claim’s quote and the cited source before relying on one.
Statistics and arithmetic are recomputed, not judged.
Confidence bands are shown only for fields calibrated on our annotated test set. None is calibrated yet, so no band is shown.
What counts as a claim ›How we measure confidence ›How we check this ›
Are you an author, or do you see a problem with this page? Request a review
