Cited by 22

The DOI matches its Crossref record; 1 of the 1 references it cites were found in a registry or an index.

Multifunctional elastin-like polypeptide nanocarriers for efficient miRNA delivery in cancer therapy

Hong, Jisan, Sim, Dahye, Lee, Byung-Heon, Sarangthem, Vijaya, Park, Rang-Woon·2024·Journal of Nanobiotechnology

Abstract

Background: The exogenous delivery of miRNA to mimic and restore miRNA-34a activity in various cancer models holds significant promise in cancer treatment. Nevertheless, its effectiveness is often impeded by challenges, including a short half-life, propensity for off-target accumulation, susceptibility to inactivation by blood-based enzymes, concerns regarding patient safety, and the substantial cost associated with scaling up. As a means of overcoming these barriers, we propose the development of miRNA-loaded Tat-A86 nanoparticles by virtue of Tat-A86's ability to shield the loaded agent from external environmental factors, reducing degradation and inactivation, while enhancing circulation time and targeted accumulation. Results: Genetically engineered Tat-A86, featuring 16 copies of the interleukin-4 receptor (IL-4R)-binding peptide (AP1), Tat for tumor penetration, and an elastin-like polypeptide (ELP) for presenting target ligands and ensuring stability, served as the basis for this delivery system. Comparative groups, including Tat-E60 and A86, were employed to discern differences in binding and penetration. The designed ELP-based nanoparticle Tat-A86 effectively condensed miRNA, forming stable nanocomplexes under physiological conditions. The miRNA/Tat-A86 formulation bound specifically to tumor cells and facilitated stable miRNA delivery into them, effectively inhibiting tumor growth. The efficacy of miRNA/Tat-A86 was further evaluated using three-dimensional spheroids of lewis lung carcinoma (LLC) as in vitro model and LLC tumor-bearing mice as an in vivo model. It was found that miRNA/Tat-A86 facilitates effective cell killing by markedly improving miRNA penetration, leading to a substantial reduction in the size of LLC spheroids. Compared to other controls, Tat-A86 demonstrated superior efficacy in suppressing the growth of 3D cellular aggregates. Moreover, at equivalent doses, miRNA-34a delivered by Tat-A86 inhibited the growth of LLC cells in allograft mice. Conclusions: Overall, these studies demonstrate that Tat-A86 nanoparticles can deliver miRNA systemically, overcoming the basic hurdles impeding miRNA delivery by facilitating both miRNA uptake and stability, ultimately leading to improved therapeutic effects. Graphical Abstract:

Overview

The claims and statistics of this paper haven’t been checked yet.

Run the check — free, no account needed. It reads the open-access text and checks the sources it cites.

A few free checks a day · papers already verified open instantly · results are public

Integrity signals

Registry

Crossref · 10.1186/s12951-024-02559-5

Cites

1 of 1 references verified0 citation errors · 0 not checkable

Statistics

Figures

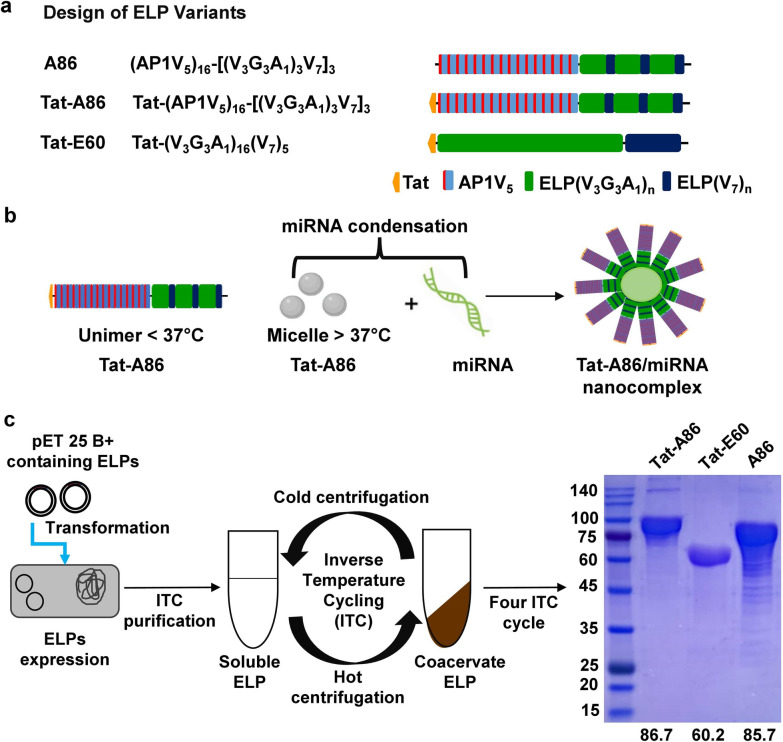
Fig. 1 Design and expression of miRNA-binding ELPs. a Schematic representation of chimeric fusion ELPs encoding A86, Tat-E60, and Tat-A86, along with their corresponding amino acid sequences. b The carrier component of the ELP fusion protein is pivotal in mediating the interaction with miRNA. The positively charged amino acids in ELPs induce complexation with the negatively charged nucleic acids to form stable nano complexes. c pET 25b + vectors harboring Tat-E60, A86, and Tat-A86 genes were individually transformed into the Escherichia coli strain BL21 for ELP protein expression. Purification of all fusion ELPs involved triggering a phase transition and a repeated cycle of hot spin to aggregate protein, followed by cold spin to dissolve the ELP pellet, continued for four rounds to achieve homogeneity in fusion ELPs from cell lysate. The size and purity of the purified fusion proteins were confirmed through sodium dodecyl sulphate–polyacrylamide gel electrophoresis (SDS-PAGE), and Coomassie blue staining was employed for visualization. The size of each fusion ELP is indicated below the gel image
Fig. 1 Design and expression of miRNA-binding ELPs. a Schematic representation of chimeric fusion ELPs encoding A86, Tat-E60, and Tat-A86, along with their corresponding amino acid sequences. b The carrier component of the ELP fusion protein is pivotal in mediating the interaction with miRNA. The positively charged amino acids in ELPs induce complexation with the negatively charged nucleic acids to form stable nano complexes. c pET 25b + vectors harboring Tat-E60, A86, and Tat-A86 genes were individually transformed into the Escherichia coli strain BL21 for ELP protein expression. Purification of all fusion ELPs involved triggering a phase transition and a repeated cycle of hot spin to aggregate protein, followed by cold spin to dissolve the ELP pellet, continued for four rounds to achieve homogeneity in fusion ELPs from cell lysate. The size and purity of the purified fusion proteins were confirmed through sodium dodecyl sulphate–polyacrylamide gel electrophoresis (SDS-PAGE), and Coomassie blue staining was employed for visualization. The size of each fusion ELP is indicated below the gel imageCC BY · PubMed Central
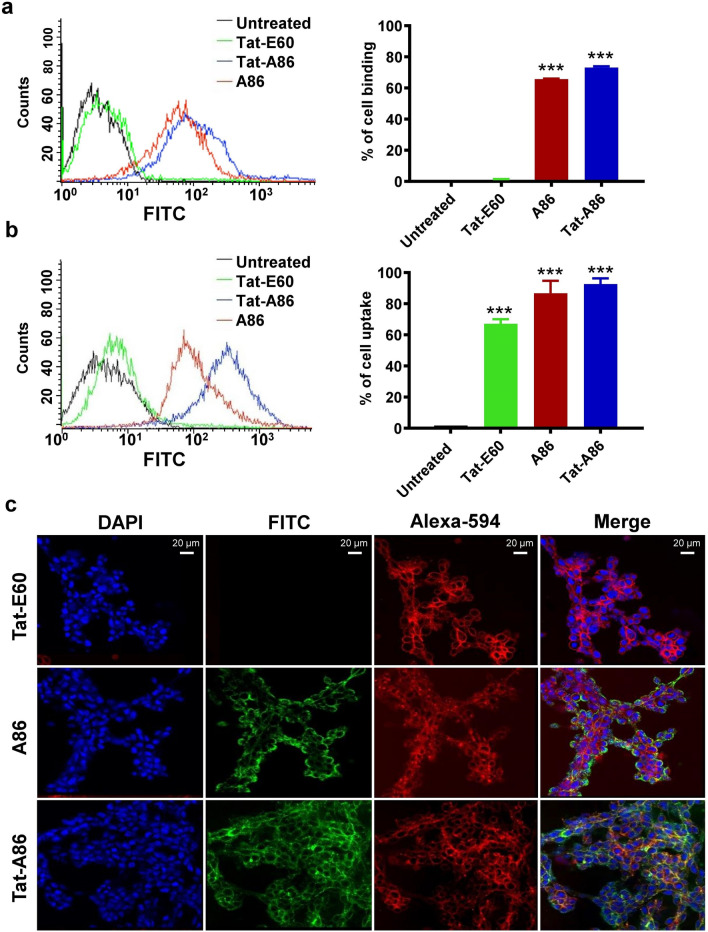
Fig. 2 The binding of ELPs to LLC and 4T1 cells. LLC (a) and 4T1 (b) cells were incubated with fluorescein isothiocyanate (FITC)-labelled ELPs (0.5 µM) at 37 °C for 1 h. The percentage of cell-binding was analyzed through flow cytometry (n = 3). Graphical bars on the right represent the percentage of ELP-bound cells as the mean ± standard deviation (SD) of data obtained from three separate experiments performed in triplicate. ***P < 0.001 (one-way analysis of variance (ANOVA)) indicates significant differences for Tat-E60, A86 and Tat-A86 compared with untreated control. c LLC cells were treated with 0.5 µM of the respective fluorescein isothiocyanate (FITC)-labelled polypeptides at 37 °C for 1 h and observed under confocal laser microscopy. Cell membranes and nuclei were stained with Wheat Germ Agglutinin Alexa 594 and Hoechst, respectively. Representative confocal images from five independent experiments. Scale bar, 20 µm
Fig. 2 The binding of ELPs to LLC and 4T1 cells. LLC (a) and 4T1 (b) cells were incubated with fluorescein isothiocyanate (FITC)-labelled ELPs (0.5 µM) at 37 °C for 1 h. The percentage of cell-binding was analyzed through flow cytometry (n = 3). Graphical bars on the right represent the percentage of ELP-bound cells as the mean ± standard deviation (SD) of data obtained from three separate experiments performed in triplicate. ***P < 0.001 (one-way analysis of variance (ANOVA)) indicates significant differences for Tat-E60, A86 and Tat-A86 compared with untreated control. c LLC cells were treated with 0.5 µM of the respective fluorescein isothiocyanate (FITC)-labelled polypeptides at 37 °C for 1 h and observed under confocal laser microscopy. Cell membranes and nuclei were stained with Wheat Germ Agglutinin Alexa 594 and Hoechst, respectively. Representative confocal images from five independent experiments. Scale bar, 20 µmCC BY · PubMed Central
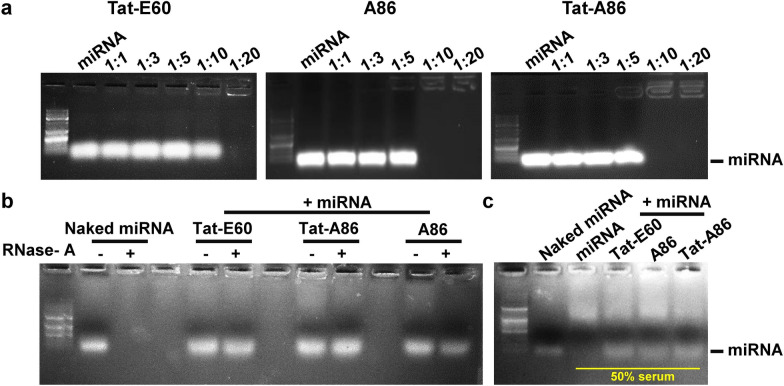
Fig. 3 Gel retardation assay of miRNA/ELP complexes. a The complexation of Tat-E60, A86, and Tat-A86 with miRNA was examined at different miRNA/ELP ratios. Interactions between miRNA (10 μM) and ELPs (10–200 μM) were assessed using a gel retardation assay. The gels were visualized by staining with ethidium bromide. Lane 1: 1 kb DNA ladder, Lane 2: naked miRNA (22 bp), Lanes 3–7: miRNA/ELP complexes at different molar ratios. b The stability of encapsulated miRNA was evaluated by subjecting miRNA/ELP complexes to treatment with or without RNase A for 1 h. The samples were loaded alongside naked miRNA (Lane 2) and in the presence of RNase I (Lane 3). Lanes 5, 8, and 11 depict untreated Tat-E60/miRNA, Tat-A86/miRNA and A86/miRNA complexes, respectively. Lanes 6, 9, and 12 depict RNase A-treated Tat-E60/miRNA, Tat-A86/miRNA and A86/miRNA complexes respectively. Electrophoresis was performed on a 1% agarose gel in tris–acetate-EDTA (TAE) buffer, and gel visualization was achieved by staining with ethidium bromide. c A naked miRNA (Lane 2) or miRNA/ELPs complexes (Lane 3–5) were incubated with the 50% mouse serum for 24 h. Following incubation, the miRNA was liberated from the complexes utilizing heparin and subsequently subjected to analysis via agarose gel electrophoresis
Fig. 3 Gel retardation assay of miRNA/ELP complexes. a The complexation of Tat-E60, A86, and Tat-A86 with miRNA was examined at different miRNA/ELP ratios. Interactions between miRNA (10 μM) and ELPs (10–200 μM) were assessed using a gel retardation assay. The gels were visualized by staining with ethidium bromide. Lane 1: 1 kb DNA ladder, Lane 2: naked miRNA (22 bp), Lanes 3–7: miRNA/ELP complexes at different molar ratios. b The stability of encapsulated miRNA was evaluated by subjecting miRNA/ELP complexes to treatment with or without RNase A for 1 h. The samples were loaded alongside naked miRNA (Lane 2) and in the presence of RNase I (Lane 3). Lanes 5, 8, and 11 depict untreated Tat-E60/miRNA, Tat-A86/miRNA and A86/miRNA complexes, respectively. Lanes 6, 9, and 12 depict RNase A-treated Tat-E60/miRNA, Tat-A86/miRNA and A86/miRNA complexes respectively. Electrophoresis was performed on a 1% agarose gel in tris–acetate-EDTA (TAE) buffer, and gel visualization was achieved by staining with ethidium bromide. c A naked miRNA (Lane 2) or miRNA/ELPs complexes (Lane 3–5) were incubated with the 50% mouse serum for 24 h. Following incubation, the miRNA was liberated from the complexes utilizing heparin and subsequently subjected to analysis via agarose gel electrophoresisCC BY · PubMed Central
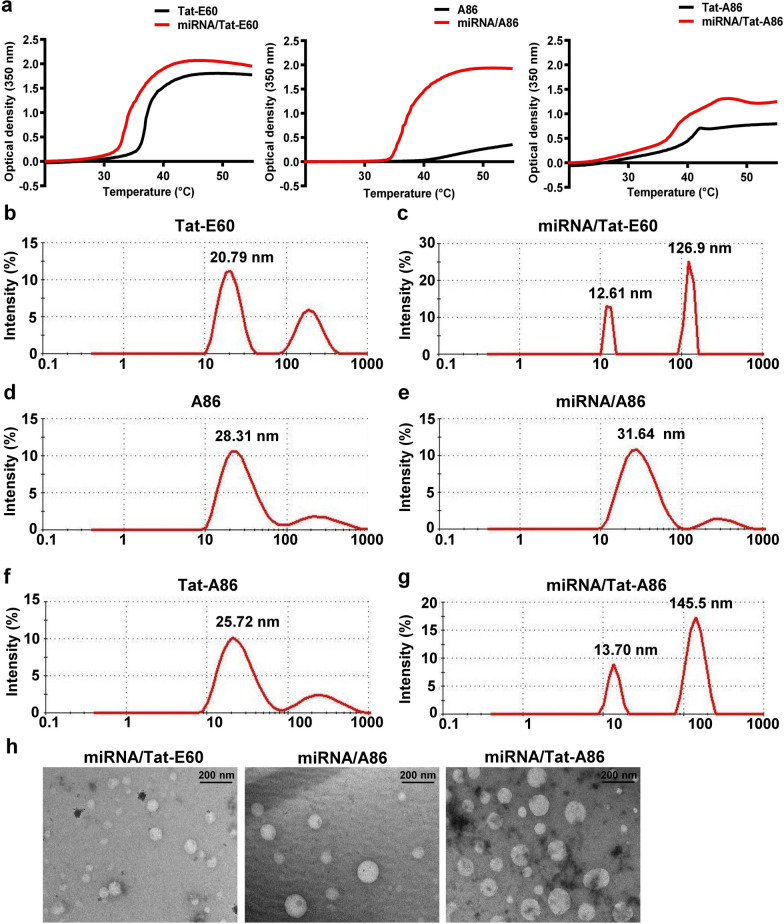
Fig. 4 Physical characterization of miRNA/ELP complexes. a The turbidity profiles of the miRNA/ELP complexes (red) were assessed at 350 nm, with a temperature increase of 1 °C/min, and compared with those of naïve ELPs (black) at various temperatures. To validate the stable condensation of miRNA/ELP complexes, nanoparticle size was determined using dynamic light scattering (DLS) at 24 °C. The size parameters of ELPs alone and sizes following complex formation including Tat-E60 (b, c), A86 (d, e), and Tat-A86 (f, g) were evaluated. h TEM images of miRNA/Tat-E60, miRNA/A86 and miRNA/Tat-A86 nanocomplexes at room temperature. Scale bar = 200 nm
Fig. 4 Physical characterization of miRNA/ELP complexes. a The turbidity profiles of the miRNA/ELP complexes (red) were assessed at 350 nm, with a temperature increase of 1 °C/min, and compared with those of naïve ELPs (black) at various temperatures. To validate the stable condensation of miRNA/ELP complexes, nanoparticle size was determined using dynamic light scattering (DLS) at 24 °C. The size parameters of ELPs alone and sizes following complex formation including Tat-E60 (b, c), A86 (d, e), and Tat-A86 (f, g) were evaluated. h TEM images of miRNA/Tat-E60, miRNA/A86 and miRNA/Tat-A86 nanocomplexes at room temperature. Scale bar = 200 nmCC BY · PubMed Central
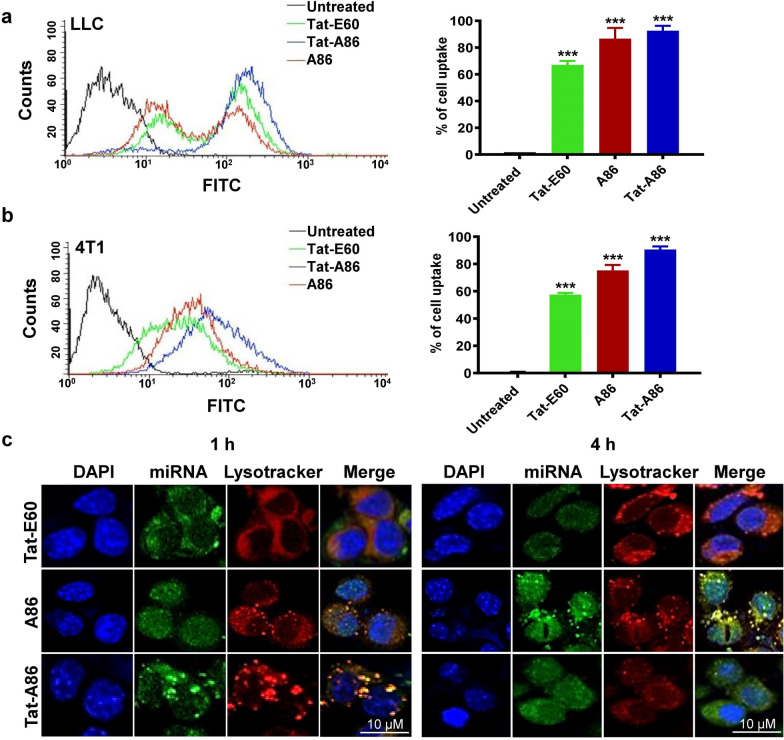
Fig. 5 Cellular uptake and intracellular tracking of miRNA/ELP complexes. Uptake of FAM-labeled miRNA/ELP complexes by LLC (a) and 4T1 (b) cells was investigated. LLC and 4T1 cells were individually mixed with the complexes and incubated at 37 °C for 1 h. Subsequently, the miRNA uptake percentages were determined using flow cytometry (n = 3). Graphical bars on the right illustrate the mean ± SD of miRNA uptake percentages, derived from three independent experiments conducted in triplicate. ***P < 0.001, one-way analysis of variance (ANOVA) indicates significant differences for Tat-E60, A86 and Tat-A86 complexes compared with untreated control. c LLC cells were incubated with miRNA/ELP complexes containing 150 pmol of FAM-labeled miRNA for 1 h and 4 h. Lysosomal compartments were selectively labeled using LysoTracker Red DND-99, and the dynamic subcellular localization of miRNA was examined in real-time using a Zeiss confocal microscope. The yellow signal depicts the co-localization of miRNA with the lysosomal marker. Representative confocal microscopic images from five experiments (n = 5) are presented, with blue indicating nuclei stained with Hoechst, green representing miRNA/ELP complexes, and red corresponding to LysoTracker. Scale bar, 10 µm
Fig. 5 Cellular uptake and intracellular tracking of miRNA/ELP complexes. Uptake of FAM-labeled miRNA/ELP complexes by LLC (a) and 4T1 (b) cells was investigated. LLC and 4T1 cells were individually mixed with the complexes and incubated at 37 °C for 1 h. Subsequently, the miRNA uptake percentages were determined using flow cytometry (n = 3). Graphical bars on the right illustrate the mean ± SD of miRNA uptake percentages, derived from three independent experiments conducted in triplicate. ***P < 0.001, one-way analysis of variance (ANOVA) indicates significant differences for Tat-E60, A86 and Tat-A86 complexes compared with untreated control. c LLC cells were incubated with miRNA/ELP complexes containing 150 pmol of FAM-labeled miRNA for 1 h and 4 h. Lysosomal compartments were selectively labeled using LysoTracker Red DND-99, and the dynamic subcellular localization of miRNA was examined in real-time using a Zeiss confocal microscope. The yellow signal depicts the co-localization of miRNA with the lysosomal marker. Representative confocal microscopic images from five experiments (n = 5) are presented, with blue indicating nuclei stained with Hoechst, green representing miRNA/ELP complexes, and red corresponding to LysoTracker. Scale bar, 10 µmCC BY · PubMed Central
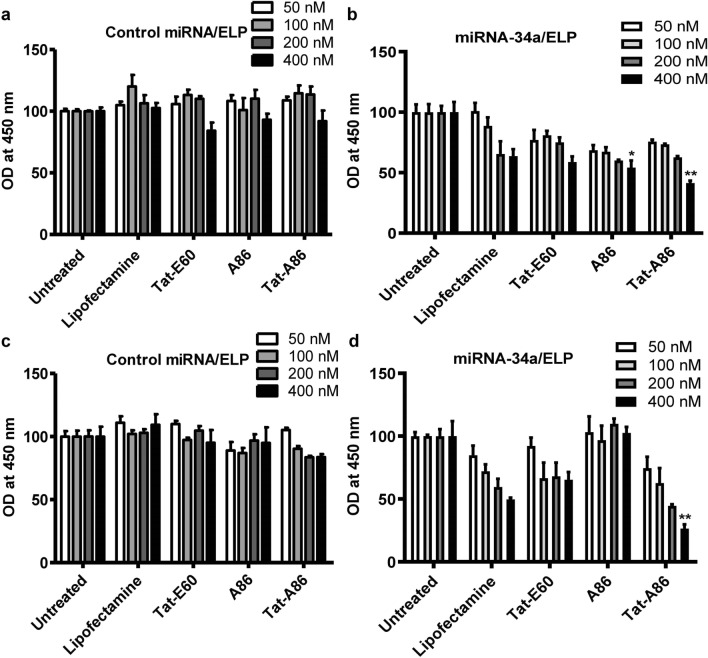
Fig. 6 Cell viability assay. The impact of miRNA-34a on the growth of LLC (a, b) and 4T1 (c, d) cells was assessed following transfection with miRNA/ELPs. LLC or 4T1 cells (5 × 10³/well) in a 96-well plate were treated with negative control (NC) miRNA/ELPs and miRNA-34a/ELPs at concentrations ranging from 50 to 400 nM for 48 h. Cell proliferation was evaluated using a CCK assay. Specifically, 10 μL of CCK-8 solution was added to each well and incubated for 1 h at 37 ℃, and the change in absorbance was measured at a wavelength of 450 nm. One-way ANOVA was performed to assess the statistical significance of the differences among groups treated with miRNA/ELP complexes at different miRNA concentrations. *P < 0.05, NC miRNA/A86 vs. miRNA-34a/A86 (400 nM) delivery, and **P < 0.001, NC miRNA/Tat-A86 vs. miRNA-34a/Tat-A86-mediated miRNA (400 nM) delivery
Fig. 6 Cell viability assay. The impact of miRNA-34a on the growth of LLC (a, b) and 4T1 (c, d) cells was assessed following transfection with miRNA/ELPs. LLC or 4T1 cells (5 × 10³/well) in a 96-well plate were treated with negative control (NC) miRNA/ELPs and miRNA-34a/ELPs at concentrations ranging from 50 to 400 nM for 48 h. Cell proliferation was evaluated using a CCK assay. Specifically, 10 μL of CCK-8 solution was added to each well and incubated for 1 h at 37 ℃, and the change in absorbance was measured at a wavelength of 450 nm. One-way ANOVA was performed to assess the statistical significance of the differences among groups treated with miRNA/ELP complexes at different miRNA concentrations. *P < 0.05, NC miRNA/A86 vs. miRNA-34a/A86 (400 nM) delivery, and **P < 0.001, NC miRNA/Tat-A86 vs. miRNA-34a/Tat-A86-mediated miRNA (400 nM) deliveryCC BY · PubMed Central
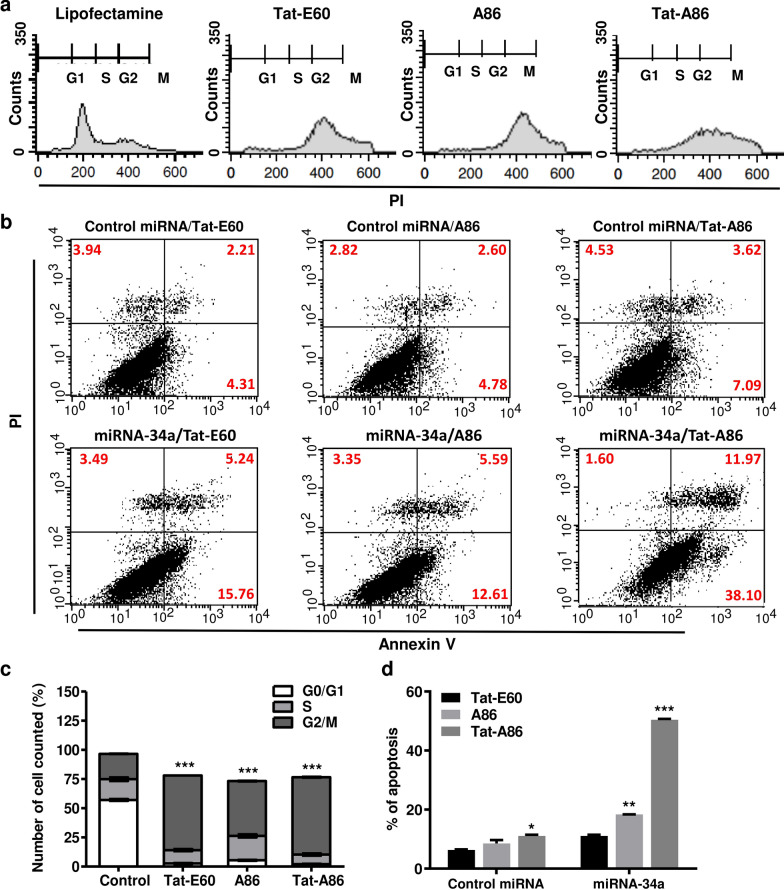
Fig. 7 miR-34a/ELPs induce G2/M phase arrest and cellular apoptosis. a LLC cells were transfected with miRNA-34a/ ELP, and the cell cycle distribution was analyzed 48 h post-transfection using flow cytometry after propidium iodide (PI) staining. b Flow cytometry analysis, followed by annexin V–PI staining, revealed the apoptosis percentages in LLC cells treated with different miRNA-34a/ELPs. Representative images from the flow cytometry analysis are shown. c The percentages of cell populations in the G0/G1, S, and G2/M phases were analyzed relative to the total phases. Most miRNA-34a/ELPs induced cell cycle arrest at the G2/M phase in LLC cells. Data are presented as the mean ± SD from at least three independent experiments. ***P < 0.001 indicates statistically significant difference in the miR-34a/Tat-E60, miR-34a/A86 and miR-34a/Tat-A86 -treated group compared to the control group. d The percentage of apoptotic cells increased significantly in miRNA-34a/Tat-A86-treated LLC cells compared to the control. Data are presented as the mean ± SD for relative apoptosis normalized to control cells for three independent experiments. Columns represent the mean of three separate experiments, while bars represent the SD. **P < 0.01, ***P < 0.001 as determined by ANOVA test, miRNA-34a/Tat-E60 vs. miRNA/miRNA-34a/A86, and miRNA-34a/Tat-E60 vs. miRNA-34a/Tat-A86
Fig. 7 miR-34a/ELPs induce G2/M phase arrest and cellular apoptosis. a LLC cells were transfected with miRNA-34a/ ELP, and the cell cycle distribution was analyzed 48 h post-transfection using flow cytometry after propidium iodide (PI) staining. b Flow cytometry analysis, followed by annexin V–PI staining, revealed the apoptosis percentages in LLC cells treated with different miRNA-34a/ELPs. Representative images from the flow cytometry analysis are shown. c The percentages of cell populations in the G0/G1, S, and G2/M phases were analyzed relative to the total phases. Most miRNA-34a/ELPs induced cell cycle arrest at the G2/M phase in LLC cells. Data are presented as the mean ± SD from at least three independent experiments. ***P < 0.001 indicates statistically significant difference in the miR-34a/Tat-E60, miR-34a/A86 and miR-34a/Tat-A86 -treated group compared to the control group. d The percentage of apoptotic cells increased significantly in miRNA-34a/Tat-A86-treated LLC cells compared to the control. Data are presented as the mean ± SD for relative apoptosis normalized to control cells for three independent experiments. Columns represent the mean of three separate experiments, while bars represent the SD. **P < 0.01, ***P < 0.001 as determined by ANOVA test, miRNA-34a/Tat-E60 vs. miRNA/miRNA-34a/A86, and miRNA-34a/Tat-E60 vs. miRNA-34a/Tat-A86CC BY · PubMed Central
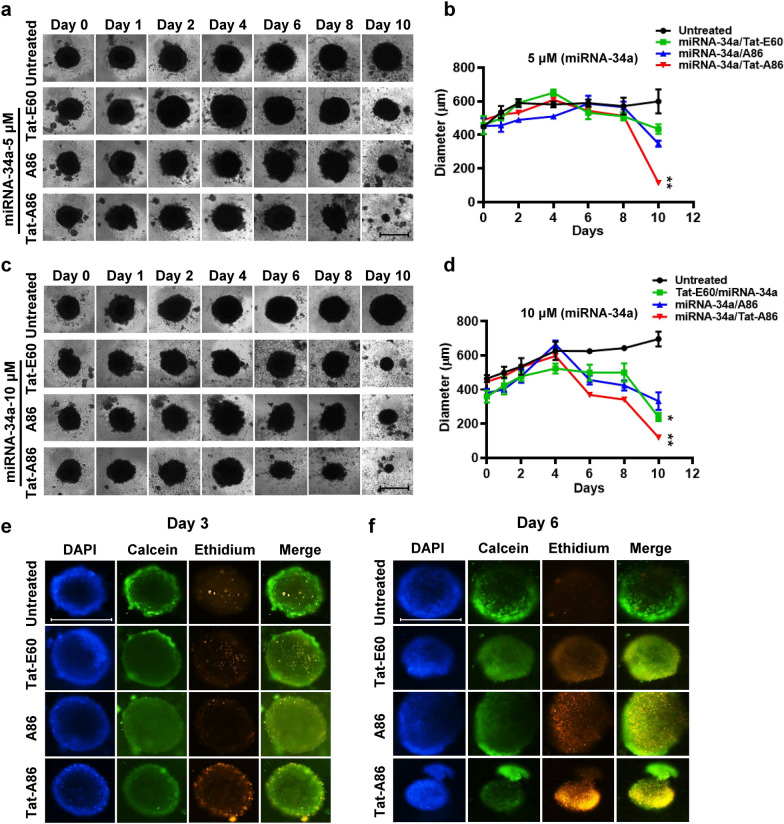
Fig. 8 Growth inhibition assay using the LLC spheroids. a–d LLC spheroids were treated with different miRNA/ELP complexes, featuring varying miRNA-34a concentrations (5 or 10 μM) encapsulated within different ELPs. The time-dependent increase in the diameter of LLC spheroids was monitored for 10 days using bright-field imaging. Representative images of spheroid treated with miRNA/ELP complexes are presented. LLC spheroids cultured in Roswell Park Memorial Institute (RPMI) medium served as a control. Scale bar, 500 μm. Growth curve of LLC spheroids after various treatments. **P < 0.01, Tat-A86/miRNA-34a treated vs. control group from day 6 onwards. e, f Cell viability assay of the differently sized spheroids (day 3 and day 6) using live/dead staining with ethidium homodimer-1 and calcein AM. Viable cells are depicted in green, while nonviable cells are shown in red. Scale bar, 500 μm
Fig. 8 Growth inhibition assay using the LLC spheroids. a–d LLC spheroids were treated with different miRNA/ELP complexes, featuring varying miRNA-34a concentrations (5 or 10 μM) encapsulated within different ELPs. The time-dependent increase in the diameter of LLC spheroids was monitored for 10 days using bright-field imaging. Representative images of spheroid treated with miRNA/ELP complexes are presented. LLC spheroids cultured in Roswell Park Memorial Institute (RPMI) medium served as a control. Scale bar, 500 μm. Growth curve of LLC spheroids after various treatments. **P < 0.01, Tat-A86/miRNA-34a treated vs. control group from day 6 onwards. e, f Cell viability assay of the differently sized spheroids (day 3 and day 6) using live/dead staining with ethidium homodimer-1 and calcein AM. Viable cells are depicted in green, while nonviable cells are shown in red. Scale bar, 500 μmCC BY · PubMed Central
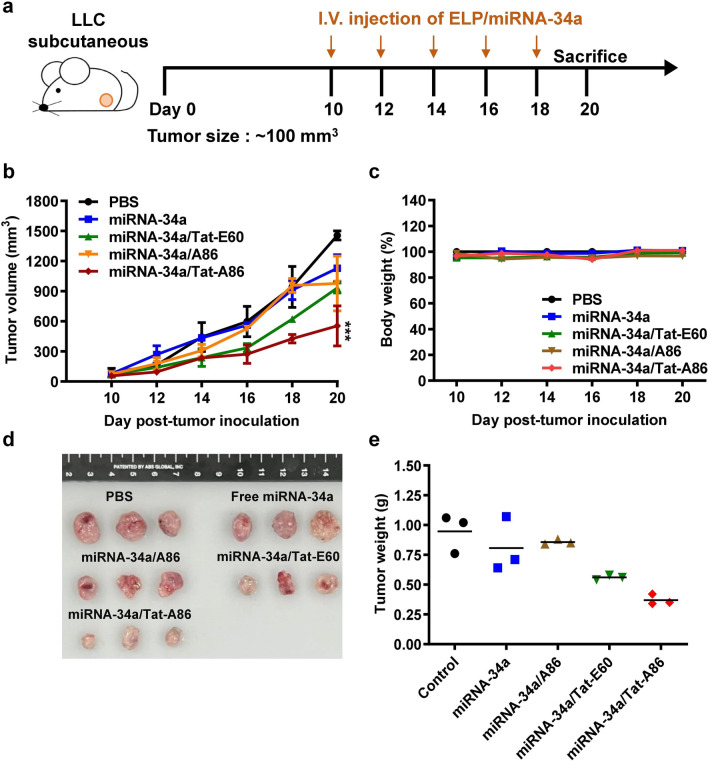
Fig. 9 The antitumor effect of miRNA-34a/ELPs in vivo. a LLC allograft mice were randomly divided into five groups and administered intravenous injections of either free miRNA-34a (6 mg/kg) or miRNA-34a/ELPs (6 mg/kg on days 1, 3, 6, 8, and 10). Tumor volumes (mm3) were monitored every after 3 days for 20 days. b Tumor volumes are presented as mean ± SD (n = 5 per group). c The average body weight of each group is expressed as the mean ± SD (n = 5 per group). d Tumors in each group, including the control (PBS), free miRNA-34a, Tat-E60, A86, and Tat-A86 groups, were excised and photographed after 20 days. e Average tumor weight in each group at the end of the experiments. Columns represent the mean for three replicate determinations, while bars indicate SD. ***P < 0.001 indicates the statistically significant difference in the miRNA-34a/Tat-A86-treated group compared to the control PBS group
Fig. 9 The antitumor effect of miRNA-34a/ELPs in vivo. a LLC allograft mice were randomly divided into five groups and administered intravenous injections of either free miRNA-34a (6 mg/kg) or miRNA-34a/ELPs (6 mg/kg on days 1, 3, 6, 8, and 10). Tumor volumes (mm3) were monitored every after 3 days for 20 days. b Tumor volumes are presented as mean ± SD (n = 5 per group). c The average body weight of each group is expressed as the mean ± SD (n = 5 per group). d Tumors in each group, including the control (PBS), free miRNA-34a, Tat-E60, A86, and Tat-A86 groups, were excised and photographed after 20 days. e Average tumor weight in each group at the end of the experiments. Columns represent the mean for three replicate determinations, while bars indicate SD. ***P < 0.001 indicates the statistically significant difference in the miRNA-34a/Tat-A86-treated group compared to the control PBS groupCC BY · PubMed Central
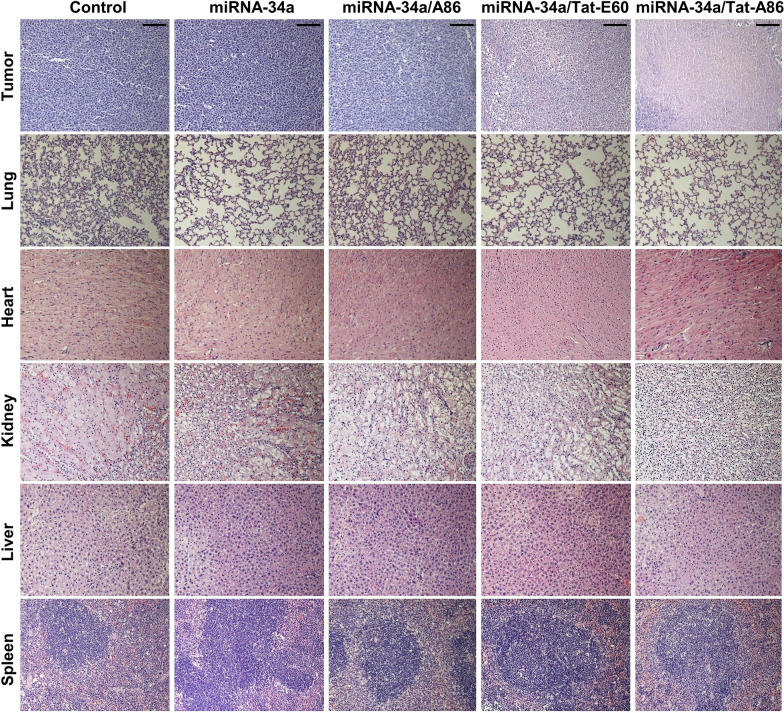
Fig. 10 Ex vivo histological analyses based on hematoxylin and eosin (H&E) staining. Following the treatment regimen, tumor sections were excised from the LCC tumor-bearing mice. Nuclei are stained in blue, while the extracellular matrix and cytoplasm are stained in red using H&E staining. Scale bar, 50 μm
Fig. 10 Ex vivo histological analyses based on hematoxylin and eosin (H&E) staining. Following the treatment regimen, tumor sections were excised from the LCC tumor-bearing mice. Nuclei are stained in blue, while the extracellular matrix and cytoplasm are stained in red using H&E staining. Scale bar, 50 μmCC BY · PubMed Central
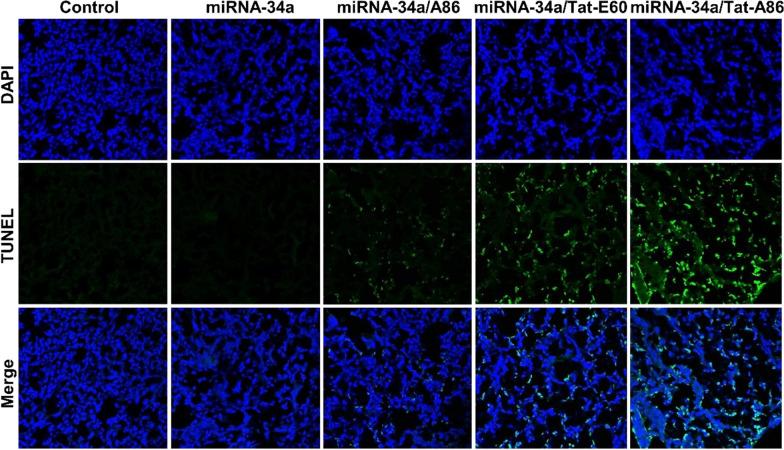
Fig. 11 Analysis of apoptosis based on terminal deoxynucleotidyl transferase (TdT)-mediated dUTP nick end labeling (TUNEL) assay. Apoptosis in tumor tissues across various groups (n = 5) was assessed through TUNEL staining. Apoptotic cells are represented by green spots, while intact DNA is marked in blue stain using DAPI. Scale bar, 50 µm
Fig. 11 Analysis of apoptosis based on terminal deoxynucleotidyl transferase (TdT)-mediated dUTP nick end labeling (TUNEL) assay. Apoptosis in tumor tissues across various groups (n = 5) was assessed through TUNEL staining. Apoptotic cells are represented by green spots, while intact DNA is marked in blue stain using DAPI. Scale bar, 50 µmCC BY · PubMed Central

Verification

Claims the paper makes

The claims and statistics of this paper haven’t been checked yet.

Run the check — free, no account needed. It reads the open-access text and checks the sources it cites.

A few free checks a day · papers already verified open instantly · results are public

Claims other papers make about this one

Each is checked against this paper’s own text: does it say what the citing paper says it does?

Self-check

Percentages, sums and reported differences re-computed from the paper’s own numbers.

The self-check needs the paper’s full text.

Citations

Cites

Show all 1 references

Research works printed but not linked: 52

  1. Wery M, Kwapisz M, Morillon A. Noncoding RNAs in gene regulation. Wiley Interdiscip Rev Syst Biol Med. 2011;3:728–38. · DOI
  2. Esquela-Kerscher A, Slack FJ. Oncomirs—microRNAs with a role in cancer. Nat Rev Cancer. 2006;6:259–69. · DOI · Paper page
  3. Menon A, Abd-Aziz N, Khalid K, Poh CL, Naidu R. miRNA: a promising therapeutic target in cancer. Int J Mol Sci. 2022;23:11502. · DOI
  4. Chang T-C, Wentzel EA, Kent OA, Ramachandran K, Mullendore M, Lee KH, et al. Transactivation of miR-34a by p53 broadly influences gene expression and promotes apoptosis. Mol Cell. 2007;26:745–52. · DOI · Paper page
  5. Corney DC, Hwang C-I, Matoso A, Vogt M, Flesken-Nikitin A, Godwin AK, et al. Frequent downregulation of miR-34 family in human ovarian cancers. Clin Cancer Res. 2010;16:1119–28. · DOI
  6. Li L, Yuan L, Luo J, Gao J, Guo J, Xie X. MiR-34a inhibits proliferation and migration of breast cancer through down-regulation of Bcl-2 and SIRT1. Clin Exp Med. 2013;13:109–17. · DOI
  7. Li Y, Guessous F, Zhang Y, DiPierro C, Kefas B, Johnson E, et al. MicroRNA-34a inhibits glioblastoma growth by targeting multiple oncogenes. Can Res. 2009;69:7569–76. · DOI · Paper page
  8. Subramanian S, Thayanithy V, West RB, Lee CH, Beck AH, Zhu S, et al. Genome-wide transcriptome analyses reveal p53 inactivation mediated loss of miR-34a expression in malignant peripheral nerve sheath tumours. J Pathol. 2010;220:58–70. · DOI
  9. Tazawa H, Tsuchiya N, Izumiya M, Nakagama H. Tumor-suppressive miR-34a induces senescence-like growth arrest through modulation of the E2F pathway in human colon cancer cells. Proc Natl Acad Sci USA. 2007;104:15472–7. · DOI
  10. Yang S, Li Y, Gao J, Zhang T, Li S, Luo A, et al. MicroRNA-34 suppresses breast cancer invasion and metastasis by directly targeting Fra-1. Oncogene. 2013;32:4294–303. · DOI
  11. He L, He X, Lim LP, De Stanchina E, Xuan Z, Liang Y, et al. A microRNA component of the p53 tumour suppressor network. Nature. 2007;447:1130–4. · DOI · Paper page
  12. Tarasov V, Jung P, Verdoodt B, Lodygin D, Epanchintsev A, Menssen A, et al. Differential regulation of microRNAs by p53 revealed by massively parallel sequencing: miR-34a is a p53 target that induces apoptosis and G1-arrest. Cell Cycle. 2007;6:1586–93. · DOI
  13. Vogt M, Munding J, Grüner M, Liffers S-T, Verdoodt B, Hauk J, et al. Frequent concomitant inactivation of miR-34a and miR-34b/c by CpG methylation in colorectal, pancreatic, mammary, ovarian, urothelial, and renal cell carcinomas and soft tissue sarcomas. Virchows Arch. 2011;458:313–22. · DOI
  14. Bc B. Therapeutic inhibition of the miR-34 family attenuates pathological cardiac remodeling and improves heart function. Proc Natl Acad Sci USA. 2012;109:17615–20. · DOI
  15. Lal A, Thomas MP, Altschuler G, Navarro F, O’Day E, Li XL, et al. Capture of microRNA–bound mRNAs identifies the tumor suppressor miR-34a as a regulator of growth factor signaling. PLoS Genet. 2011;7: e1002363. · DOI
  16. Sobczak-Kupiec A, Iqbal MJ, Qureshi MZ, Mansoor Q, Nabavi SM, Purenovic J, et al. Role of TRAIL and miR-34a as therapeutic agents in prostate cancer: increasing the armory of micro-musketeers. In: Farooqi AA, Ismail M, editors., et al., Molecular oncology: underlying mechanisms and translational advancements. Cham: Springer; 2017. p. 237–45. · DOI
  17. Cho WC. MicroRNAs as therapeutic targets for lung cancer. Expert Opin Ther Targets. 2010;14:1005–8. · DOI
  18. Bader AG, Brown D, Winkler M. The promise of microRNA replacement therapy. Can Res. 2010;70:7027–30. · DOI
  19. Iqbal MJ, Javed Z, Sadia H, Mehmood S, Akbar A, Zahid B, et al. Targeted therapy using nanocomposite delivery systems in cancer treatment: highlighting miR34a regulation for clinical applications. Cancer Cell Int. 2023;23:84. · DOI
  20. Ji Q, Hao X, Zhang M, Tang W, Yang M, Li L, et al. MicroRNA miR-34 inhibits human pancreatic cancer tumor-initiating cells. PLoS ONE. 2009;4: e6816. · DOI
  21. Ji Q, Hao X, Meng Y, Zhang M, DeSano J, Fan D, et al. Restoration of tumor suppressor miR-34 inhibits human p53-mutant gastric cancer tumorspheres. BMC Cancer. 2008;8:1–12. · DOI
  22. Cheng CJ, Bahal R, Babar IA, Pincus Z, Barrera F, Liu C, et al. MicroRNA silencing for cancer therapy targeted to the tumour microenvironment. Nature. 2015;518:107–10. · DOI
  23. Fortunato O, Iorio MV. The therapeutic potential of MicroRNAs in cancer: illusion or opportunity? Pharmaceuticals. 2020;13:438. · DOI
  24. Höbel S, Koburger I, John M, Czubayko F, Hadwiger P, Vornlocher HP, et al. Polyethylenimine/small interfering RNA-mediated knockdown of vascular endothelial growth factor in vivo exerts anti-tumor effects synergistically with Bevacizumab. J Gene Med. 2010;12:287–300. · DOI
  25. Yang N. An overview of viral and nonviral delivery systems for microRNA. Int J Pharm Investig. 2015;5:179. · DOI
  26. Lee HJ, Namgung R, Kim WJ, Kim JI, Park I-K. Targeted delivery of microRNA-145 to metastatic breast cancer by peptide conjugated branched PEI gene carrier. Macromol Res. 2013;21:1201–9. · DOI
  27. Ibrahim AF, Weirauch U, Thomas M, Grünweller A, Hartmann RK, Aigner A. MicroRNA replacement therapy for miR-145 and miR-33a is efficacious in a model of colon carcinoma. Can Res. 2011;71:5214–24. · DOI
  28. Cosco D, Cilurzo F, Maiuolo J, Federico C, Di Martino MT, Cristiano MC, et al. Delivery of miR-34a by chitosan/PLGA nanoplexes for the anticancer treatment of multiple myeloma. Sci Rep. 2015;5:17579. · DOI
  29. Saraiva C, Talhada D, Rai A, Ferreira R, Ferreira L, Bernardino L, et al. MicroRNA-124-loaded nanoparticles increase survival and neuronal differentiation of neural stem cells in vitro but do not contribute to stroke outcome in vivo. PLoS ONE. 2018;13: e0193609. · DOI
  30. Liu Q, Li R-T, Qian H-Q, Wei J, Xie L, Shen J, et al. Targeted delivery of miR-200c/DOC to inhibit cancer stem cells and cancer cells by the gelatinases-stimuli nanoparticles. Biomaterials. 2013;34:7191–203. · DOI
  31. Chiou G-Y, Cherng J-Y, Hsu H-S, Wang M-L, Tsai C-M, Lu K-H, et al. Cationic polyurethanes-short branch PEI-mediated delivery of Mir145 inhibited epithelial–mesenchymal transdifferentiation and cancer stem-like properties and in lung adenocarcinoma. J Control Release. 2012;159:240–50. · DOI
  32. Yang Y-P, Chien Y, Chiou G-Y, Cherng J-Y, Wang M-L, Lo W-L, et al. Inhibition of cancer stem cell-like properties and reduced chemoradioresistance of glioblastoma using microRNA145 with cationic polyurethane-short branch PEI. Biomaterials. 2012;33:1462–76. · DOI
  33. Cun D, Jensen DK, Maltesen MJ, Bunker M, Whiteside P, Scurr D, et al. High loading efficiency and sustained release of siRNA encapsulated in PLGA nanoparticles: quality by design optimization and characterization. Eur J Pharm Biopharm. 2011;77:26–35. · DOI
  34. Decuzzi P, Godin B, Tanaka T, Lee S-Y, Chiappini C, Liu X, et al. Size and shape effects in the biodistribution of intravascularly injected particles. J Control Release. 2010;141:320–7. · DOI
  35. Kim SH, Mok H, Jeong JH, Kim SW, Park TG. Comparative evaluation of target-specific GFP gene silencing efficiencies for antisense ODN, synthetic siRNA, and siRNA plasmid complexed with PEI− PEG− FOL conjugate. Bioconjug Chem. 2006;17:241–4. · DOI
  36. Chen X, Gu S, Chen B-F, Shen W-L, Yin Z, Xu G-W, et al. Nanoparticle delivery of stable miR-199a-5p agomir improves the osteogenesis of human mesenchymal stem cells via the HIF1a pathway. Biomaterials. 2015;53:239–50. · DOI
  37. Nguyen J, Szoka FC. Nucleic acid delivery: the missing pieces of the puzzle? Acc Chem Res. 2012;45:1153–62. · DOI
  38. Chen T-HH, Bae Y, Furgeson DY. Intelligent biosynthetic nanobiomaterials (IBNs) for hyperthermic gene delivery. Pharm Res. 2008;25:683–91. · DOI
  39. Wang J, Dzuricky M, Chilkoti A. The weak link: optimization of the ligand-nanoparticle interface to enhance cancer cell targeting by polymer micelles. Nano Lett. 2017;17:5995–6005. · DOI
  40. Chilkoti A, Dreher MR, Meyer DE. Design of thermally responsive, recombinant polypeptide carriers for targeted drug delivery. Adv Drug Deliv Rev. 2002;54:1093–111. · DOI
  41. Monfort DA, Koria P. Recombinant elastin-based nanoparticles for targeted gene therapy. Gene Ther. 2017;24:610–20. · DOI
  42. Dash BC, Mahor S, Carroll O, Mathew A, Wang W, Woodhouse KA, et al. Tunable elastin-like polypeptide hollow sphere as a high payload and controlled delivery gene depot. J Control Release. 2011;152:382–92. · DOI
  43. Dreher MR, Raucher D, Balu N, Colvin OM, Ludeman SM, Chilkoti A. Evaluation of an elastin-like polypeptide–doxorubicin conjugate for cancer therapy. J Control Release. 2003;91:31–43. · DOI
  44. Sarangthem V, Seo B-Y, Yi A, Lee Y-J, Cheon S-H, Kim SK, et al. Effects of molecular weight and structural conformation of multivalent-based elastin-like polypeptides on tumor accumulation and tissue biodistribution. Nanotheranostics. 2020;4:57. · DOI
  45. Wang X, Zhou J, Han M, Chen C, Zheng Y, He X, et al. MicroRNA-34 a regulates liver regeneration and the development of liver cancer in rats by targeting notch signaling pathway. Oncotarget. 2017;8(8):13264–76. · DOI
  46. Cai H, Zhou H, Miao Y, Li N, Zhao L, Jia L. MiRNA expression profiles reveal the involvement of miR-26a, miR-548l and miR-34a in hepatocellular carcinoma progression through regulation of ST3GAL5. Lab Invest. 2017;97:530–42. · DOI
  47. Bader AG. miR-34–a microRNA replacement therapy is headed to the clinic. Front Genet. 2012;3:120. · DOI
  48. Daige CL, Wiggins JF, Priddy L, Nelligan-Davis T, Zhao J, Brown D. Systemic delivery of a miR34a mimic as a potential therapeutic for liver cancer. Mol Cancer Ther. 2014;13:2352–60. · DOI
  49. Urry DW. Free energy transduction in polypeptides and proteins based on inverse temperature transitions. Prog Biophys Mol Biol. 1992;57:23–57. · DOI
  50. Bommer GT, Gerin I, Feng Y, Kaczorowski AJ, Kuick R, Love RE, et al. p53-mediated activation of miRNA34 candidate tumor-suppressor genes. Curr Biol. 2007;17:1298–307. · DOI
  51. Stark GR, Taylor WR. Analyzing the G2/M checkpoint. In: Schonthal AH, editor. Checkpoint controls and cancer. Reviews and model systems, vol. 1. Cham: Springer; 2004. p. 51–82. · DOI
  52. Cuddihy AR, O’Connell MJ. Cell-cycle responses to DNA damage in G2. Int Rev Cytol. 2003;222:99–140. · DOI · Paper page

Cited by

Sorted by citations

Metadata

Authors
Hong, J., Sim, D., Lee, B.-H., Sarangthem, V., & Park, R.-W.
Venue
Journal of Nanobiotechnology
Published
2024-05-27
Volume
22
Issue
1
ISSN
1477-3155
Cited by
22
References
1
Language
en
Funders
  • National Research Foundation of Korea (2021R1A5A2021614)
  • Brain Korea 21(BK21), Republic of Korea (4199990714163)

About these checks

Registry, retraction, Cites and statistics results are computed, not judged, with one exception: a printed reference that no index lists is read once by a model before it counts as a citation error. Claims are extracted by a model and kept only when their quote appears verbatim in the text; each cited source is then checked, with a model’s help, for whether it says what the claim relies on. Those verdicts can be wrong — read the claim’s quote and the cited source before relying on one.

Statistics and arithmetic are recomputed, not judged.

Confidence bands are shown only for fields calibrated on our annotated test set. None is calibrated yet, so no band is shown.

What counts as a claim ›How we measure confidence ›How we check this ›

Are you an author, or do you see a problem with this page? Request a review