Cited by 11

The DOI matches its Crossref record; 1 of the 1 references it cites were found in a registry or an index.

miFRame: analysis and visualization of miRNA sequencing data in neurological disorders

Backes, Christina, Haas, Jan, Leidinger, Petra, Frese, Karen, Großmann, Thomas, Ruprecht, Klemens, Meder, Benjamin, Meese, Eckart, Keller, Andreas·2015·Journal of Translational Medicine

Overview

The claims and statistics of this paper haven’t been checked yet.

Run the check — free, no account needed. It reads the open-access text and checks the sources it cites.

A few free checks a day · papers already verified open instantly · results are public

Integrity signals

Registry

Crossref · 10.1186/s12967-015-0594-x

Cites

1 of 1 references verified0 citation errors · 0 not checkable

Statistics

Figures

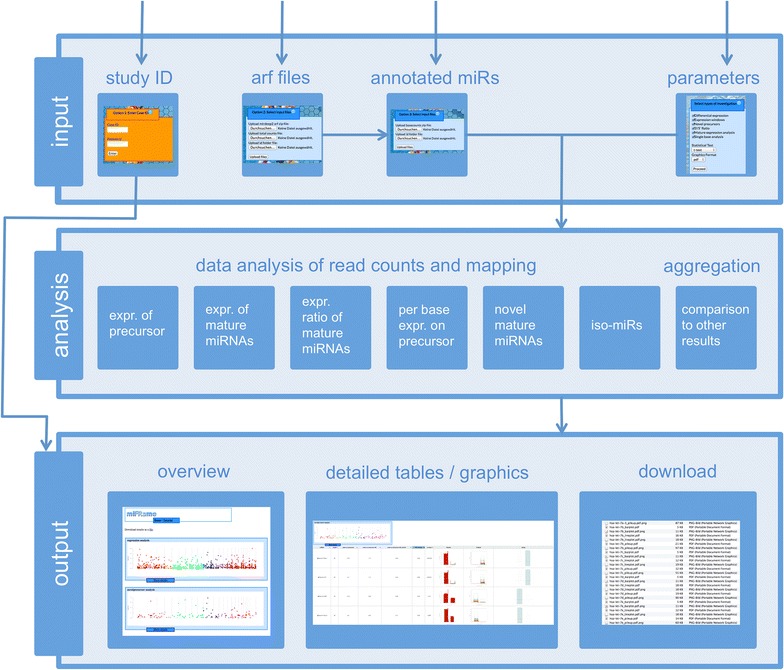
Figure 1 miFRame workflow. The figure sketches the three-layered workflow of miFRame. First, NGS data have to be uploaded along with a parameter set, next statistical analyses are carried out and finally, results are presented to the user.
Figure 1 miFRame workflow. The figure sketches the three-layered workflow of miFRame. First, NGS data have to be uploaded along with a parameter set, next statistical analyses are carried out and finally, results are presented to the user.CC BY · PubMed Central
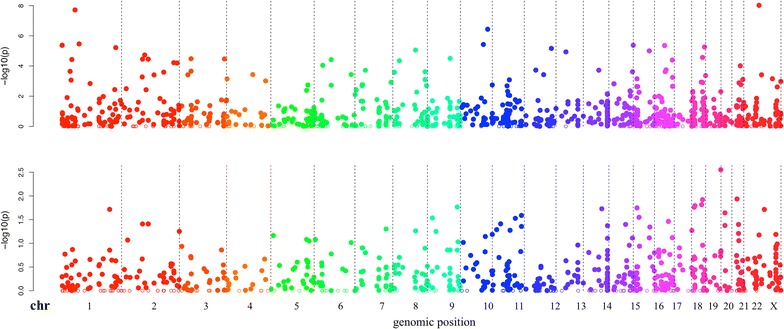
Figure 2 Manhattan plots. The results of the expression analysis for MS and AD are presented. Each microRNA included in the set is located on the genome (x-axis) and for this miRNA the negative decade logarithm is presented on the y-axis. The higher the respective data points, the more significant the results are. The graphic reveals that the AD study showed increased significance as compared to the MS study (scale on the y-axis).
Figure 2 Manhattan plots. The results of the expression analysis for MS and AD are presented. Each microRNA included in the set is located on the genome (x-axis) and for this miRNA the negative decade logarithm is presented on the y-axis. The higher the respective data points, the more significant the results are. The graphic reveals that the AD study showed increased significance as compared to the MS study (scale on the y-axis).CC BY · PubMed Central
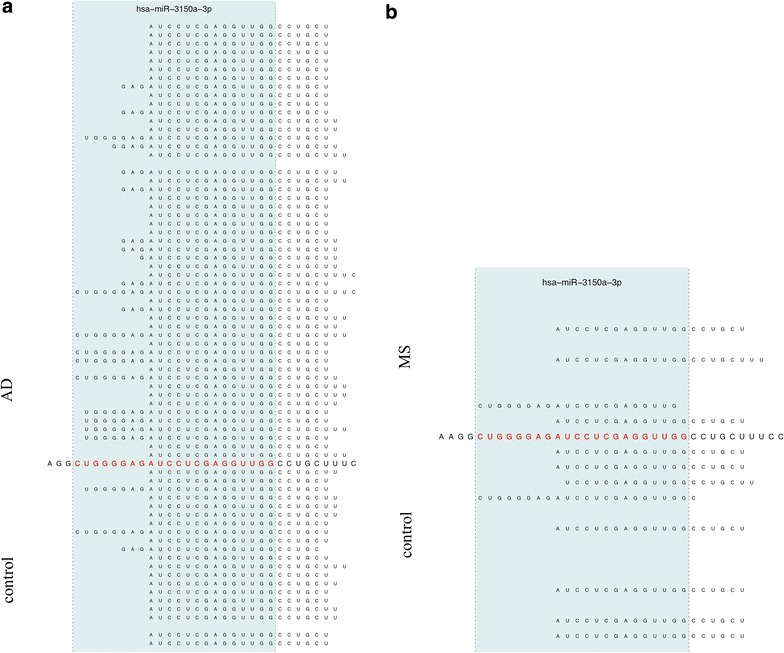
Figure 3 Pileup plot for miR-3150a-3p. The figure presents an extract of pileup plots for hsa-miR-3150a-3p in the two studies (a AD; b MS). Samples on top represent cases and on bottom controls. Each sample where at least a single read mapped to the precursor get an own line. The sequence in the middle corresponds to the precursor sequence, the mature miRNA (in this case the 3p mature form) is colored in red. The blue shaded area marks the mature part of this miRNA. In both cases, AD and MS, reads are partially mapping outside the mature form of this miRNA.
Figure 3 Pileup plot for miR-3150a-3p. The figure presents an extract of pileup plots for hsa-miR-3150a-3p in the two studies (a AD; b MS). Samples on top represent cases and on bottom controls. Each sample where at least a single read mapped to the precursor get an own line. The sequence in the middle corresponds to the precursor sequence, the mature miRNA (in this case the 3p mature form) is colored in red. The blue shaded area marks the mature part of this miRNA. In both cases, AD and MS, reads are partially mapping outside the mature form of this miRNA.CC BY · PubMed Central
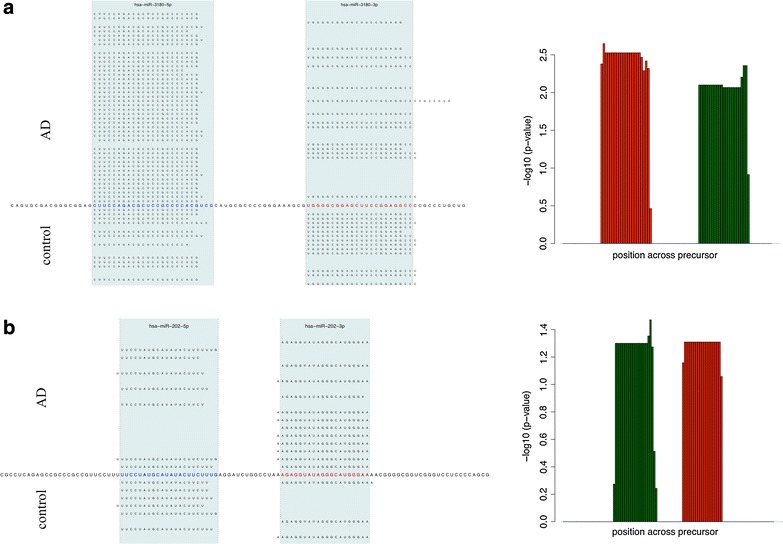
Figure 4 Expression ratio of 3p and 5p mature forms. In this figure, opposite fold changes of the 3p and the 5p mature form of miRNAs is shown for two miRNAs, miR-3180 in panel a and miR-202 in panel b. The right part shows the pileup plots, the sequence in the middle represents the precursor, the two mature forms are highlighted in red (5p) and blue (3p) and with the blue shaded area. The right hand side shows the negative decade logarithm of the p-value for each single position. Up-regulated positions on the precursor in controls are colored in green and red bars correspond tow don-regulated positions on the precursor. The two red and green blocks correspond to the two mature forms, respectively. Clearly, the 3p form is up-regulated while the 5p form is down regulated for miR-3180 (panel a) while miR-202 shows the opposite behavior (panel b).
Figure 4 Expression ratio of 3p and 5p mature forms. In this figure, opposite fold changes of the 3p and the 5p mature form of miRNAs is shown for two miRNAs, miR-3180 in panel a and miR-202 in panel b. The right part shows the pileup plots, the sequence in the middle represents the precursor, the two mature forms are highlighted in red (5p) and blue (3p) and with the blue shaded area. The right hand side shows the negative decade logarithm of the p-value for each single position. Up-regulated positions on the precursor in controls are colored in green and red bars correspond tow don-regulated positions on the precursor. The two red and green blocks correspond to the two mature forms, respectively. Clearly, the 3p form is up-regulated while the 5p form is down regulated for miR-3180 (panel a) while miR-202 shows the opposite behavior (panel b).CC BY · PubMed Central
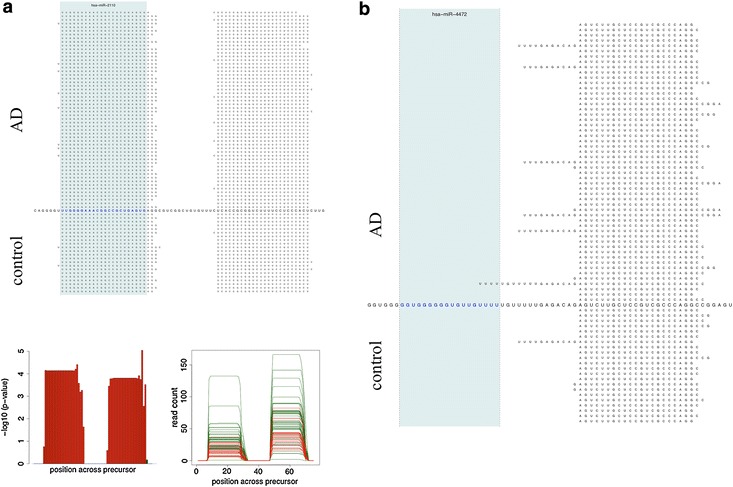
Figure 5 a Potential novel mature miRNA. The upper part of the figure presents the pileup plot (similar to Figures 3, 4). Just one mature form is annotated in miRBase V20, namely the 5p form (colored in red and shaded in blue). Nevertheless, many reads map to the position where a 3p version could be located. The lower right part shows the significant down-regulation of this miRNA in controls as compared to Alzheimer Disease patients. The lower left image presents beyond the significance the absolute rad count per sample. Green samples correspond to cases and red samples to controls. b For miR-4472, just one mature form (5p) is annotated in the miRBase. While we do not observe mappings to this position, we observe mappings to the position where the 3p mature form could be expected.
Figure 5 a Potential novel mature miRNA. The upper part of the figure presents the pileup plot (similar to Figures 3, 4). Just one mature form is annotated in miRBase V20, namely the 5p form (colored in red and shaded in blue). Nevertheless, many reads map to the position where a 3p version could be located. The lower right part shows the significant down-regulation of this miRNA in controls as compared to Alzheimer Disease patients. The lower left image presents beyond the significance the absolute rad count per sample. Green samples correspond to cases and red samples to controls. b For miR-4472, just one mature form (5p) is annotated in the miRBase. While we do not observe mappings to this position, we observe mappings to the position where the 3p mature form could be expected.CC BY · PubMed Central
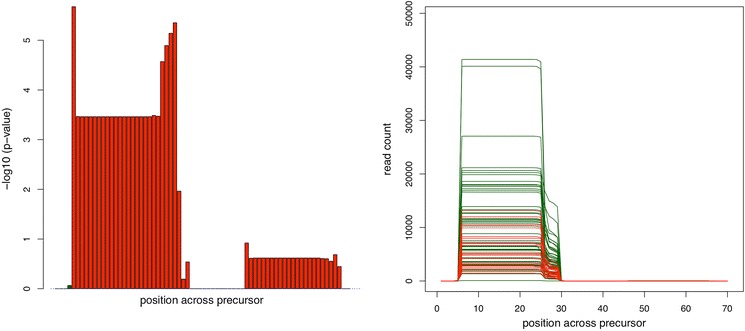
Figure 6 potential isoforms of miR-30d-5p. The bar-plot on the right hand side shows increased significance at the edges of miR-30d-5p. In this case, Alzheimer Disease patients have higher expression on few base positions outside the annotated miRNA. This can be also seen on the read distribution plot on the right hand side. At position 26–29, Alzheimer Disease patients (green) have significantly higher coverage than controls.
Figure 6 potential isoforms of miR-30d-5p. The bar-plot on the right hand side shows increased significance at the edges of miR-30d-5p. In this case, Alzheimer Disease patients have higher expression on few base positions outside the annotated miRNA. This can be also seen on the read distribution plot on the right hand side. At position 26–29, Alzheimer Disease patients (green) have significantly higher coverage than controls.CC BY · PubMed Central
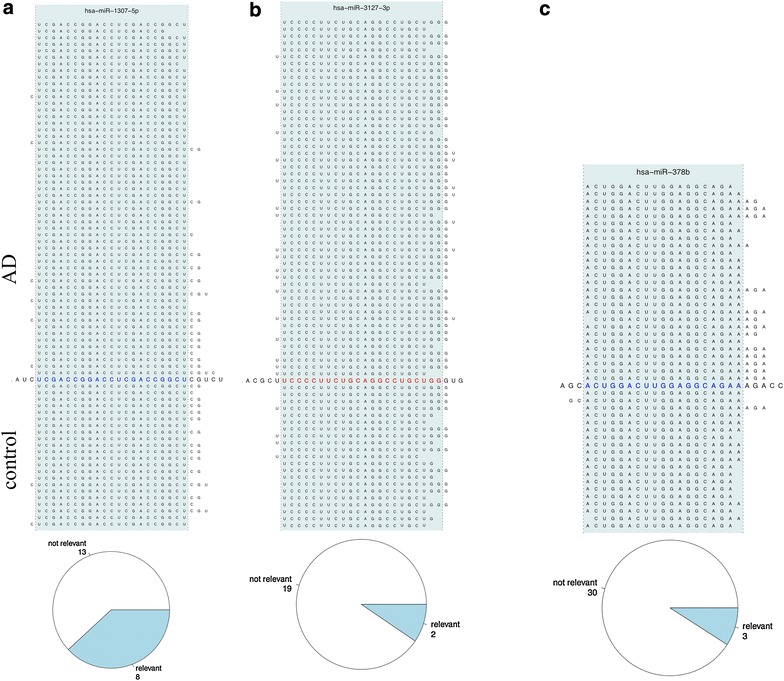
Figure 7 a Pileup plot for miR-1307. In case of miR-1307-5p, control patients show increased frequency of 1–2 base shifts at the 3p end. The pie diagram at the lower part of the figure shows that around one-third of all analyses revealed respective iso-forms. b Pileup plot for miR-3172. For miR-3127-3p, AD samples are frequently shifted by 1–2 bases to the 3p end of this miRNA. The pie chart as result of the aggregation analysis indicates that respective results are usually not observed. c Pileup plot for miR-378b. Extended mappings at the 3p end of this miRNA are almost exclusively observed for AD patients.
Figure 7 a Pileup plot for miR-1307. In case of miR-1307-5p, control patients show increased frequency of 1–2 base shifts at the 3p end. The pie diagram at the lower part of the figure shows that around one-third of all analyses revealed respective iso-forms. b Pileup plot for miR-3172. For miR-3127-3p, AD samples are frequently shifted by 1–2 bases to the 3p end of this miRNA. The pie chart as result of the aggregation analysis indicates that respective results are usually not observed. c Pileup plot for miR-378b. Extended mappings at the 3p end of this miRNA are almost exclusively observed for AD patients.CC BY · PubMed Central

Verification

Claims the paper makes

The claims and statistics of this paper haven’t been checked yet.

Run the check — free, no account needed. It reads the open-access text and checks the sources it cites.

A few free checks a day · papers already verified open instantly · results are public

Claims other papers make about this one

Each is checked against this paper’s own text: does it say what the citing paper says it does?

Self-check

Percentages, sums and reported differences re-computed from the paper’s own numbers.

The self-check needs the paper’s full text.

Citations

Cites

Research works printed but not linked: 17

  1. Wang WC, Lin FM, Chang WC, Lin KY, Huang HD, Lin NS (2009) miRExpress: analyzing high-throughput sequencing data for profiling microRNA expression. BMC Bioinform 10:328 · DOI
  2. Hackenberg M, Rodriguez-Ezpeleta N, Aransay AM (2011) miRanalyzer: an update on the detection and analysis of microRNAs in high-throughput sequencing experiments. Nucleic Acids Res 39:W132–W138 · DOI
  3. Hackenberg M, Sturm M, Langenberger D, Falcon-Perez JM, Aransay AM (2009) miRanalyzer: a microRNA detection and analysis tool for next-generation sequencing experiments. Nucleic Acids Res 37:W68–W76 · DOI
  4. Pantano L, Estivill X, Marti E (2010) SeqBuster, a bioinformatic tool for the processing and analysis of small RNAs datasets, reveals ubiquitous miRNA modifications in human embryonic cells. Nucleic Acids Res 38:e34 · DOI
  5. Wu J, Liu Q, Wang X, Zheng J, Wang T, You M et al (2013) mirTools 2.0 for non-coding RNA discovery, profiling, and functional annotation based on high-throughput sequencing. RNA Biol 10:1087–1092 · DOI
  6. Zhu E, Zhao F, Xu G, Hou H, Zhou L, Li X et al (2010) mirTools: microRNA profiling and discovery based on high-throughput sequencing. Nucleic Acids Res 38:W392–W397 · DOI
  7. Fasold M, Langenberger D, Binder H, Stadler PF, Hoffmann S (2011) DARIO: a ncRNA detection and analysis tool for next-generation sequencing experiments. Nucleic Acids Res 39(Web Server issue):W112–W117. doi: 10.1093/nar/gkr357 · DOI
  8. Zhao W, Liu W, Tian D, Tang B, Wang Y, Yu C et al (2011) wapRNA: a web-based application for the processing of RNA sequences. Bioinformatics 27:3076–3077 · DOI
  9. Yuan T, Huang X, Dittmar RL, Du M, Kohli M, Boardman L et al (2014) eRNA: a graphic user interface-based tool optimized for large data analysis from high-throughput RNA sequencing. BMC Genom 15:176 · DOI
  10. Buermans HP, Ariyurek Y, van Ommen G, den Dunnen JT, t Hoen PA (2010) New methods for next generation sequencing based microRNA expression profiling. BMC Genom 11:716 · DOI
  11. Friedlander MR, Chen W, Adamidi C, Maaskola J, Einspanier R, Knespel S et al (2008) Discovering microRNAs from deep sequencing data using miRDeep. Nat Biotech 26:407–415 · DOI
  12. Friedländer MR, Mackowiak SD, Li N, Chen W, Rajewsky N (2012) miRDeep2 accurately identifies known and hundreds of novel microRNA genes in seven animal clades. Nucleic Acids Res 40(1):37–52. doi: 10.1093/nar/gkr688 · DOI · Paper page
  13. Zhang Y, Xu B, Yang Y, Ban R, Zhang H, Jiang X et al (2012) CPSS: a computational platform for the analysis of small RNA deep sequencing data. Bioinformatics 28:1925–1927 · DOI
  14. Muller S, Rycak L, Winter P, Kahl G, Koch I, Rotter B (2013) omiRas: a Web server for differential expression analysis of miRNAs derived from small RNA-Seq data. Bioinformatics 29:2651–2652 · DOI
  15. Seguin J, Otten P, Baerlocher L, Farinelli L, Pooggin MM (2014) MISIS: a bioinformatics tool to view and analyze maps of small RNAs derived from viruses and genomic loci generating multiple small RNAs. J Virol Methods 195:120–122 · DOI
  16. Leidinger P, Backes C, Deutscher S, Schmitt K, Mueller SC, Frese K et al (2013) A blood based 12-miRNA signature of Alzheimer disease patients. Genome Biol 14:R78 · DOI
  17. Keller A, Leidinger P, Steinmeyer F, Stahler C, Franke A, Hemmrich-Stanisak G et al (2014) Comprehensive analysis of microRNA profiles in multiple sclerosis including next-generation sequencing. Mult Scler 20:295–303 · DOI

Cited by

Sorted by citations

See all 11

Metadata

Authors
Backes, C., Haas, J., Leidinger, P., Frese, K., Großmann, T., Ruprecht, K., Meder, B., Meese, E., & Keller, A.
Venue
Journal of Translational Medicine
Published
2015-07-14
Volume
13
Issue
1
ISSN
1479-5876
Cited by
11
References
1
Language
en

About these checks

Registry, retraction, Cites and statistics results are computed, not judged, with one exception: a printed reference that no index lists is read once by a model before it counts as a citation error. Claims are extracted by a model and kept only when their quote appears verbatim in the text; each cited source is then checked, with a model’s help, for whether it says what the claim relies on. Those verdicts can be wrong — read the claim’s quote and the cited source before relying on one.

Statistics and arithmetic are recomputed, not judged.

Confidence bands are shown only for fields calibrated on our annotated test set. None is calibrated yet, so no band is shown.

What counts as a claim ›How we measure confidence ›How we check this ›

Are you an author, or do you see a problem with this page? Request a review