

The DOI matches its Crossref record; 65 of the 65 references it cites were found in a registry or an index.
SLC7A11 regulated by NRF2 modulates esophageal squamous cell carcinoma radiosensitivity by inhibiting ferroptosis
Open accessAbstract
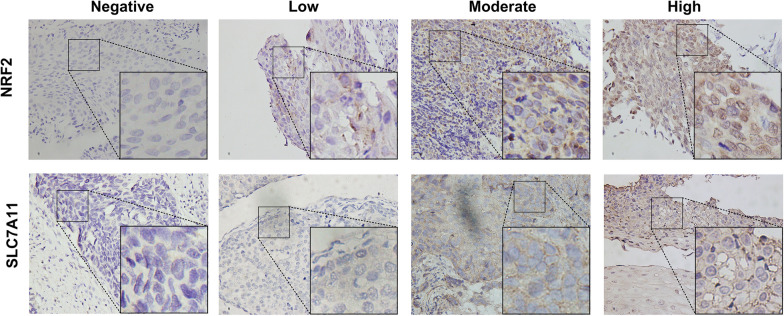
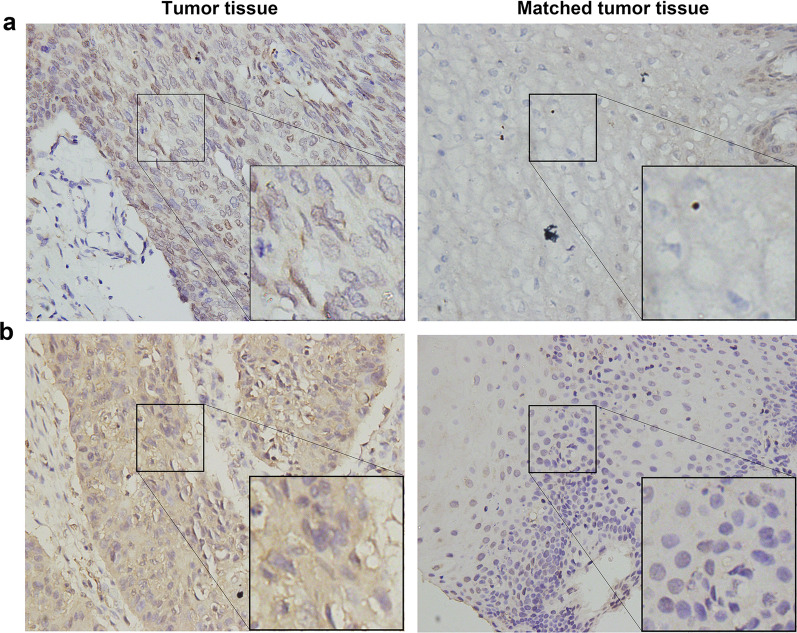
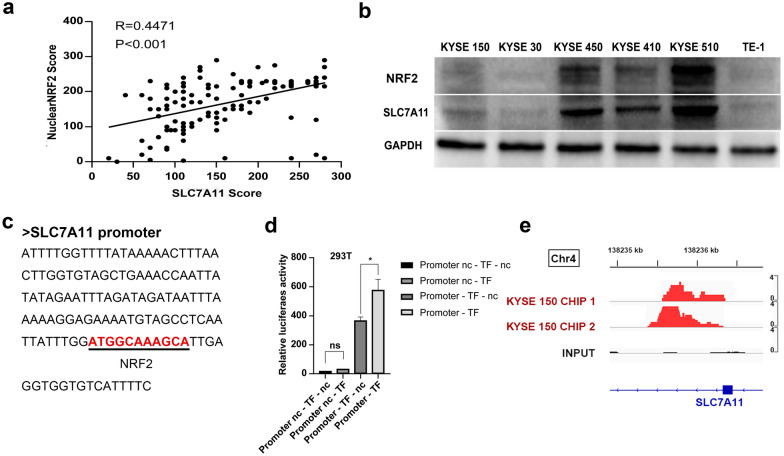
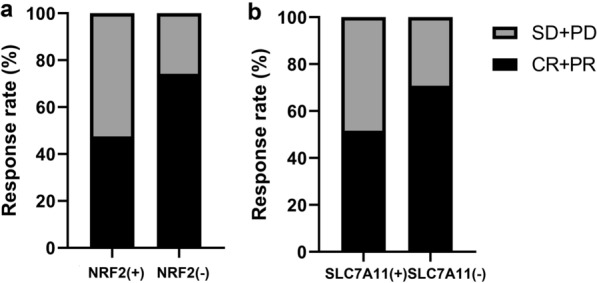
Background: Solute carrier family 7 member 11(SLC7A11) is a component of cysteine/glutamate transporter, which plays a key role in tumor growth; however, its underlying effect on radiosensitivity in esophageal squamous cell carcinoma (ESCC) remains unclear. This study aimed to clarify SLC7A11’s expression and correlation with nuclear expression of nuclear factor erythroid-2 ( NRF2)-associated radioresistance in ESCC. Methods: We included 127 ESCC patients who received radical chemoradiotherapy. Immunohistochemical staining was used to detect SLC7A11 and NRF2 nuclear expression, and the relationship between clinicopathological characteristics and survival rates or therapy response were evaluated. Western blot, dual-reporter assays and Chromatin immunoprecipitation (ChIP)-sequencing were used to analyze their relationship in vitro. Their roles in radioresistance were then investigated through multiple validation steps. Results: NRF2 nuclear expression and SLC7A11 expression were overexpressed in ESCC tissues and were positively correlated with one another. NRF2 nuclear expression was significantly associated with tumor length, lymph node metastasis, and TNM stage, while SLC7A11 expression was associated with lymph node metastasis. Patients with high NRF2 nuclear expression and SLC7A11 expression had significantly shorter overall and progression-free survival, and poor treatment response. The multivariate model showed that NRF2 nuclear expression and SLC7A11 expression, sex and tumor location are independent prognostic factors. In vitro analysis confirmed that hyperactivation of NRF2 induced SLC7A11 expression by directly binding to its promoter region, promoting radioresistance, reducing radiotherapy-induced lipid peroxidation levels, PTGS2 expression, and radiotherapy-related ferroptosis morphologic features. Conclusion: Our study reveals a connection between high SLC7A11 expression and NRF2 nuclear expression in patients with ESCC that was related to worse survival and poorer therapy outcomes. SLC7A11-mediated ferroptosis inhibition induced NRF2-associated radioresistance, highlighting potential of NRF2/SLC7A11/ferroptosis axis as future therapeutic targets against therapy resistance biomarker.
Overview
The claims and statistics of this paper haven’t been checked yet.
Run the check — free, no account needed. It reads the open-access text and checks the sources it cites.
Integrity signals
Registry
Cites
Statistics
Figures
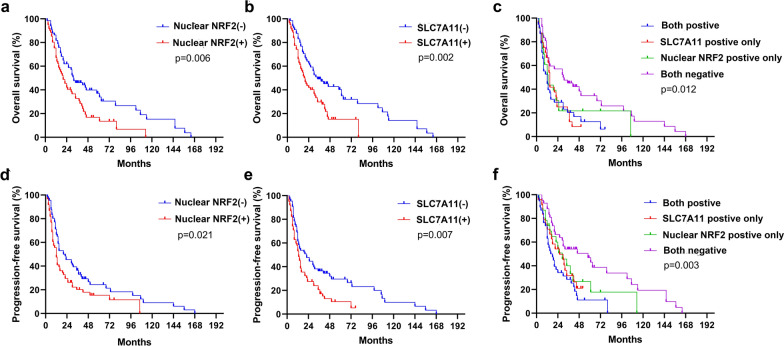
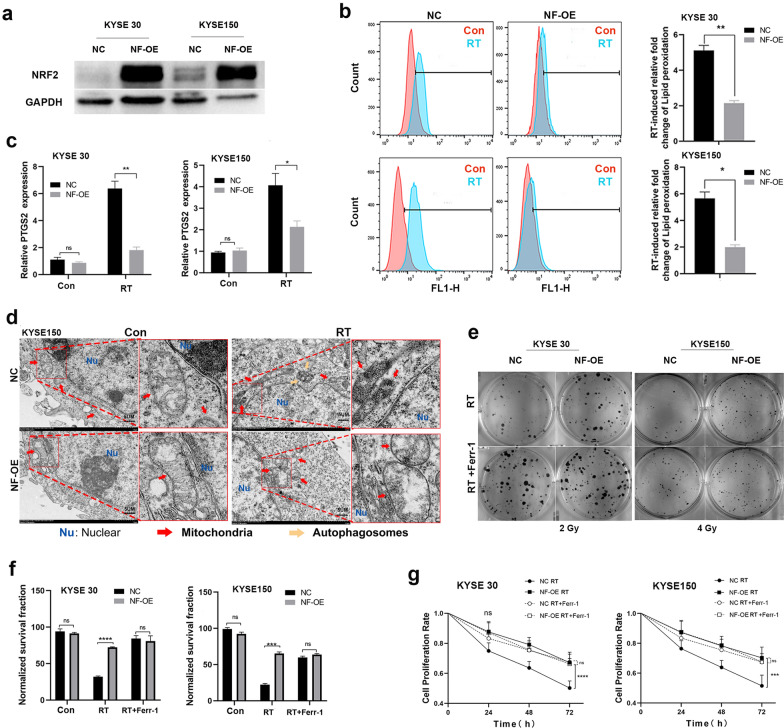
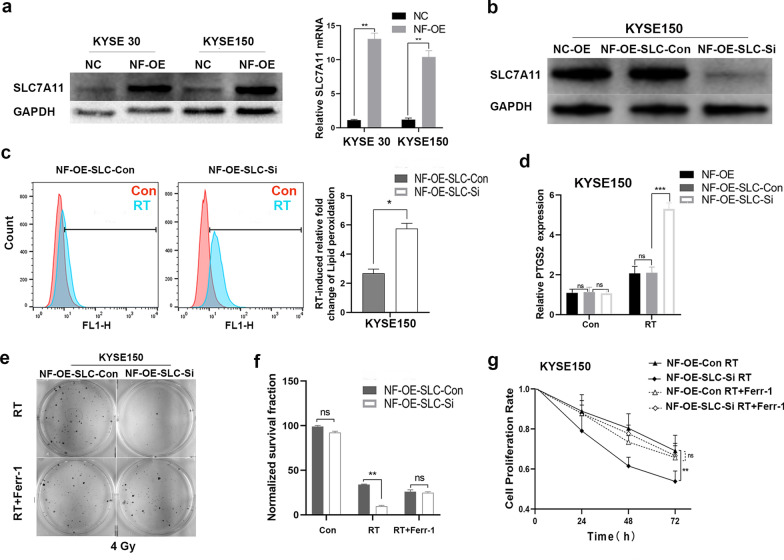
Verification
Claims the paper makes
The claims and statistics of this paper haven’t been checked yet.
Run the check — free, no account needed. It reads the open-access text and checks the sources it cites.
Claims other papers make about this one
Each is checked against this paper’s own text: does it say what the citing paper says it does?
The source backs part of the claim, not all of it — or backs it for a different population, condition or comparison.
In the citing paper
“and increased the expression of known target genes of this transcription factor including SLC7A11, AKR1C1, and FTH1 (fig. S5S) (41–45).”
From Secreted Apoe rewires melanoma cell state vulnerability to ferroptosis (2024) · cites this paper as [43]
Experimental — accuracy not yet measured
Self-check
Percentages, sums and reported differences re-computed from the paper’s own numbers.
The self-check needs the paper’s full text.
Citations
Cites
Ferroptosis: An Iron-Dependent Form of Nonapoptotic Cell Death
Dixon, S. J., Lemberg, K. M., Lamprecht, M. R., Skouta, R., Zaitsev, E. M., Gleason, C. E., Patel, D. N., Bauer, A. J., Cantley, A. M., Yang, W. S., et al. (2012) · Cell · doi:10.1016/j.cell.2012.03.042 · Cited by 18,691
Ferroptosis: A Regulated Cell Death Nexus Linking Metabolism, Redox Biology, and Disease
Stockwell, B. R., Friedmann Angeli, J. P., Bayir, H., Bush, A. I., Conrad, M., Dixon, S. J., Fulda, S., Gascón, S., Hatzios, S. K., Kagan, V. E., et al. (2017) · Cell · doi:10.1016/j.cell.2017.09.021 · Cited by 7,695
Ferroptosis: process and function
Xie, Y., Hou, W., Song, X., Yu, Y., Huang, J., Sun, X., Kang, R., & Tang, D. (2016) · Cell Death & Differentiation · doi:10.1038/cdd.2015.158 · Cited by 3,727
Cystine transporter SLC7A11/xCT in cancer: ferroptosis, nutrient dependency, and cancer therapy
Koppula, P., Zhuang, L., & Gan, B. (2020) · Protein & Cell · doi:10.1007/s13238-020-00789-5 · Cited by 2,640
NRF2 plays a critical role in mitigating lipid peroxidation and ferroptosis
Dodson, M., Castro-Portuguez, R., & Zhang, D. D. (2019) · Redox Biology · doi:10.1016/j.redox.2019.101107 · Cited by 2,435
Reactive Oxygen Species-Induced Lipid Peroxidation in Apoptosis, Autophagy, and Ferroptosis
Su, L.-J., Zhang, J.-H., Gomez, H., Murugan, R., Hong, X., Xu, D., Jiang, F., & Peng, Z.-Y. (2019) · Oxidative Medicine and Cellular Longevity · doi:10.1155/2019/5080843 · Cited by 2,166
Self-citationSun, X., Ou, Z., Chen, R., Niu, X., Chen, D., Kang, R., & Tang, D. (2016) · Hepatology · doi:10.1002/hep.28251 · Cited by 2,012
JASPAR 2020: update of the open-access database of transcription factor binding profiles
Fornes, O., Castro-Mondragon, J. A., Khan, A., van der Lee, R., Zhang, X., Richmond, P. A., Modi, B. P., Correard, S., Gheorghe, M., Baranašić, D., et al. (2019) · Nucleic Acids Research · doi:10.1093/nar/gkz1001 · Cited by 1,763
NRF2 and the Hallmarks of Cancer
Rojo de la Vega, M., Chapman, E., & Zhang, D. D. (2018) · Cancer Cell · doi:10.1016/j.ccell.2018.03.022 · Cited by 1,672
The role of ferroptosis in ionizing radiation-induced cell death and tumor suppression
Lei, G., Zhang, Y., Koppula, P., Liu, X., Zhang, J., Lin, S. H., Ajani, J. A., Xiao, Q., Liao, Z., Wang, H., et al. (2020) · Cell Research · doi:10.1038/s41422-019-0263-3 · Cited by 1,318
Self-citation
Research works printed but not linked: 1
- Koppula P, Zhuang L, Gan B. Cystine transporter SLC7A11/xCT in cancer: ferroptosis, nutrient dependency, and cancer therapy. Protein Cell. 2020. https://doi.org/10.1007/s13238-020-00789-5. · DOI
Cited by
Sorted by citations
Items 101–200 of 275
Zhang, H., Zhang, J., Luan, S., Liu, Z., Li, X., Liu, B., & Yuan, Y. (2023) · International Journal of Biological Sciences · doi:10.7150/ijbs.85753 · Cited by 17
Self-citationXu, Q., Zhang, Z., Tang, M., Xing, C., Chen, H., Zheng, K., Zhao, Z., Zhou, S., Zhao, A. Z., Li, F., et al. (2023) · Free Radical Biology and Medicine · doi:10.1016/j.freeradbiomed.2023.03.005 · Cited by 16
Upregulation of CDGSH iron sulfur domain 2 attenuates cerebral ischemia/reperfusion injury
Dong, S., Hu, M., Huang, J., Chen, L., Sun, X., Yao, Z., Tong, X., Jin, W.-J., & Zhang, Y. (2022) · Neural Regeneration Research · doi:10.4103/1673-5374.355766 · Cited by 16
Chen, F., & Wang, L. (2023) · Discover Oncology · doi:10.1007/s12672-023-00761-9 · Cited by 16
Jin, Y., Pan, S., Wang, M., Huang, S. H., Ke, Y., Li, D., Luo, H., Kou, Z., Shi, D., Kou, W., et al. (2024) · Cell Biology International · doi:10.1002/cbin.12245 · Cited by 16
Role of ferroptosis in esophageal cancer and corresponding immunotherapy
Fan, X., Fan, Y.-T., Zeng, H., Dong, X.-Q., Lu, M., & Zhang, Z. (2023) · World Journal of Gastrointestinal Oncology · doi:10.4251/wjgo.v15.i7.1105 · Cited by 14
Hu, Z., Chen, Y., Yang, S., Diao, S., Ma, L., & Shi, C. (2025) · MedComm · doi:10.1002/mco2.70478 · Cited by 22
Wang, J., Hao, S., Song, G., Wang, Y., & Hao, Q. (2023) · PeerJ · doi:10.7717/peerj.14931 · Cited by 14
Ferroptosis in lung cancer: dual role, multi-level regulation, and new therapeutic strategies
Li, Y., Li, X., & Li, J. (2024) · Frontiers in Oncology · doi:10.3389/fonc.2024.1360638 · Cited by 15
Tang, Y., Wang, Z., Zhou, F., Li, L., Sun, C., Li, L., Tang, F., Huang, D., Li, Z., Tan, Y., et al. (2025) · Phytomedicine · doi:10.1016/j.phymed.2025.157111 · Cited by 13
Wang, W., Yan, S., Ma, M., Chen, T., Liu, C., Liang, W., Zhao, X., Zhao, K., Xue, J., Yu, H., et al. (2025) · Phytomedicine · doi:10.1016/j.phymed.2025.157470 · Cited by 13
Self-citationAdvances in the study of regulators of ferroptosis in head and neck squamous cell carcinoma (Review)
Yang, M., Guo, R., Chen, X., Song, G., & Zhang, F. (2023) · International Journal of Molecular Medicine · doi:10.3892/ijmm.2023.5248 · Cited by 12
Gui, S., Yu, W., Xie, J., et al. (2024) · Endocrine Connections · doi:10.1530/ec-24-0097 · Cited by 12
Jin, X., Lou, X., Qi, H., Zheng, C., Li, B., Siwu, X., Liu, R., Lv, Q., Zhao, A., Ruan, J., et al. (2024) · Oncogenesis · doi:10.1038/s41389-024-00536-z · Cited by 12
Self-citationHigh glucose induces podocyte ferroptosis through BAP1/SLC7A11 pathway
Ren, P., Man, X., Wenbo, S., Danna, Z., Gong, J., Jin, J., & He, Q. (2024) · Heliyon · doi:10.1016/j.heliyon.2024.e40590 · Cited by 13
Targeting aldehyde dehydrogenase ALDH3A1 increases ferroptosis vulnerability in squamous cancer
Kong, S., Pan, H., Zhang, Y., Wang, F., Chen, J., Dong, J., Yin, C., Wu, J., Zhou, D., Peng, J., et al. (2025) · Oncogene · doi:10.1038/s41388-025-03277-4 · Cited by 14
Li, P., Wang, Z., Zhao, T. T., Cheng, X., Zhang, Z., Wang, J., Wang, S., Huang, R., & Hui, Z. (2023) · Advanced Biology · doi:10.1002/adbi.202300416 · Cited by 12
Bugajová, M., Raudenská, M., Hánělová, K., Navrátil, J., Gumulec, J., Petrlak, F., Vičar, T., Hrachovinová, Š., Masařík, M., Kalfeřt, D., et al. (2024) · Scientific Reports · doi:10.1038/s41598-024-73943-2 · Cited by 11
Wang, N., Chen, M., Wu, M., Liao, Y., Xia, Q., Cai, Z., He, C., Tang, Q., Zhou, Y., Zhao, L., et al. (2024) · Free Radical Biology and Medicine · doi:10.1016/j.freeradbiomed.2024.12.040 · Cited by 12
Plasmodium berghei-Mediated NRF2 Activation in Infected Hepatocytes Enhances Parasite Survival
Bindschedler, A., Schmuckli‐Maurer, J., Wacker, R., Kramer, N., Rehmann, R., Caldelari, R., & Heussler, V. T. (2022) · Cellular Microbiology · doi:10.1155/2022/7647976 · Cited by 11
Chen, Q., Zhang, L., Wan, C., Yang, B., Kong, X., Xu, X. P., Gu, Y., Wang, C., Liu, X., Ding, Q., et al. (2023) · International Journal of Oncology · doi:10.3892/ijo.2023.5524 · Cited by 10
Xue, Z., Nuerrula, Y., Sitiwaerdi, Y., & Eli, M. (2024) · Biomolecules and Biomedicine · doi:10.17305/bb.2024.10184 · Cited by 11
Li, D., Wan, M., Liu, X., Ojha, S. C., Sheng, Y., Li, Y., Sun, C., & Deng, C. (2024) · Aging · doi:10.18632/aging.206009 · Cited by 11
Prognostic Values of Ferroptosis-Related Proteins ACSL4, SLC7A11, and CHAC1 in Cholangiocarcinoma
Amontailak, S., Titapun, A., Jusakul, A., et al. (2024) · Biomedicines · doi:10.3390/biomedicines12092091 · Cited by 10
Huang, X., Lin, K., Chen, W., Zhang, D., Khan, M. B., Ye, X., Wang, B., Chen, C., Tian, Y., Yuan, Y., et al. (2024) · Radiotherapy and Oncology · doi:10.1016/j.radonc.2024.110686 · Cited by 13
Zhou, R., Zhou, J., Xiong, Y., Su, K., Liu, C., Cheng, B., & Wu, T. (2025) · Cellular and Molecular Life Sciences · doi:10.1007/s00018-025-05742-5 · Cited by 10
Self-citationWang, T., Zhou, X., Yin, X., Zhang, A., Fan, Y., Chen, K., Tao, H., Tang, Z., Zhang, P., He, X., et al. (2025) · International Journal of Oncology · doi:10.3892/ijo.2025.5781 · Cited by 12
Self-citationExploring the role of ferroptosis in esophageal cancer: mechanisms and therapeutic implications
Zhao, D., Li, W., Han, Z., Wang, Z., Li, D., & Li, W. (2025) · Cell Death Discovery · doi:10.1038/s41420-025-02696-2 · Cited by 12
Wang, S., Zhang, C., Zhou, S., Liu, S., Li, Q., Cheng, X., Wang, R., Chen, B., Li, Y., & Xi, M. (2025) · Drug Resistance Updates · doi:10.1016/j.drup.2025.101296 · Cited by 14
Han, S., Liu, X., Ju, S., et al. (2023) · Clinical Proteomics · doi:10.1186/s12014-023-09427-8 · Cited by 9
Self-citationXi, Y., Gao, L., Li, S.-M., Sun, K., Chen, P., Cai, Z., Ren, W., & Zhi, K. (2023) · Frontiers in Pharmacology · doi:10.3389/fphar.2023.1228985 · Cited by 9
Yan, Y., Yang, N., Qin, F., & Hao, Y. (2024) · Biomedicines · doi:10.3390/biomedicines12122728 · Cited by 9
Gao, X., Tang, M., Li, J., Ma, J., Liu, Z., & Liu, W. (2025) · Respiratory Research · doi:10.1186/s12931-025-03151-7 · Cited by 9
Aishajiang, R., Yuan, L., Du, P., Zhuo, X., Liu, S., Wei, Y., Wang, T., Lei, P., Yu, D. N., & Zhang, H. (2025) · Biomaterials · doi:10.1016/j.biomaterials.2025.123675 · Cited by 9
SHARPIN Enhances Ferroptosis in Synovial Sarcoma Cells via NF-κB- and PRMT5-Mediated PGC1α Reduction
Tamiya, H., Urushihara, N., Shizuma, K., Ogawa, H., Nakai, S., Wakamatsu, T., Takenaka, S., & Kakunaga, S. (2023) · Cancers · doi:10.3390/cancers15133484 · Cited by 9
Zheng, C., Li, Z., Zhao, C., et al. (2023) · Cell Death and Disease · doi:10.1038/s41419-023-06321-x · Cited by 9
Self-citationFu, H., Zhang, Y., Duan, Y., Zhang, X., Yao, J., Yang, D., Wei, Z., Zhu, Z., Xu, J., Hu, Z., et al. (2024) · iScience · doi:10.1016/j.isci.2024.111553 · Cited by 8
Dai, Q., Qu, T., Yang, J., Leng, J., Fang, L., Zhu, Q., Wu, K., Wu, J., Ma, J., & Yu, H. (2025) · World Journal of Gastroenterology · doi:10.3748/wjg.v31.i16.104305 · Cited by 8
Crippa, V., Cordani, N., Villa, A. M., Malighetti, F., Villa, M., Sala, L., Aroldi, A., Piazza, R., Cortinovis, D. L., Mologni, L., et al. (2025) · npj Precision Oncology · doi:10.1038/s41698-025-01088-0 · Cited by 11
CircTMEM87A promotes the tumorigenesis of gastric cancer by regulating the miR‐1276/SLC7A11 axis
Dong, X., Chen, X., Zhao, Y., et al. (2023) · Journal of Gastroenterology and Hepatology · doi:10.1111/jgh.16402 · Cited by 8
Feng, Y., Li, X., Yang, B., Li, M., Du, Y., Wang, J., Liu, S., Gong, L., Li, L., & Gao, L. (2024) · Oncology Reports · doi:10.3892/or.2024.8738 · Cited by 9
Pandey, P. K., Bhorkade, S., Jha, S., Saren, B. N., Kuche, K., & Jain, S. (2024) · Journal of Drug Delivery Science and Technology · doi:10.1016/j.jddst.2024.105998 · Cited by 8
Xia, B., Qiu, L., Yue, J., Si, J., & Zhang, H. (2024) · Biochimica et Biophysica Acta (BBA) - Reviews on Cancer · doi:10.1016/j.bbcan.2024.189190 · Cited by 11
Pan, Y., Fei, L., Wang, S., Chen, H., Jiang, C., Li, H., Wang, C., Yang, Y., Zhang, Q., & Chen, Y. (2024) · Frontiers in Immunology · doi:10.3389/fimmu.2024.1487966 · Cited by 7
Safari, M. H., Rahimzadeh, P., Alaei, E., Alimohammadi, M., Esfandiari, N., Daneshi, S., Malgard, N., Farahani, N., Taheriazam, A., & Hashemi, M. (2025) · Molecular and Cellular Probes · doi:10.1016/j.mcp.2025.102013 · Cited by 8
Wang, J., Yang, J., Xiong, D., & Chen, L. (2025) · Human & Experimental Toxicology · doi:10.1177/09603271251323753 · Cited by 7
Meng, H., Xie, Z., Xu, T., et al. (2025) · International Immunopharmacology · doi:10.1016/j.intimp.2025.115672 · Cited by 9
Peng, X., Zhao, W., Yang, F., Wei, Y., Zhang, Y., Chen, S., Wei, J. Y., Huang, J., Teng, Y., Zeng, G., et al. (2025) · Phytomedicine · doi:10.1016/j.phymed.2025.157422 · Cited by 7
Ma, J., Chen, X.-Q., & Xiang, Z. (2022) · Oxidative Medicine and Cellular Longevity · doi:10.1155/2022/7291406 · Cited by 8
Unraveling Ferroptosis: A New Frontier in Combating Renal Fibrosis and CKD Progression
Jin, R., Dai, Y., Wang, Z., Hu, Q., Zhang, C., Gao, H., & Qi, Y. (2024) · Biology · doi:10.3390/biology14010012 · Cited by 8
Li, W., Liang, L., Liu, S., Zeng, F., Cao, J., Lei, Y., Yuan, X., He, Q., & Zhou, Y. (2025) · International Journal of Biological Macromolecules · doi:10.1016/j.ijbiomac.2025.144742 · Cited by 10
Advances in ferroptosis in head and neck cancer (Review)
Wang, X., Li, K., Song, T., Xing, S., Wang, W., & Fang, Y. (2024) · Biomedical Reports · doi:10.3892/br.2024.1839 · Cited by 6
Bedolla, N., Liu, L., Liu, X., Xie, Q., & Ren, Y. (2025) · Toxicon · doi:10.1016/j.toxicon.2025.108233 · Cited by 6
Ko, J. M. Y., Guo, C., Leung, A. K.-K., Chan, S. C.-Y., Lo, A. W. I., Tao, L., Ng, H. Y., Wong, C. W.-Y., Law, S. Y.-K., Wong, Y., et al. (2025) · British Journal of Cancer · doi:10.1038/s41416-025-03113-2 · Cited by 6
Sabarwal, A., Machaalani, M., Rawat, L., Wedel, J., Tabasum, S., Sasamoto, Y., Buerger, F., Ascione, J., Eid, M., Semaan, K., et al. (2025) · Cancer Letters · doi:10.1016/j.canlet.2025.217984 · Cited by 6
Hu, W., Huang, Q., Chen, L., Geng, S., Zhang, H., Chen, H., Liu, X., Zhong, J., Su, F., Shao, C., et al. (2025) · Journal of Translational Medicine · doi:10.1186/s12967-025-07062-5 · Cited by 8
Du, H., Hou, L., Yu, H., Zhang, F., Tong, K., Wu, X., Zhang, Z., Liu, K., Miao, X., Guo, W., et al. (2024) · Cancers · doi:10.3390/cancers16213660 · Cited by 6
KLF5 promotes esophageal squamous cell carcinoma radioresistance by targeting the Keap1-Nrf2 pathway
Wang, Y., Yang, Y., Kamili, A., et al. (2025) · Discover Oncology · doi:10.1007/s12672-025-01868-x · Cited by 6
Blocking SLC7A11 attenuates the proliferation of esophageal squamous cell carcinoma cells
Li, W., Jin, X., Song, S.-J., et al. (2024) · Animal Cells and Systems · doi:10.1080/19768354.2024.2346981 · Cited by 6
Wu, J., Zhang, J., Tang, Q., et al. (2024) · Nephrology · doi:10.1111/nep.14334 · Cited by 6
Self-citationYang, T., Fan, Y., Bai, G., et al. (2024) · American Journal of Physiology-Cell Physiology · doi:10.1152/ajpcell.00533.2024 · Cited by 5
Aoyama, K., Yoriki, K., Aoki, K., Okamura, A., Tarumi, Y., Kataoka, H., Kokabu, T., & Mori, T. (2025) · Biochemical and Biophysical Research Communications · doi:10.1016/j.bbrc.2025.151887 · Cited by 6
APG-115 Induces SLC7A11-Mediated Ferroptosis and Upregulates PD-L1 Expression in Thyroid Cancer
Liang, L., Chen, Z., Lei, D., Mo, C., Lan, D., Ke, J., Wang, W., Yang, Z., Guo, X., Chen, D., et al. (2025) · ACS Omega · doi:10.1021/acsomega.5c04710 · Cited by 5
Chang, X., Zhang, Y., Wang, Q., et al. (2025) · Cellular Signalling · doi:10.1016/j.cellsig.2025.111998 · Cited by 5
Yu, Y., Luan, M., Zang, J., Luo, L., Wang, T., Wang, T., Wang, Y., & Wang, H. (2025) · Cell Death and Disease · doi:10.1038/s41419-025-07985-3 · Cited by 5
Verdina, A., & D’Orazi, G. (2025) · Frontiers in Bioscience-Landmark · doi:10.31083/fbl39800 · Cited by 6
Zheng, Y., Ye, X., Han, X.-Z., Geng, W., Zhao, L., & Meng, D. (2025) · Frontiers in Pharmacology · doi:10.3389/fphar.2025.1687677 · Cited by 6
Sharma, A., Srivastava, Y., Prasad, S., Ghosh, S., Kumar, R. S., Bharti, A. C., Singh, R. P., & Nasare, V. D. (2025) · International Journal of Biological Macromolecules · doi:10.1016/j.ijbiomac.2025.149257 · Cited by 7
Inducing Ferroptosis: Sensitization Strategy for Radiotherapy and Its Application
Chen, X., Chen, S., Yu, D., & Zhao, W. (2026) · Antioxidants · doi:10.3390/antiox15020237 · Cited by 8
Liu, K., Wang, Z., Guo, X., Luo, J., Wu, X., Wang, F., & Mei, Y. (2025) · International Journal of Biological Macromolecules · doi:10.1016/j.ijbiomac.2025.142388 · Cited by 5
Campbell, T., Slone, J. D., Vu, J., Liu, W., Yang, L., Dourson, A. J., Queme, L. F., Jankowski, M. P., & Huang, T. (2025) · Cell Death Discovery · doi:10.1038/s41420-025-02840-y · Cited by 4
Oxidative Stress and DNA Epigenetic Modifications in Cancer: Mechanisms and Targeted Therapeutics
Yang, X., Chen, Q., Yu, Y., Zang, Y., Zheng, R., Zhang, Z., Lu, S., & Zhou, L. (2026) · MedComm – Oncology · doi:10.1002/mog2.70065 · Cited by 7
Ford, H. R., & Bionaz, M. (2024) · International Journal of Molecular Sciences · doi:10.3390/ijms25084264 · Cited by 4
Lv, J.-L., Ren, Y.-S., Tan, Y., Chu, T., Cao, X.-Y., Liu, H.-Y., Ma, R., Zhang, H., Zheng, Q., Dong, G.-C., et al. (2024) · Phytomedicine · doi:10.1016/j.phymed.2024.155775 · Cited by 4
Research progress on ferroptosis in head and neck squamous cell carcinoma
Qiu, Y., Su, Y., Sai, W., & Feng, G. (2025) · Journal of Molecular Histology · doi:10.1007/s10735-025-10381-y · Cited by 4
Yu, Z., Luo, J., An, W., Wei, H., Song, A., Mao, Y., Li, M., He, L., Xiao, F., Gao, Q., et al. (2025) · Cellular Signalling · doi:10.1016/j.cellsig.2025.111772 · Cited by 4
BBOX1-AS1: A novel oncogenic long non-coding RNA in human cancers
Zhang, R., Gao, X., & Gu, X. (2023) · Pathology - Research and Practice · doi:10.1016/j.prp.2023.154810 · Cited by 4
Structural and mechanistic analysis of covalent ligands targeting the RNA-binding protein NONO
Lindsey, G. L., Hockley, T. K., Gomez, A. V., Marshall, A. C., Brothers, W. R., Finney, C. T., Gross, J., Fox, A. H., Yeo, G. W., Melillo, B., et al. (2026) · Cell Chemical Biology · doi:10.1016/j.chembiol.2025.12.010 · Cited by 6
Wang, C. C., Guo, H., Wang, L., Wang, Q., Liu, T., Huang, J., Wei, Y., & Wang, C. (2025) · Clinical Proteomics · doi:10.1186/s12014-025-09566-0 · Cited by 3
Wen, J., Liang, H., Zhao, M., Xuan, B., Meng, X., Liu, Y., Wang, L., He, L., Zhou, T., Tao, Y., et al. (2025) · Frontiers in Immunology · doi:10.3389/fimmu.2025.1703964 · Cited by 4
Roles and therapeutic targeting of SLC transporters in gastrointestinal malignancies
Wang, J., Huang, X., Chen, S., Zhang, Y., Miao, G., Du, S., Wang, X., Lu, Y., & Zhao, X. (2025) · Cancer Letters · doi:10.1016/j.canlet.2025.218222 · Cited by 3
Metal‐dependent regulated cell death: Molecular architecture and translational frontiers
Hu, H., Chen, Z., Li, Y., Peng, J., Cao, J., Zhou, H., Wang, M., Du, Y., Wu, H., Zhao, H., et al. (2026) · iMeta · doi:10.1002/imt2.70141 · Cited by 6
Impact of Ferroptosis Inducers on Chronic Radiation-exposed Survivor Glioblastoma Cells
Sur‐Erdem, İ. (2023) · Anti-Cancer Agents in Medicinal Chemistry · doi:10.2174/1871520623666230825110346 · Cited by 3
Molecular subtyping and precision therapy for esophageal cancer
Pei, G., Liang, Z., Gu, B., Shi, L., Liu, Z., & Gao, S. (2025) · Interdisciplinary medicine · doi:10.1002/inmd.20240105 · Cited by 3
Ferroptosis: A critical link to treatment resistance in esophageal carcinoma
Tang, M., Chen, J., Zhao, F.-Z., & Peng, J. (2025) · iScience · doi:10.1016/j.isci.2025.112901 · Cited by 3
Huang, J., Zhu, W., Wang, W., Xu, Y., Jiang, L., & Gu, Z. (2022) · Contrast Media & Molecular Imaging · doi:10.1155/2022/6857685 · Cited by 3
RetractedGuo, D., Feng, Y., Liu, P., Yang, S., Zhao, W., & Li, H. (2024) · Oncology Letters · doi:10.3892/ol.2024.14320 · Cited by 3
Wang, B., Yao, Z., Wang, Z., et al. (2024) · Molecular Carcinogenesis · doi:10.1002/mc.23816 · Cited by 2
Park, S. H., Seo, J., Kim, M. Y., et al. (2025) · Antioxidants · doi:10.3390/antiox14020228 · Cited by 2
Zhang, L., Wu, X., Zhang, H., Li, E., Xu, L., & Long, L. (2025) · International Journal of Cancer · doi:10.1002/ijc.70080 · Cited by 2
Xiao, X., Tu, X., Wei, N., He, W., Zeng, X., Liao, W., Deng, J., Dong, Y., Qi, X., Xiao, Y. C., et al. (2025) · Journal of Trace Elements in Medicine and Biology · doi:10.1016/j.jtemb.2025.127775 · Cited by 2
Non-coding RNAs-regulated SLC7A11 modulates ferroptosis: a new strategy for cancer therapy
Niu, X., Nie, J., Zhang, L., Chen, F., & Lin, Z. (2025) · Functional & Integrative Genomics · doi:10.1007/s10142-025-01757-0 · Cited by 2
Zhu, K., Zhang, K., Li, H., Shen, Y., Wang, L., Hu, Q., Xing, H., & Han, L. (2025) · Discover Oncology · doi:10.1007/s12672-025-04128-0 · Cited by 2
Wu, N., Wang, G., Wang, J., Wu, M., Wang, X., Ma, J., & He, W. (2025) · European Journal of Medicinal Chemistry · doi:10.1016/j.ejmech.2025.118448 · Cited by 2
Copper deprivation reprograms antioxidant defense to suppress ferroptosis via SLC7A11
Xue, Q., Chen, Z., Yang, J., Ren, K., Li, X., Chen, X., Yan, D., Wang, Y., Wang, Y., Liu, J., et al. (2026) · Redox Biology · doi:10.1016/j.redox.2026.104130 · Cited by 5
Wang, Y., Kong, H., Zhang, Y., et al. (2026) · Free Radical Biology and Medicine · doi:10.1016/j.freeradbiomed.2026.04.008 · Cited by 2
Regulation of SLC7A11 by METTL3 induces cisplatin resistance in esophageal cancer
Li, Y., Feng, J., Cui, M., et al. (2026) · International Journal of Biological Macromolecules · doi:10.1016/j.ijbiomac.2026.151921 · Cited by 2
Duan, D.-Q., Li, M.-R., Lu, L., et al. (2025) · Heart Lung and Circulation · doi:10.1016/j.hlc.2024.11.028 · Cited by 2
Pancewicz, J., Niklinska, W. E., & Chlanda, A. (2022) · Materials · doi:10.3390/ma15103456 · Cited by 2
Heat Shock Proteins and HSF1 in Ferroptosis
Tang, H., Chen, F., Cai, X., Xiang, L., Tang, D., Kang, R., & Liu, J. (2023) · Springer eBooks · doi:10.1007/978-3-031-39171-2_5 · Cited by 1
Metadata
- Authors
- Feng, L., Zhao, K., Sun, L., Yin, X., Zhang, J., Liu, C., & Li, B.
- Affiliations
- Shandong Tumor Hospital (CN)
- Binzhou Medical University (CN)
- Corresponding author
- Li, Baosheng
- Venue
- Journal of Translational Medicine
- Published
- 2021-08-26
- Volume
- 19
- Issue
- 1
- Pages
- 367-367
- ISSN
- 1479-5876 (ISSN-L)
- PMC
- PMC8393811
- OpenAlex
- W3194902068
- Semantic Scholar
- e55a74d417d2810a7e103ad2eaccdd036e12dc8c
- Cited by
- 277
- References
- 65
- Citations by year
- 2026: 46 · 2025: 67 · 2024: 67 · 2023: 61 · 2022: 35 · 2021: 1
- FWCI
- 26.79
- Type
- journal article
- Language
- en
- Open access
- gold
- doi.org
- Locations
- Journal of Translational Medicine (publishedVersion, cc-by)
- PubMed Central (publishedVersion, cc-by)
- PubMed (publishedVersion)
- DOAJ (DOAJ: Directory of Open Access Journals) (submittedVersion, cc-by-sa)
- Funders
- National Natural Science Foundation of China (No. 81874224)
- Academic promotion program of Shandong First Medical University (2019LJ004)
- National Key Research and Development Program of China (2016YFC0105106)
- Taishan Scholar Construction Project (ts20120505)
- Tumor prevention and control Joint Fund of Shandong province natural science fund (ZR2019LZL008)
- Yantai Science and Technology Innovation Development Program (2020YT06121070)
- Topics
- Life Sciences › Biochemistry, Genetics and Molecular Biology › Cancer Research › Ferroptosis and cancer prognosis
- Health Sciences › Medicine › Surgery › Esophageal Cancer Research and Treatment
- Life Sciences › Biochemistry, Genetics and Molecular Biology › Molecular Biology › Genomics, phytochemicals, and oxidative stress
- Keywords
- SLC7A11, Nrf2, esophageal squamous cell carcinoma, radioresistance (biology), ferroptosis, chemoradiotherapy, prognostic factors, lipid peroxidation, cyclooxygenase-2, promoter binding, treatment resistance
- MeSH terms
- Esophageal Squamous Cell Carcinoma, Ferroptosis, Esophageal Neoplasms, Head and Neck Neoplasms, Humans, Prognosis, Radiation Tolerance, Amino Acid Transport System y+, NF-E2-Related Factor 2
About these checks
Registry, retraction, Cites and statistics results are computed, not judged, with one exception: a printed reference that no index lists is read once by a model before it counts as a citation error. Claims are extracted by a model and kept only when their quote appears verbatim in the text; each cited source is then checked, with a model’s help, for whether it says what the claim relies on. Those verdicts can be wrong — read the claim’s quote and the cited source before relying on one.
Statistics and arithmetic are recomputed, not judged.
Confidence bands are shown only for fields calibrated on our annotated test set. None is calibrated yet, so no band is shown.
What counts as a claim ›How we measure confidence ›How we check this ›
Are you an author, or do you see a problem with this page? Request a review
