

The DOI matches its Crossref record; 25 of the 26 references it cites were found in a registry or an index.
Genomic Bayesian functional regression models with interactions for predicting wheat grain yield using hyper-spectral image data
Open accessAbstract
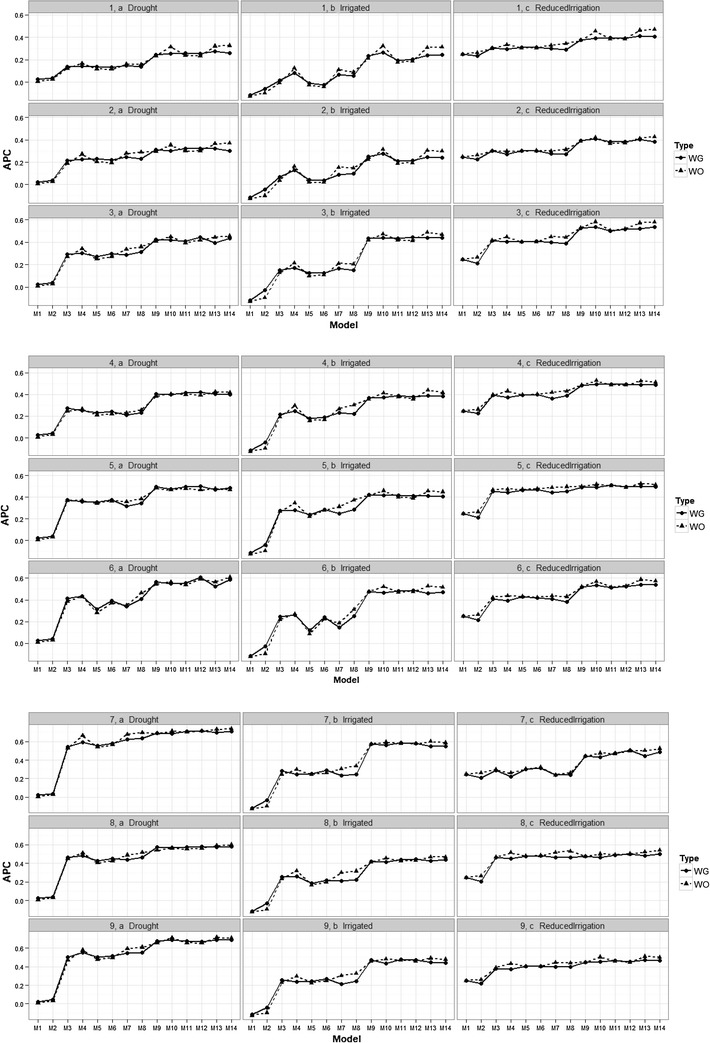
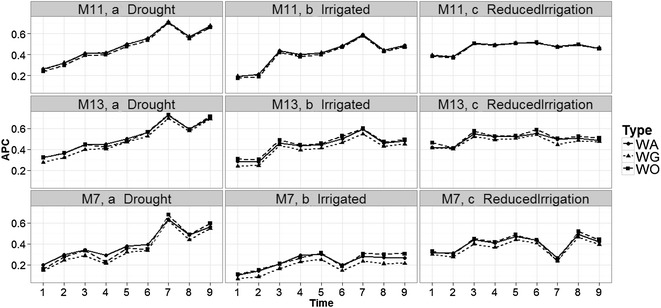
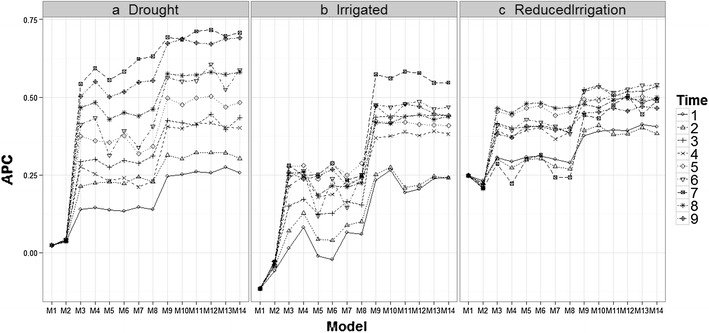
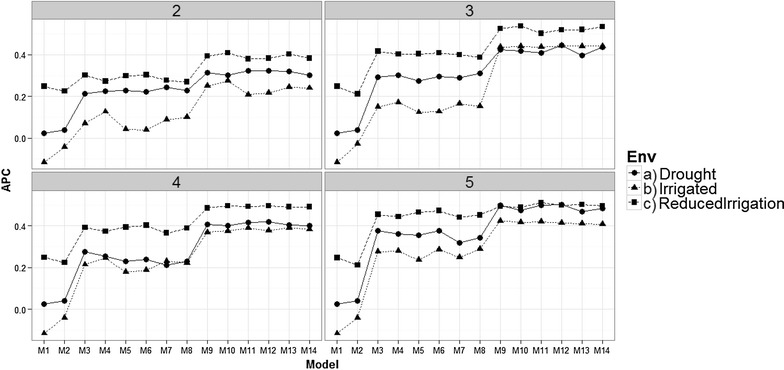
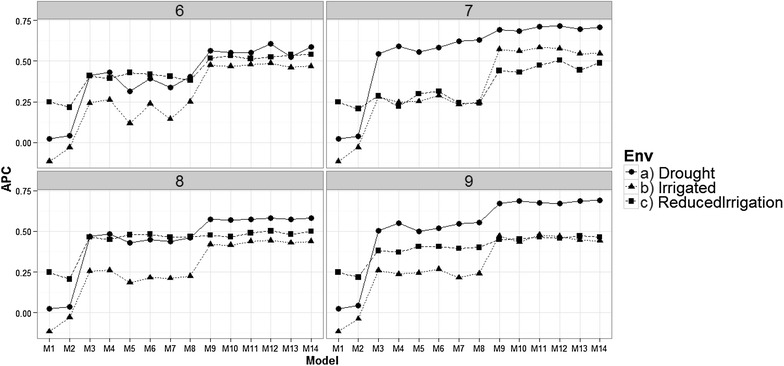
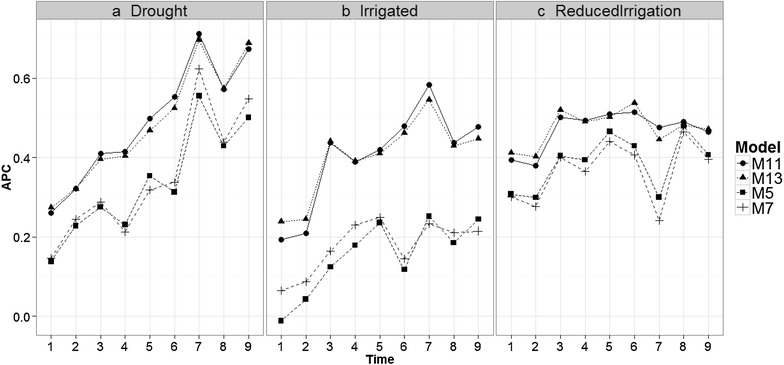
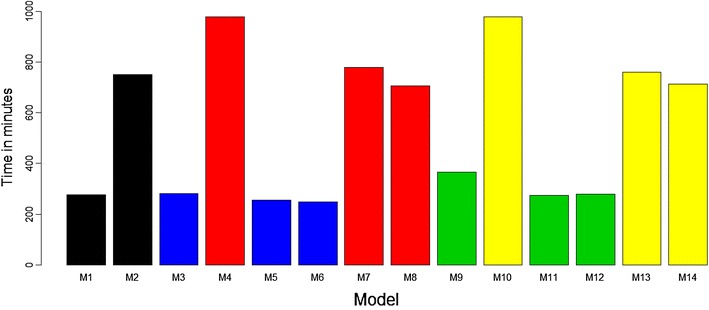
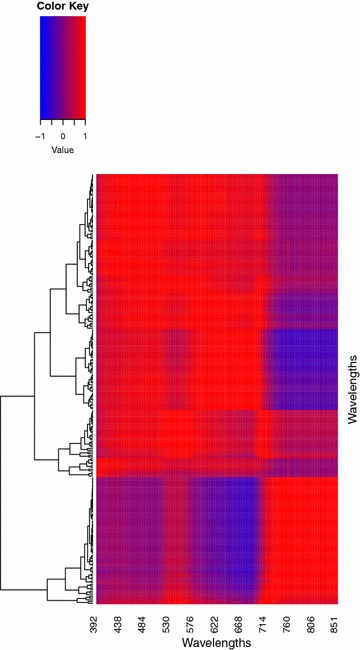
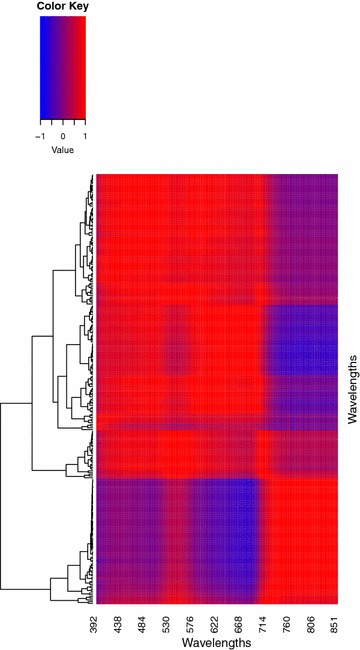
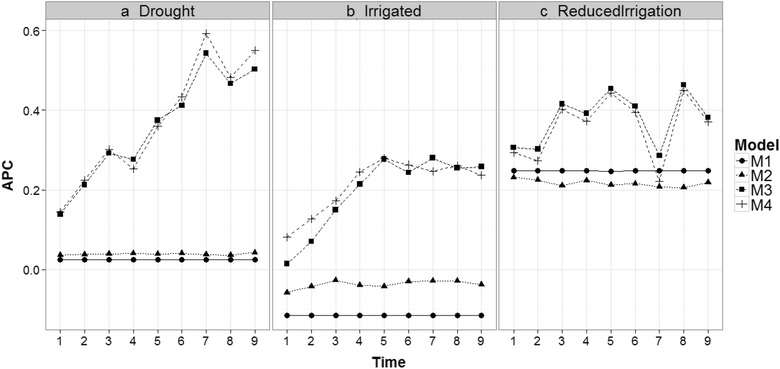
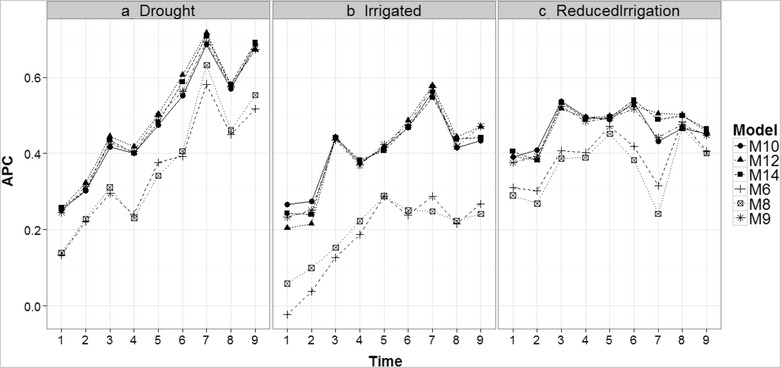
BACKGROUND: Modern agriculture uses hyperspectral cameras that provide hundreds of reflectance data at discrete narrow bands in many environments. These bands often cover the whole visible light spectrum and part of the infrared and ultraviolet light spectra. With the bands, vegetation indices are constructed for predicting agronomically important traits such as grain yield and biomass. However, since vegetation indices only use some wavelengths (referred to as bands), we propose using all bands simultaneously as predictor variables for the primary trait grain yield; results of several multi-environment maize (Aguate et al. in Crop Sci 57(5):1-8, 2017) and wheat (Montesinos-López et al. in Plant Methods 13(4):1-23, 2017) breeding trials indicated that using all bands produced better prediction accuracy than vegetation indices. However, until now, these prediction models have not accounted for the effects of genotype × environment (G × E) and band × environment (B × E) interactions incorporating genomic or pedigree information. RESULTS: In this study, we propose Bayesian functional regression models that take into account all available bands, genomic or pedigree information, the main effects of lines and environments, as well as G × E and B × E interaction effects. The data set used is comprised of 976 wheat lines evaluated for grain yield in three environments (Drought, Irrigated and Reduced Irrigation). The reflectance data were measured in 250 discrete narrow bands ranging from 392 to 851 nm (nm). The proposed Bayesian functional regression models were implemented using two types of basis: B-splines and Fourier. Results of the proposed Bayesian functional regression models, including all the wavelengths for predicting grain yield, were compared with results from conventional models with and without bands. CONCLUSIONS: We observed that the models with B × E interaction terms were the most accurate models, whereas the functional regression models (with B-splines and Fourier basis) and the conventional models performed similarly in terms of prediction accuracy. However, the functional regression models are more parsimonious and computationally more efficient because the number of beta coefficients to be estimated is 21 (number of basis), rather than estimating the 250 regression coefficients for all bands. In this study adding pedigree or genomic information did not increase prediction accuracy.
Overview
The claims and statistics of this paper haven’t been checked yet.
Free: it reads the open-access text and checks the first 5 claims that cite a source we can check. Create a free account to check every claim.
Integrity signals
Registry
Cites
Statistics
Figures
Verification
Claims the paper makes
The claims and statistics of this paper haven’t been checked yet.
Free: it reads the open-access text and checks the first 5 claims that cite a source we can check. Create a free account to check every claim.
Claims other papers make about this one
Each is checked against this paper’s own text: does it say what the citing paper says it does?
The cited source says what the claim attributes to it.
In the citing paper
“For a maize ordinal data set, A. Montesinos-López et al. (2017) reported that models including GE achieved gains of 9–14% in prediction accuracy over models including only main effects.”
From Multimodal deep learning methods enhance genomic prediction of wheat breeding (2023) · cites this paper as A. Montesinos-López et al. (2017)
In the citing paper
“The authors observed that the models with BE interaction terms were the most accurate, while the functional regression models and the conventional models performed similarly in terms of prediction accuracy.”
From Multimodal deep learning methods enhance genomic prediction of wheat breeding (2023) · cites this paper as A. Montesinos-López et al. (2017)
Self-check
Percentages, sums and reported differences re-computed from the paper’s own numbers.
The self-check needs the paper’s full text.
Citations
Cites
Efficient Methods to Compute Genomic Predictions
VanRaden, P. M. (2008) · Journal of Dairy Science · doi:10.3168/jds.2007-0980 · Cited by 6,050
Field high-throughput phenotyping: the new crop breeding frontier
Araus, J. L., & Cairns, J. E. (2014) · Trends in Plant Science · doi:10.1016/j.tplants.2013.09.008 · Cited by 1,817 · cited 1×
“For this reason, the use of low-cost, efficient, high-throughput plant phenotyping platforms (HTPP) [2] has dramatically increased.”
BackgroundPhenomics – technologies to relieve the phenotyping bottleneck
Furbank, R. T., & Tester, M. (2011) · Trends in Plant Science · doi:10.1016/j.tplants.2011.09.005 · Cited by 1,675
THE GENOTYPICAL RESPONSE OF THE PLANT SPECIES TO THE HABITAT
TURESSON, G. (2010) · Hereditas · doi:10.1111/j.1601-5223.1922.tb02734.x · Cited by 948 · cited 1×
“For this reason, Turesson [19] pointed out that the environment often influences plant development and that the presence of a particular variety in a specific location is not just a chance occurrence; rather, the variety’s peculiar characteristics are attributable to the effect of the environment…”
BackgroundTHE INCIDENCE OF ALKAPTONURIA : A STUDY IN CHEMICAL INDIVIDUALITY.
Garrod, A. (1902) · The Lancet · doi:10.1016/s0140-6736(01)41972-6 · Cited by 789
Applied Functional Data Analysis: Methods and Case Studies
(2002) · Springer Series in Statistics · doi:10.1007/b98886 · Cited by 787
Lights, camera, action: high-throughput plant phenotyping is ready for a close-up
Fahlgren, N., Gehan, M. A., & Baxter, I. (2015) · Current Opinion in Plant Biology · doi:10.1016/j.pbi.2015.02.006 · Cited by 703
A reaction norm model for genomic selection using high-dimensional genomic and environmental data
Jarquín, D., Crossa, J., Lacaze, X., Du Cheyron, P., Daucourt, J., Lorgeou, J., Piraux, F., Guerreiro, L., Pérez, P., Calus, M., et al. (2014) · Theoretical and Applied Genetics · doi:10.1007/s00122-013-2243-1 · Cited by 687 · cited 1×
“For example, using wheat data, Jarquin et al. [10] found that the prediction accuracy of models including interaction terms was substantially higher (17–34”
MethodSelf-citationMcCouch, S., Baute, G. J., Bradeen, J., Bramel, P., Bretting, P. K., Buckler, E., Burke, J. M., Charest, D., Cloutier, S., Cole, G., et al. (2013) · Nature · doi:10.1038/499023a · Cited by 570 · cited 1×
“In plant breeding, a branch of agriculture, plant pheno-typing has become financially expensive when evaluating complex traits like grain yield in large numbers of selection candidates [8, 11].”
Rutkoski, J., Poland, J., Mondal, S., Autrique, E., Pérez, L. G., Crossa, J., Reynolds, M., & Singh, R. (2016) · G3 Genes|Genomes|Genetics · doi:10.1534/g3.116.032888 · Cited by 419 · cited 3×
“A pedigree was used to devive the additive relationship matrix ( A ) among the wheat lines [16]; the entries of matrix A equal twice the coefficient of parentage between pairs of lines.”
BackgroundMethodInfluentialSelf-citation
Cited by
Genomic Selection in Plant Breeding: Methods, Models, and Perspectives
Crossa, J., Pérez-Rodríguez, P., Cuevas, J., Montesinos-López, O., Jarquín, D., de los Campos, G., Burgueño, J., González-Camacho, J. M., Pérez-Elizalde, S., Beyene, Y., et al. (2017) · Trends in Plant Science · doi:10.1016/j.tplants.2017.08.011 · Cited by 1,839
“A recent study developed statistical models to assess hyperspectral wavelength environment interactions in HTP, incorporating genomic and pedigree G E interactions [78].”
BackgroundSelf-citationTranslating High-Throughput Phenotyping into Genetic Gain
Araus, J. L., Kefauver, S. C., Zaman-Allah, M., Olsen, M. S., & Cairns, J. E. (2018) · Trends in Plant Science · doi:10.1016/j.tplants.2018.02.001 · Cited by 790
The Modern Plant Breeding Triangle: Optimizing the Use of Genomics, Phenomics, and Enviromics Data
Crossa, J., Fritsche-Neto, R., Montesinos-Lopez, O. A., Costa-Neto, G., Dreisigacker, S., Montesinos-Lopez, A., & Bentley, A. R. (2021) · Frontiers in Plant Science · doi:10.3389/fpls.2021.651480 · Cited by 266
“, 2017), high throughput phenotyping (HTP, phenomics) (Montesinos-López et al., 2017) and historical descriptions of environmental relatedness (enviromics) (Costa-Neto et al.”
BackgroundSelf-citationFavela‐González, K. M., Hernández‐Almanza, A. Y., & De la Fuente‐Salcido, N. M. (2020) · Journal of Food Biochemistry · doi:10.1111/jfbc.13414 · Cited by 202
Breeding to adapt agriculture to climate change: affordable phenotyping solutions
Araus, J. L., & Kefauver, S. C. (2018) · Current Opinion in Plant Biology · doi:10.1016/j.pbi.2018.05.003 · Cited by 170
Metadata
- Authors
- Montesinos-López, A., Montesinos-López, O. A., Cuevas, J., Mata-López, W. A., Burgueño, J., Mondal, S., Huerta, J., Singh, R., Autrique, E., González-Pérez, L., & Crossa, J.
- Affiliations
- Universidad de Colima (MX)
- University of Quintana Roo (MX)
- Centro Internacional de Mejoramiento de Maíz Y Trigo (MX)
- Corresponding author
- Crossa, José
- ORCID
- Venue
- Plant Methods
- Published
- 2017-07-27
- Volume
- 13
- Issue
- 1
- Pages
- 62-62
- ISSN
- 1746-4811 (ISSN-L)
- PMC
- PMC5530534
- OpenAlex
- W2740104414
- Cited by
- 86
- References
- 26
- Citations by year
- 2026: 1 · 2025: 3 · 2024: 6 · 2023: 7 · 2022: 13 · 2021: 24 · 2020: 12 · 2019: 8 · 2018: 8 · 2017: 4
- FWCI
- 6.12
- Type
- journal article
- Language
- en
- Open access
- gold
- doi.org
- Licence
- cc-by
- Locations
- Plant Methods (publishedVersion, cc-by)
- PubMed Central (publishedVersion, cc-by)
- PubMed (publishedVersion)
- DOAJ (DOAJ: Directory of Open Access Journals) (submittedVersion, cc-by-sa)
- Topics
- Physical Sciences › Chemistry › Analytical Chemistry › Spectroscopy and Chemometric Analyses
- Physical Sciences › Environmental Science › Ecology › Remote Sensing in Agriculture
- Life Sciences › Agricultural and Biological Sciences › Plant Science › Smart Agriculture and AI
- Keywords
- hyperspectral reflectance, gene-environment interaction, genomic data, pedigree data, B-splines, Fourier basis, plant breeding trials
About these checks
Registry, retraction, Cites and statistics results are computed, not judged, with one exception: a printed reference that no index lists is read once by a model before it counts as a citation error. Claims are extracted by a model and kept only when their quote appears verbatim in the text; each cited source is then checked, with a model’s help, for whether it says what the claim relies on. Those verdicts can be wrong — read the claim’s quote and the cited source before relying on one.
Statistics and arithmetic are recomputed, not judged.
Confidence bands are shown only for fields calibrated on our annotated test set. None is calibrated yet, so no band is shown.
What counts as a claim ›How we measure confidence ›How we check this ›
Are you an author, or do you see a problem with this page? Request a review
How to cite
Cite CoChat for the checks on this page, and the paper for its own findings.
- This page
- CoChat. (2026). Citation check: Genomic Bayesian functional regression models with interactions for predicting wheat grain yield using hyper-spectral image data. https://app.cochat.ai/papers/10.1186/s13007-017-0212-4
- The paper
- Montesinos-López, A., Montesinos-López, O. A., Cuevas, J., Mata-López, W. A., Burgueño, J., Mondal, S., Huerta, J., Singh, R., Autrique, E., González-Pérez, L., & Crossa, J. (2017). Genomic Bayesian functional regression models with interactions for predicting wheat grain yield using hyper-spectral image data. Plant Methods. https://doi.org/10.1186/s13007-017-0212-4
Data sources
Bibliographic data: Semantic Scholar, OpenAlex, Crossref.
Contains information from the Semantic Scholar Academic Graph Datasets, made available under the ODC Attribution License (ODC-BY 1.0).
Semantic Scholar’s data is described in: Kinney, R., et al. (2023). The Semantic Scholar Open Data Platform. arXiv:2301.10140.
