

The DOI matches its Crossref record; 47 of the 47 references it cites were found in a registry or an index.
Danggui-Shaoyao-San modulates sphingolipid metabolism to promote oligodendrocyte differentiation and maturation in vascular dementia rats
Open accessPublished version of a preprint
Abstract
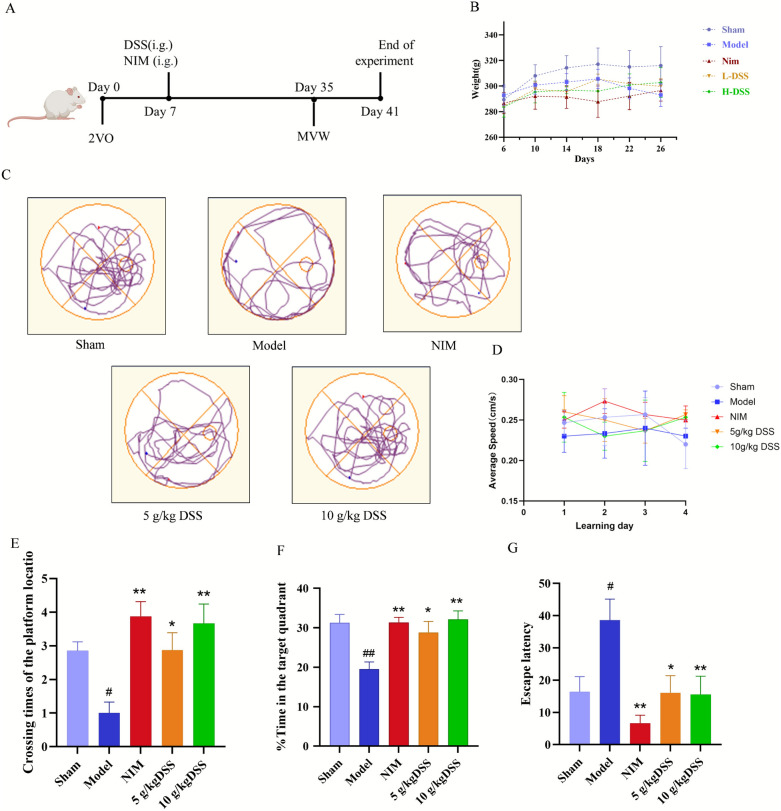
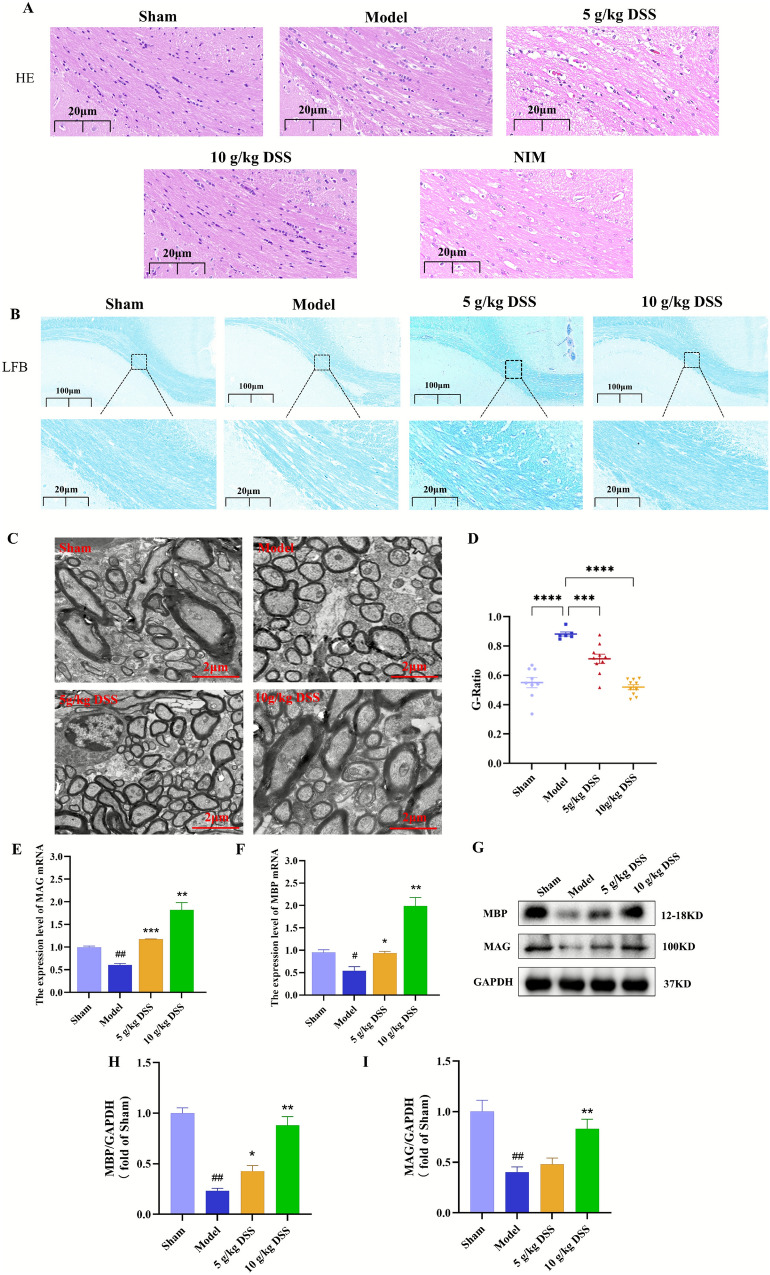
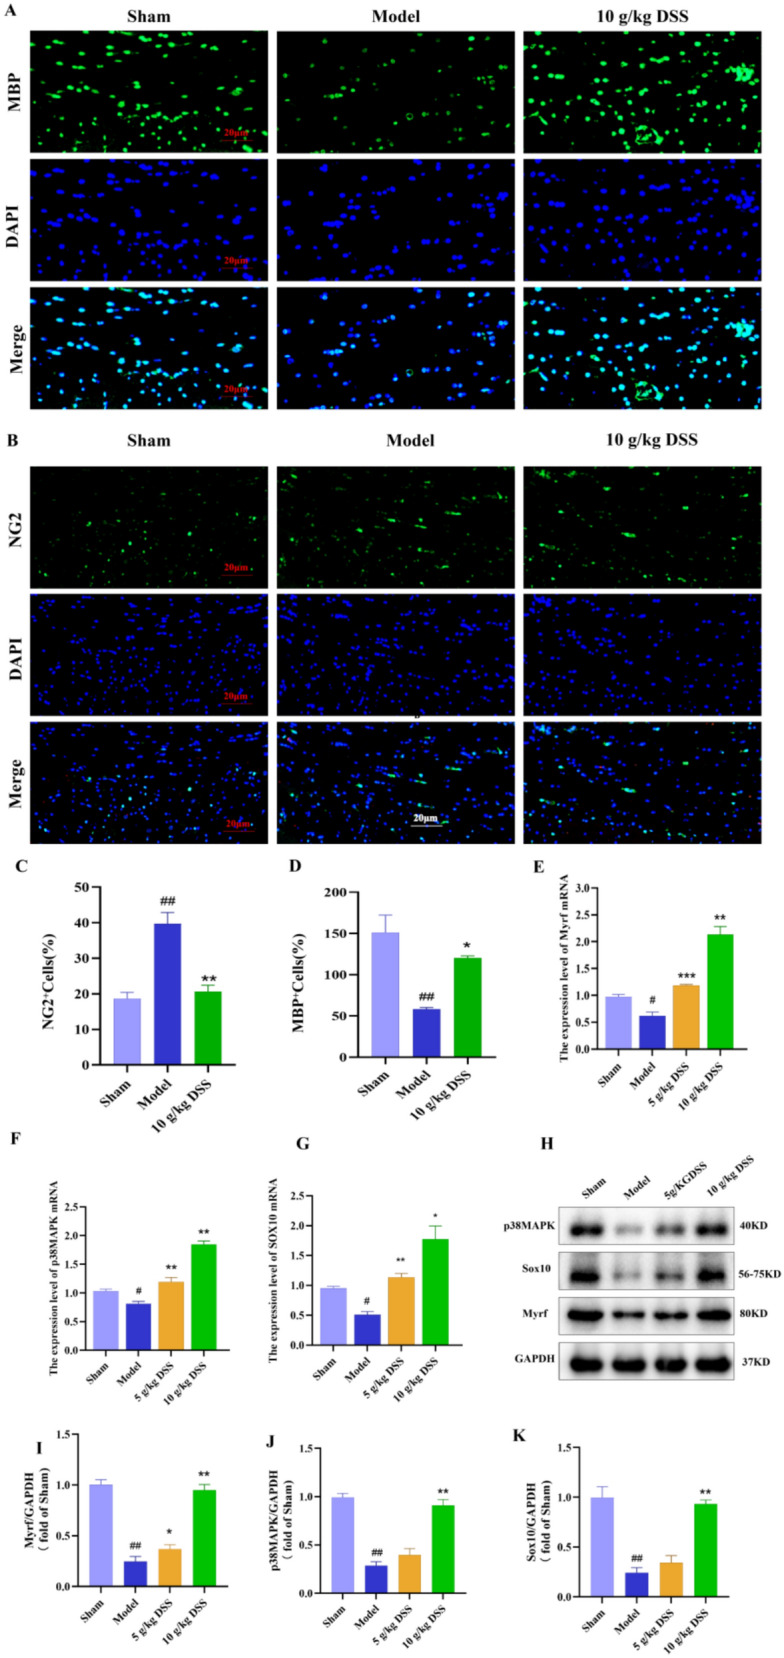
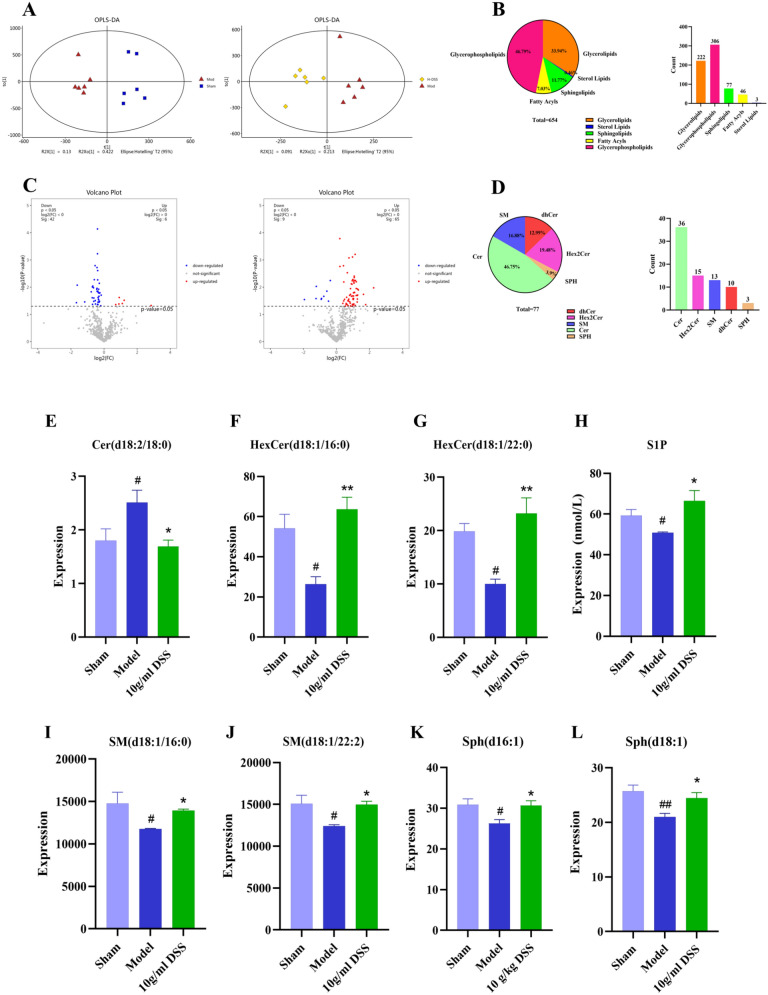
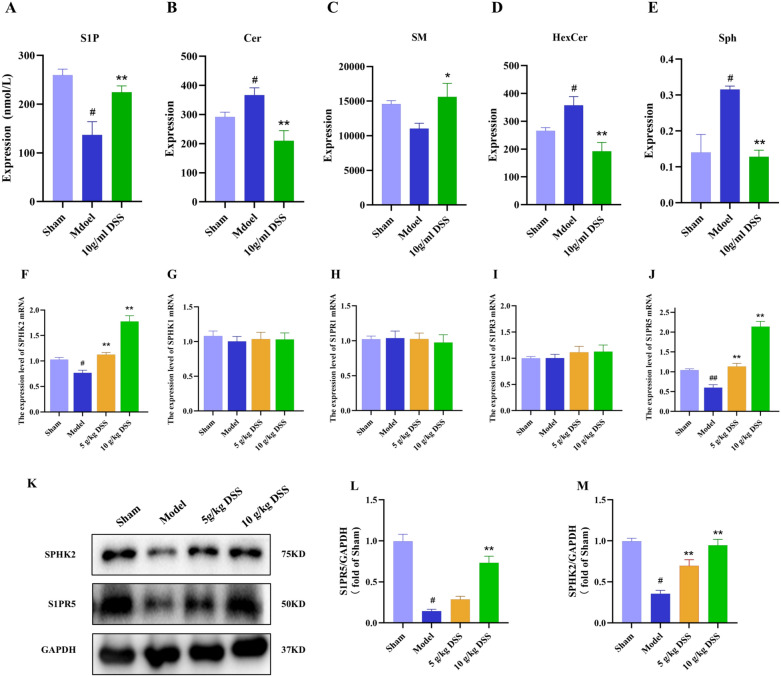
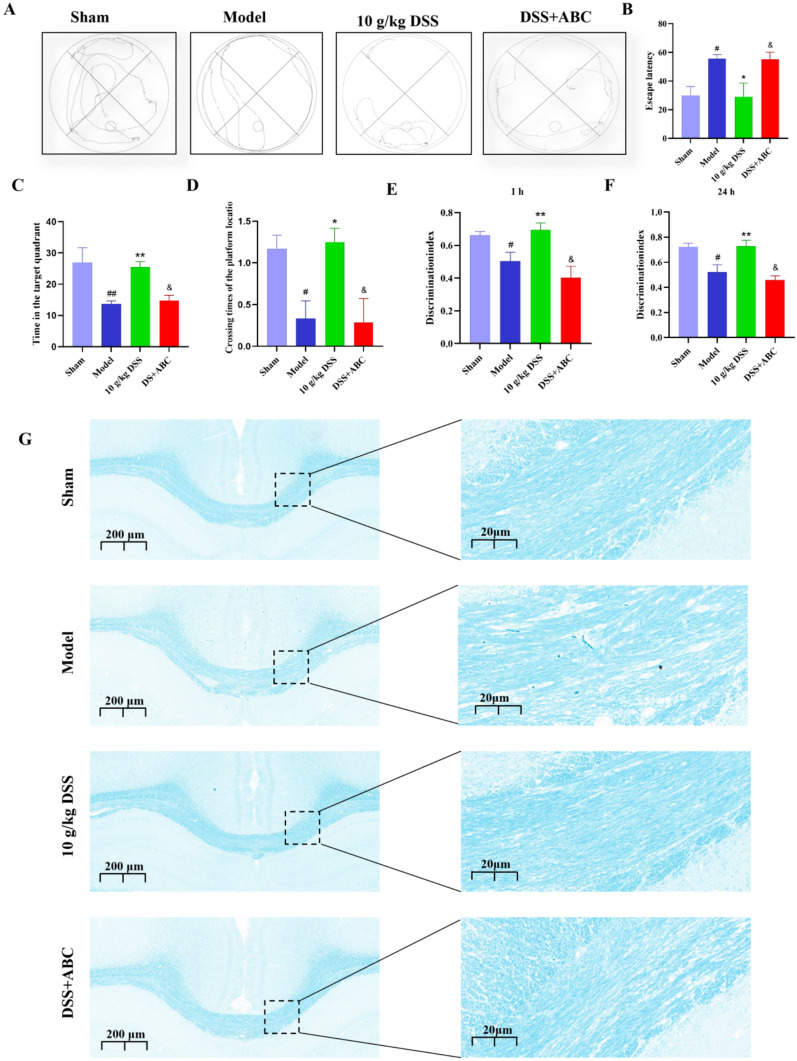
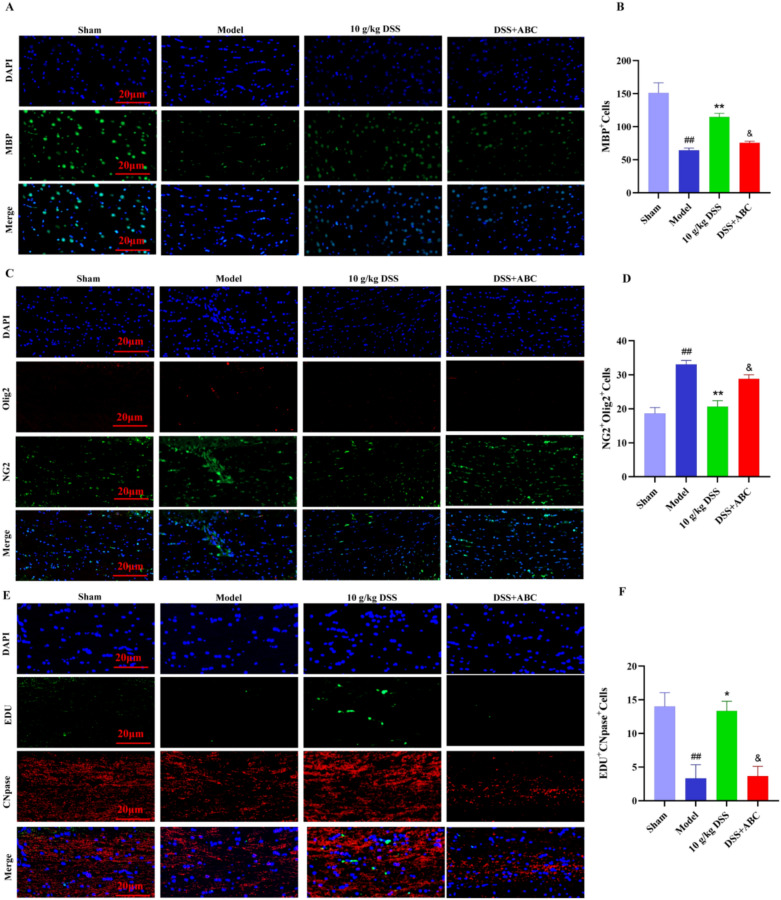
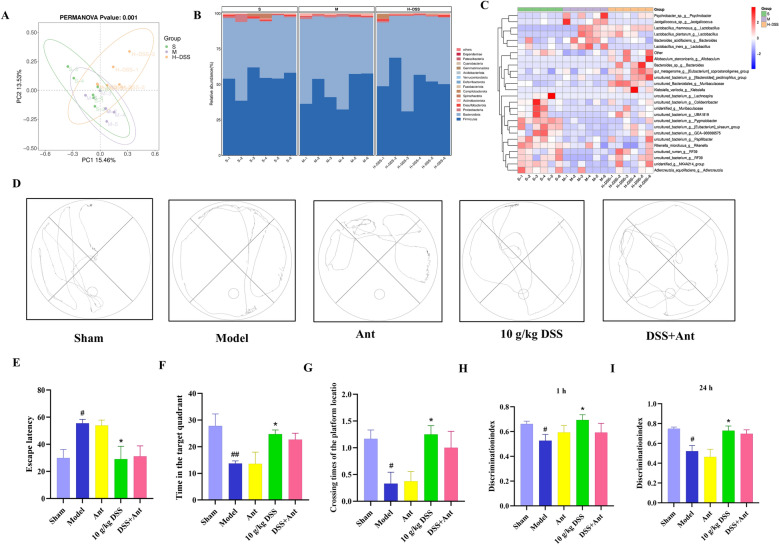
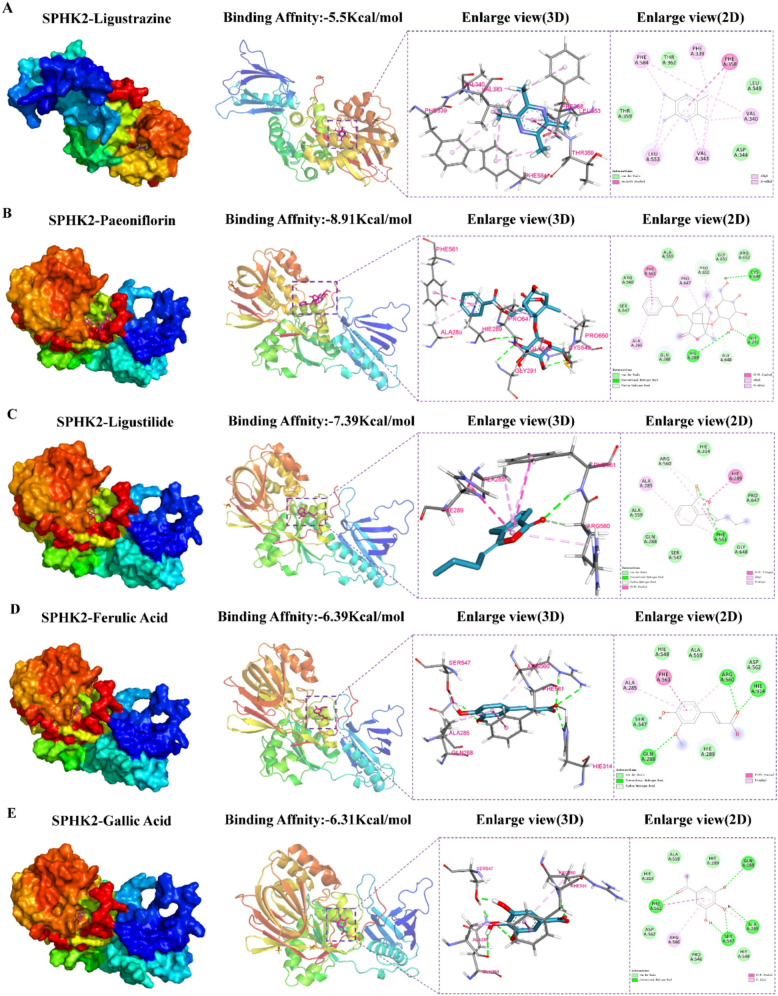
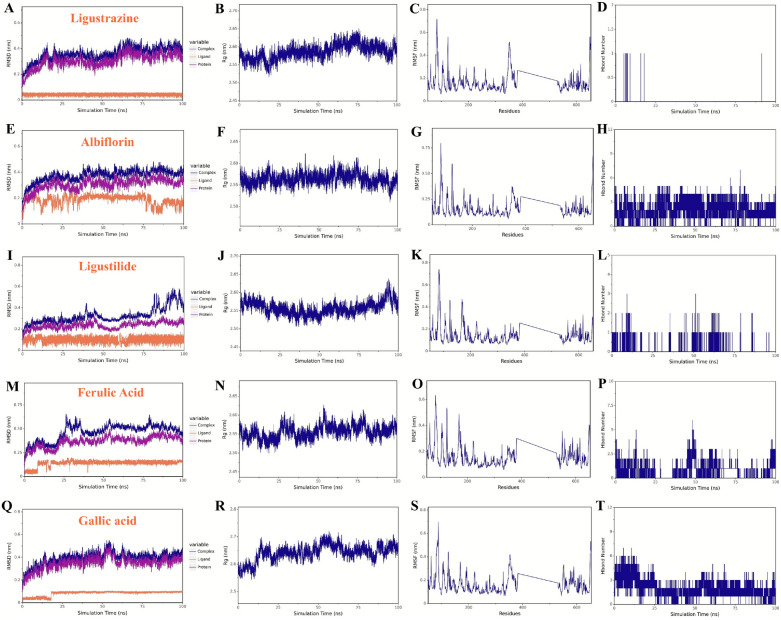
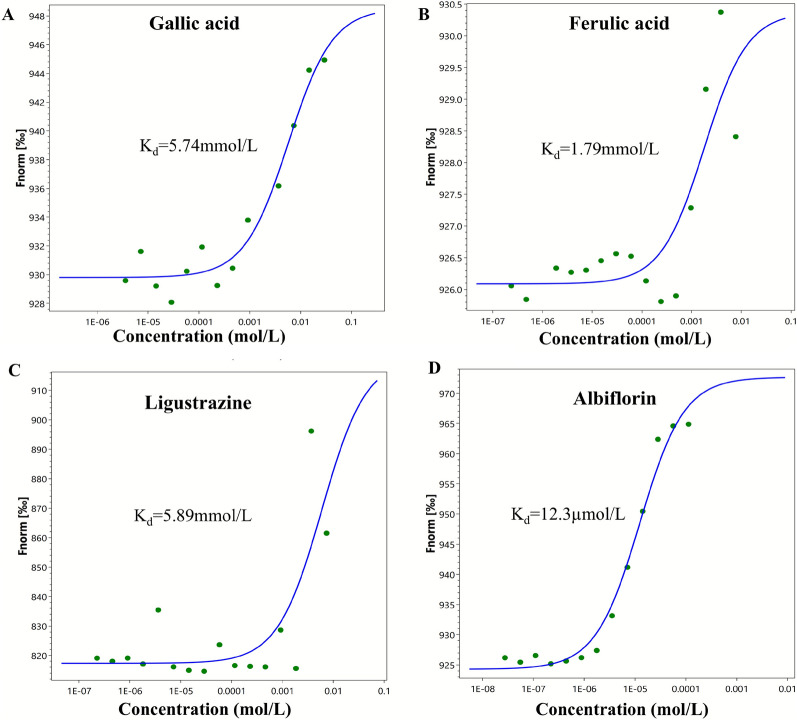
Objective: Vascular dementia (VaD) is a neurodegenerative disease primarily characterized by white matter injury and myelin degeneration, and currently, there is a lack of effective treatment options. This study aims to investigate the effects of the traditional Chinese medicine formula Danggui Shaoyao San (DSS) on cognitive function and myelin repair in VaD rats and to elucidate its underlying mechanisms. Methods: The VaD rat model was established using the bilateral common carotid artery ligation (2VO) method. The effects of DSS on cognitive function, myelin regeneration, sphingolipid metabolism, and SPHK2/S1P/S1PR5 pathway was conducted using behavioral tests, histological staining, Western blot, lipidomics, qPCR, immunofluorescence, LC–MS/MS, and 16S rRNA sequencing. Besides, molecular docking and molecular dynamics simulation were carried out. Results: DSS treatment significantly improved learning and memory abilities in VaD rats, reduced structural damage in the hippocampus and white matter, and promoted the differentiation of oligodendrocyte precursor cells (OPCs) into mature oligodendrocytes (OLs). Lipidomics and molecular biological experiments indicated that DSS activated the SPHK2/S1P/S1PR5 pathway, ameliorated sphingolipid metabolic disorders and increased S1P levels, thereby promoting myelin repair. The specific SPHK2 inhibitor ABC294640 significantly weakened the neuroprotective effects of DSS, further confirming the central role of SPHK2/S1P/S1PR5 pathway. Antibiotic depletion experiments confirmed that the gut microbiota was not a key mediator of the therapeutic effects of DSS. Finally, molecular docking and molecular dynamics simulations indicated that the DSS components Albiflorin and Gallic acid form tighter and more stable interactions with SPHK2. Conclusion: DSS improved VaD cognitive impairment by modulating sphingolipid metabolism and promote myelin regeneration via activating the SPHK2/S1P/S1PR5 signaling pathway. This study provides important experimental evidence for the clinical application of DSS in VaD.
Overview
The claims and statistics of this paper haven’t been checked yet.
Run the check — free, no account needed. It reads the open-access text and checks the sources it cites.
Integrity signals
Registry
Cites
Statistics
Figures
Verification
Claims the paper makes
The claims and statistics of this paper haven’t been checked yet.
Run the check — free, no account needed. It reads the open-access text and checks the sources it cites.
Self-check
Percentages, sums and reported differences re-computed from the paper’s own numbers.
The self-check needs the paper’s full text.
Citations
Cites
Varadi, M., Bertoni, D., Magana, P., Paramval, U., Pidruchna, I., Radhakrishnan, M., Tsenkov, M., Nair, S., Mirdita, M., Yeo, J., et al. (2024) · Nucleic Acids Research · doi:10.1093/nar/gkad1011 · Cited by 2,052 · cited 2×
“Among them, Bacteroidota are considered beneficial and are closely related to sphingolipid metabolism and nervous system development in vivo [26].”
Vascular Cognitive Impairment and Dementia
Iadecola, C., Duering, M., Hachinski, V., Joutel, A., Pendlebury, S. T., Schneider, J. A., & Dichgans, M. (2019) · Journal of the American College of Cardiology · doi:10.1016/j.jacc.2019.04.034 · Cited by 801
Bacteroides-Derived Sphingolipids Are Critical for Maintaining Intestinal Homeostasis and Symbiosis
Brown, E. M., Ke, X., Hitchcock, D., Jeanfavre, S., Avila-Pacheco, J., Nakata, T., Arthur, T. D., Fornelos, N., Heim, C., Franzosa, E. A., et al. (2019) · Cell Host & Microbe · doi:10.1016/j.chom.2019.04.002 · Cited by 529
Czubowicz, K., Jęśko, H., Wencel, P., Lukiw, W. J., & Strosznajder, R. P. (2019) · Molecular Neurobiology · doi:10.1007/s12035-018-1448-3 · Cited by 281
Emerging Concepts in Vascular Dementia: A Review
Bir, S. C., Khan, M. W., Javalkar, V., Toledo, E. G., & Kelley, R. E. (2021) · Journal of Stroke and Cerebrovascular Diseases · doi:10.1016/j.jstrokecerebrovasdis.2021.105864 · Cited by 251
Targeting sphingosine-1-phosphate signaling in immune-mediated diseases: beyond multiple sclerosis
Pérez-Jeldres, T., Alvarez-Lobos, M., & Rivera-Nieves, J. (2021) · Drugs · doi:10.1007/s40265-021-01528-8 · Cited by 197
Role of Ceramidases in Sphingolipid Metabolism and Human Diseases
Parveen, F., Bender, D. A., Law, S., Mishra, V. K., Chen, C.-C., & Ke, L. (2019) · Cells · doi:10.3390/cells8121573 · Cited by 152
Qiu, S., Palavicini, J. P., Wang, J., Gonzalez, N. S., He, S., Dustin, E., Zou, C., Ding, L., Bhattacharjee, A., Skike, C. E. V., et al. (2021) · Molecular Neurodegeneration · doi:10.1186/s13024-021-00488-7 · Cited by 136
Oligodendrocytes and Microglia: Key Players in Myelin Development, Damage and Repair
Kalafatakis, I., & Karagogeos, D. (2021) · Biomolecules · doi:10.3390/biom11071058 · Cited by 128
Host hepatic metabolism is modulated by gut microbiota-derived sphingolipids
Le, H. H., Lee, M.-T., Besler, K. R., & Johnson, E. L. (2022) · Cell Host & Microbe · doi:10.1016/j.chom.2022.05.002 · Cited by 114
Sphingolipids as critical players in retinal physiology and pathology
Simón, M. V., Basu, S. K., Qaladize, B., Grambergs, R. C., Rotstein, N. P., & Mandal, N. A. (2020) · Journal of Lipid Research · doi:10.1194/jlr.tr120000972 · Cited by 98
Functional myelin in cognition and neurodevelopmental disorders
Khelfaoui, H., Ibaceta-González, C., & Angulo, M. C. (2024) · Cellular and Molecular Life Sciences · doi:10.1007/s00018-024-05222-2 · Cited by 92
Giussani, P., Prinetti, A., & Tringali, C. (2021) · Journal of Neurochemistry · doi:10.1111/jnc.15133 · Cited by 91
Pharmacological Treatment of Vascular Dementia: A Molecular Mechanism Perspective
Kuang, H., Zhou, Z., Zhu, Y., Wan, Z., Yang, M.-W., Hong, F., & Yang, S. (2021) · Aging and Disease · doi:10.14336/ad.2020.0427 · Cited by 91
Sphingolipid metabolism controls mammalian heart regeneration
Ji, X., Chen, Z., Wang, Q., Li, B., Yan, W., Li, Y., Lin, J., Cheng, W., Guo, Y., Wu, S., et al. (2024) · Cell Metabolism · doi:10.1016/j.cmet.2024.01.017 · Cited by 82
Zveik, O., Rechtman, A., Ganz, T., & Vaknin‐Dembinsky, A. (2024) · Molecular Neurodegeneration · doi:10.1186/s13024-024-00742-8 · Cited by 79
Chen, D., Huang, Y., Shi, Z., Li, J., Zhang, Y., Wang, K., Smith, A. D., Gong, Y., & Gao, Y. (2020) · CNS Neuroscience & Therapeutics · doi:10.1111/cns.13497 · Cited by 76
Self-citationLucaciu, A., Brunkhorst, R., Pfeilschifter, J. M., Pfeilschifter, W., & Subburayalu, J. (2020) · Cells · doi:10.3390/cells9061515 · Cited by 70
Vascular pathology and pathogenesis of cognitive impairment and dementia in older adults
Agrawal, S., & Schneider, J. A. (2022) · Cerebral Circulation - Cognition and Behavior · doi:10.1016/j.cccb.2022.100148 · Cited by 70
Chen, X., Chen, L., Lin, G., Wang, Z., Kodali, M. C., Li, M., Chen, H., Lebovitz, S. G., Ortyl, T. C., Li, L., et al. (2022) · Molecular Psychiatry · doi:10.1038/s41380-022-01701-9 · Cited by 67
Sassoli, C., Pierucci, F., Zecchi‐Orlandini, S., & Meacci, E. (2019) · International Journal of Molecular Sciences · doi:10.3390/ijms20225545 · Cited by 55
He, J., Jin, Y., He, C., Li, Z., Yu, W., Zhou, J., Luo, R., Chen, Q., Wu, Y., Wang, S., et al. (2024) · Frontiers in Pharmacology · doi:10.3389/fphar.2023.1338804 · Cited by 45
Davis, D. L., Mahawar, U., Pope, V. S., Allegood, J. C., Sato‐Bigbee, C., & Wattenberg, B. W. (2020) · Journal of Lipid Research · doi:10.1194/jlr.ra120000627 · Cited by 43
Sphingosine 1-Phosphate Receptors in Cerebral Ischemia
Gaire, B. P., & Choi, J. W. (2020) · NeuroMolecular Medicine · doi:10.1007/s12017-020-08614-2 · Cited by 35
Tringali, C., & Giussani, P. (2022) · International Journal of Molecular Sciences · doi:10.3390/ijms23147806 · Cited by 34
Oligodendrocytes Play a Critical Role in White Matter Damage of Vascular Dementia
Zhang, H., Yang, Y., Zhang, J., Huang, L. S., Niu, Y., Chen, H., Liu, Q., & Wang, R. Y. (2023) · Neuroscience · doi:10.1016/j.neuroscience.2023.10.018 · Cited by 34
White Matter and Neuroprotection in Alzheimer’s Dementia
Lorenzini, L., Fernández, M., Baldassarro, V. A., Bighinati, A., Giuliani, A., Calzà, L., & Giardino, L. (2020) · Molecules · doi:10.3390/molecules25030503 · Cited by 33
Role and interaction of bacterial sphingolipids in human health
Bai, X., Ya, R., Tang, X., & Cai, M. (2023) · Frontiers in Microbiology · doi:10.3389/fmicb.2023.1289819 · Cited by 30
Danggui-Shaoyao-San for dementia
Kim, Y., & Cho, S. (2020) · Medicine · doi:10.1097/md.0000000000018507 · Cited by 28
Pathways Involved in Remyelination after Cerebral Ischemia
Garcia‐Martin, G., Alcover‐Sanchez, B., Wandosell, F. G., & Cubelos, B. (2021) · Current Neuropharmacology · doi:10.2174/1570159x19666210610093658 · Cited by 27
MRI and fluid biomarkers reveal determinants of myelin and axonal loss with aging
Walker, K. A., Duggan, M. R., Gong, Z., Dark, H. E., Laporte, J. P., Faulkner, M. E., An, Y., Lewis, A., Moghekar, A., Resnick, S. M., et al. (2023) · Annals of Clinical and Translational Neurology · doi:10.1002/acn3.51730 · Cited by 25
Ningning, Y., Xu, Y., Li, X., et al. (2024) · Journal of Ethnopharmacology · doi:10.1016/j.jep.2024.118306 · Cited by 23
Self-citationThe role of SphK/S1P/S1PR signaling pathway in bone metabolism
Xu, X., Han, Y., Zhu, T., Fan, F., Wang, X., Liu, Y., & Luo, D. (2023) · Biomedicine & Pharmacotherapy · doi:10.1016/j.biopha.2023.115838 · Cited by 21
Luo, Q., Li, F., Liu, X., Yan, T., Yang, L., Zhu, W., Zheng, H., Li, Y., Tu, J., & Zhu, X. (2025) · Phytomedicine · doi:10.1016/j.phymed.2025.156396 · Cited by 21
Pattern of cognitive deficits in vascular dementia
Sengupta, P., Ganguly, J., Pal, S., & Ghosal, M. K. (2019) · The Indian Journal of Medical Research · doi:10.4103/ijmr.ijmr_1336_17 · Cited by 20
Deciphering the role of sphingosine 1‐phosphate in central nervous system myelination and repair
Binish, F., & Xiao, J. (2024) · Journal of Neurochemistry · doi:10.1111/jnc.16228 · Cited by 20
Language Impairment in Vascular Dementia: A Clinical Review
Macoir, J. (2023) · Journal of Geriatric Psychiatry and Neurology · doi:10.1177/08919887231195225 · Cited by 17
Gong, K., Zhou, S. Y., Li, X., Xu, M.-Z., Zhou, Y., Lu, K., Yu, X., Zhu, J., Liu, C., & Zhu, Q. (2025) · Frontiers in Pharmacology · doi:10.3389/fphar.2025.1588375 · Cited by 17
Self-citationNDE1 positively regulates oligodendrocyte morphological differentiation
Shimizu, S., Ishino, Y., Tohyama, M., & Miyata, S. (2018) · Scientific Reports · doi:10.1038/s41598-018-25898-4 · Cited by 14
Cheng, X., Dai, Y., Shang, B., Zhang, S., Lin, L., Wu, Q., Zhan, R., Li, S., & Liu, S. (2024) · BMC Complementary Medicine and Therapies · doi:10.1186/s12906-024-04588-x · Cited by 13
Self-citationReduced myelin contributes to cognitive impairment in patients with monogenic small vessel disease
Denecke, J., Dewenter, A., Lee, J., Franzmeier, N., Valentim, C., Kopczak, A., Dichgans, M., Pirpamer, L., Gesierich, B. G., Duering, M., et al. (2025) · Alzheimer s & Dementia · doi:10.1002/alz.70127 · Cited by 13
Li, Y., Wan, L. P., Song, N., Ding, Y., Zhao, S., Niu, J., Mao, B., Sheng, N., & Ma, P. (2024) · Science Advances · doi:10.1126/sciadv.adk3931 · Cited by 11
Liu, C., Yin, H., Chen, X., Ban, W., Zhu, G., & Wang, J. (2025) · Neuroscience · doi:10.1016/j.neuroscience.2025.03.002 · Cited by 11
Ma, K., An, C., Li, M., Zhang, Y., Ren, M., Wei, Y., Xu, W., Wang, R., Bai, Y., Zhang, H., et al. (2024) · Drug Design Development and Therapy · doi:10.2147/dddt.s489860 · Cited by 10
Self-citationCerebral hypoperfusion, brain structural integrity, and cognitive impairment in older APOE4 carriers
Pappas, I., Lohman, T., Dutt, S., Kapoor, A., Engstrom, A. C., Alitin, J. P. M., Barnes, S. R., Chakhoyan, A., Saca, L., Gaggar, R., et al. (2025) · GeroScience · doi:10.1007/s11357-025-01642-5 · Cited by 10
Liu, X., Yao, L., Ye, X., Qin, Y., Chen, S., Jiang, Q., Liu, M., Chen, X., Li, W., Lin, C., et al. (2024) · Brain Research · doi:10.1016/j.brainres.2024.149135 · Cited by 6
Moro, K., Ichikawa, H., Koyama, Y., Abe, S., Uchida, H., Naruse, K., Obata, Y., Tsuchida, J., Toshikawa, C., Ikarashi, M., et al. (2023) · World Journal of Oncology · doi:10.14740/wjon1656 · Cited by 3
Research works printed but not linked: 1
- J P, G H, A L, M P, Gc D. Regional contribution of vascular dysfunction in white matter dementia: clinical and neuropathological insights. Frontiers in neurology 2023 https://pubmed.ncbi.nlm.nih.gov/37396778/. Accessed 22 May 2025
Metadata
- Authors
- Su, Y., Zhong, Y., Yuan, N., Li, X., Xu, Y., Yang, H., Huang, M., Zhang, Y., & Cheng, X.
- Affiliations
- Nanjing University of Chinese Medicine (CN)
- Corresponding author
- Cheng, Xiaolan
- Venue
- Chinese Medicine
- Published
- 2026-01-07
- Volume
- 21
- Issue
- 1
- Pages
- 11-11
- ISSN
- 1749-8546 (ISSN-L)
- PMC
- PMC12777056
- OpenAlex
- W7119109165
- Cited by
- 0
- References
- 47
- FWCI
- 0.00
- Type
- journal article
- Language
- en
- Open access
- gold
- doi.org
- Licence
- cc-by
- creativecommons.org/licenses/by/4.0 (tdm)
- creativecommons.org/licenses/by/4.0 (vor)
- Locations
- Chinese Medicine (publishedVersion, cc-by)
- Research Square (acceptedVersion, cc-by)
- PubMed (publishedVersion)
- PubMed Central (publishedVersion, cc-by)
- DOAJ (DOAJ: Directory of Open Access Journals) (submittedVersion, cc-by-sa)
- Funders
- the National Natural Science Foundation of China (82274218)
- Topics
- Life Sciences › Neuroscience › Neurology › Neurological Disease Mechanisms and Treatments
- Life Sciences › Biochemistry, Genetics and Molecular Biology › Molecular Biology › Sphingolipid Metabolism and Signaling
- Life Sciences › Neuroscience › Developmental Neuroscience › Neurogenesis and neuroplasticity mechanisms
- Keywords
- Danggui Shaoyao San, vascular dementia, sphingolipid metabolism, oligodendrocyte differentiation, remyelination, sphingosine-1-phosphate, oligodendrocyte precursor cells, cognitive impairment, albiflorin, gallic acid, traditional Chinese medicine formula, bilateral common carotid artery occlusion, gut microbiota
About these checks
Registry, retraction, Cites and statistics results are computed, not judged, with one exception: a printed reference that no index lists is read once by a model before it counts as a citation error. Claims are extracted by a model and kept only when their quote appears verbatim in the text; each cited source is then checked, with a model’s help, for whether it says what the claim relies on. Those verdicts can be wrong — read the claim’s quote and the cited source before relying on one.
Statistics and arithmetic are recomputed, not judged.
Confidence bands are shown only for fields calibrated on our annotated test set. None is calibrated yet, so no band is shown.
What counts as a claim ›How we measure confidence ›How we check this ›
Are you an author, or do you see a problem with this page? Request a review
Data sources
Bibliographic data: Semantic Scholar, OpenAlex, Crossref.
Contains information from the Semantic Scholar Academic Graph Datasets, made available under the ODC Attribution License (ODC-BY 1.0).
Semantic Scholar’s data is described in: Kinney, R., et al. (2023). The Semantic Scholar Open Data Platform. arXiv:2301.10140.
