

The DOI matches its Crossref record; 45 of the 45 references it cites were found in a registry or an index.
PD-1 axis expression in musculoskeletal tumors and antitumor effect of nivolumab in osteosarcoma model of humanized mouse
Open accessAbstract
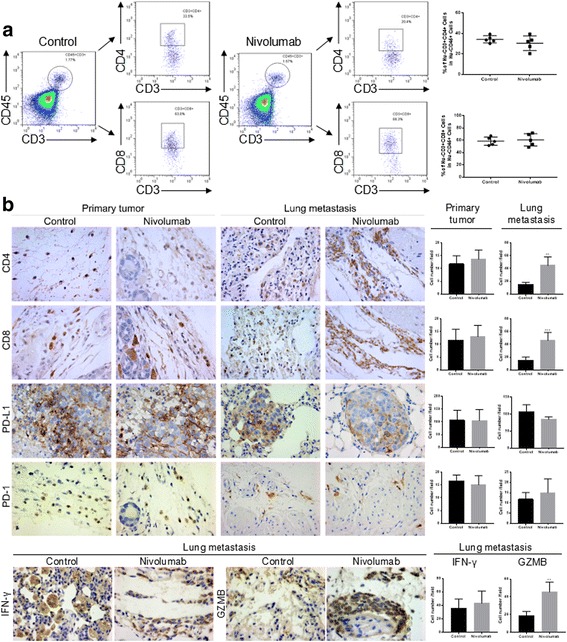
BACKGROUND: Immune checkpoint inhibitors have led to a breakthrough in solid tumor immunotherapy, but related studies on musculoskeletal tumors are few, especially for PD-L2. METHODS: We examined expression of three molecular effectors of the PD-1 axis in 234 patients with musculoskeletal tumors, including osteosarcoma, chondrosarcoma, synovial sarcoma, and giant cell tumor. Survival analyses and potential mechanisms were investigated in osteosarcoma per the Gene Expression Omnibus (GEO) and immunohistochemistry analyses. In vivo, humanized mice were used to evaluate the effect of nivolumab on osteosarcoma. RESULTS: PD-L1, PD-L2, and PD-1 expression levels were significantly different between the histologic types of the musculoskeletal tumors. For osteosarcoma, PD-L1 was negatively correlated with prognosis, while PD-1 had a negative correlation tendency with overall survival (OS). Meanwhile, PD-L2 had a positive correlation trend with OS. Nivolumab inhibited osteosarcoma metastasis in humanized mice by increasing CD4+ and CD8+ lymphocytes and the cytolytic activity of CD8 lymphocytes in the lung but did not affect primary osteosarcoma growth. CONCLUSION: We systematically detected the expression patterns of PD-L1, PD-L2, and PD-1 in musculoskeletal tumors for the first time and demonstrated the prognostic roles and underlying mechanisms of PD-1 axis in osteosarcoma. Furthermore, PD-1 blockade could effectively control osteosarcoma pulmonary metastasis in vivo. Therefore, the PD-1 axis may be a potential immunotherapeutic target for metastatic osteosarcoma.
Overview
The claims and statistics of this paper haven’t been checked yet.
Run the check — free, no account needed. It reads the open-access text and checks the sources it cites.
Integrity signals
Registry
Cites
Statistics
Figures
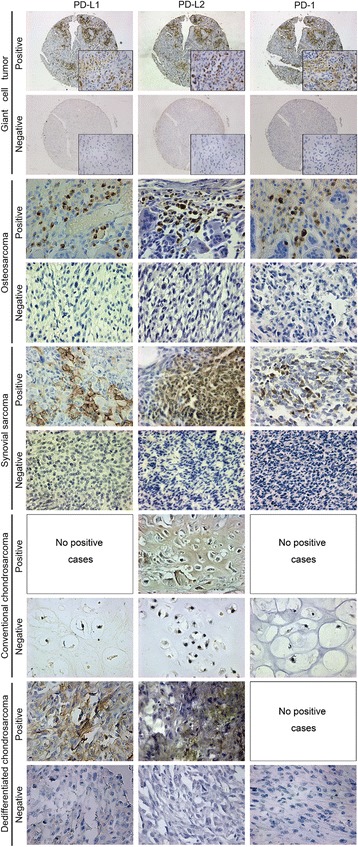
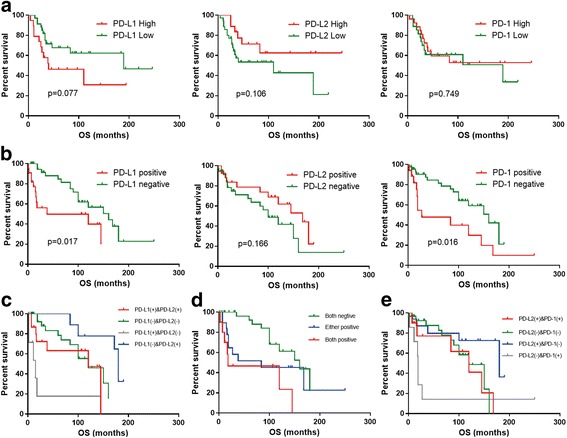
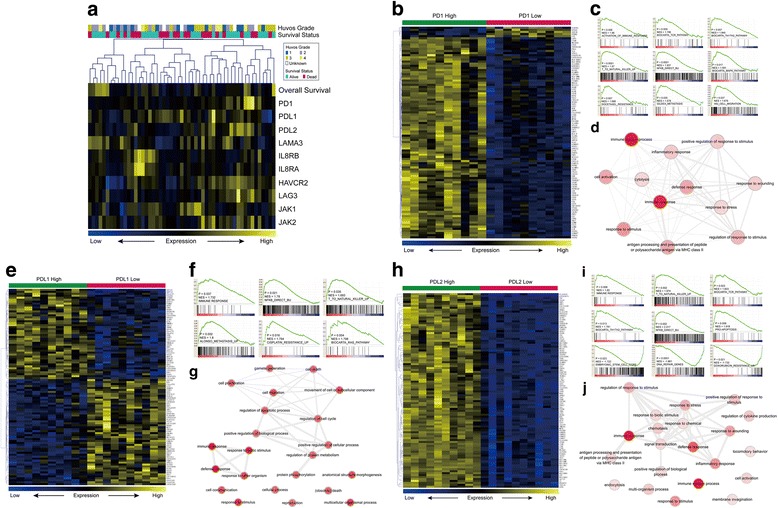
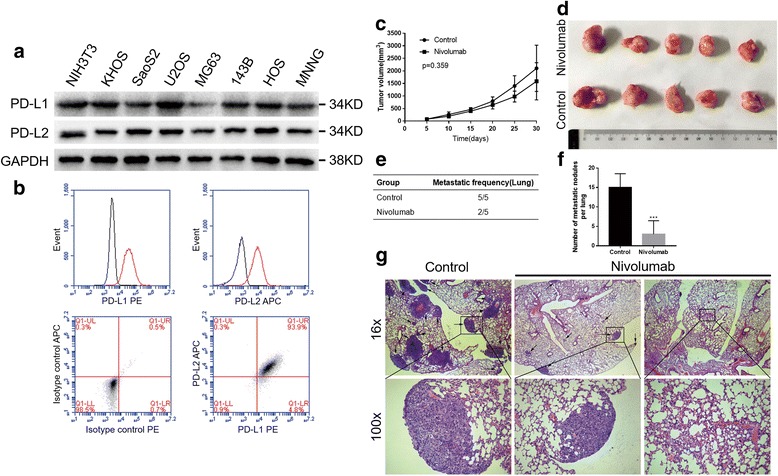
Verification
Claims the paper makes
The claims and statistics of this paper haven’t been checked yet.
Run the check — free, no account needed. It reads the open-access text and checks the sources it cites.
Claims other papers make about this one
Each is checked against this paper’s own text: does it say what the citing paper says it does?
The cited source says what the claim attributes to it.
In the citing paper
“Nivolumab (anti-PD-1 antibody) inhibits osteosarcoma metastasis in human PBMC-engrafted mouse models.”
From Advances on immunotherapy for osteosarcoma (2024) · cites this paper as [83]
The cited source says what the claim attributes to it.
In the citing paper
“The further study of mechanisms indicated that nivolumab promotes tumor lymphocyte infiltration (CD4+ and CD8+ lymphocytes) and enhances the cytolytic activity of CD8 lymphocytes in lung metastases [83].”
From Advances on immunotherapy for osteosarcoma (2024) · cites this paper as [83]
Self-check
Percentages, sums and reported differences re-computed from the paper’s own numbers.
The self-check needs the paper’s full text.
Citations
Cites
Subramanian, A., Tamayo, P., Mootha, V. K., Mukherjee, S., Ebert, B. L., Gillette, M. A., Paulovich, A., Pomeroy, S. L., Golub, T. R., Lander, E. S., et al. (2005) · Proceedings of the National Academy of Sciences · doi:10.1073/pnas.0506580102 · Cited by 53,625
PD-1 and PD-L1 Immune Checkpoint Blockade to Treat Breast Cancer
Hartkopf, A. D., Taran, F., Wallwiener, M., Walter, C. B., Krämer, B., Grischke, E., & Brucker, S. Y. (2016) · Breast Care · doi:10.1159/000453569 · Cited by 30,989
Adverse Renal Effects of Immune Checkpoint Inhibitors: A Narrative Review
Wanchoo, R., Karam, S., Uppal, N. N., Barta, V. S., Deray, G., Devoe, C., Launay‐Vacher, V., Jhaveri, K. D., & on behalf of Cancer and Kidney International Network Workgroup on Immune Checkpoint Inhibitors (2017) · American Journal of Nephrology · doi:10.1159/000455014 · Cited by 15,320
Gene Expression Omnibus: NCBI gene expression and hybridization array data repository
Edgar, R. (2002) · Nucleic Acids Research · doi:10.1093/nar/30.1.207 · Cited by 13,288
REVIGO summarizes and visualizes long lists of gene ontology terms
Supek, F., Bošnjak, M., Škunca, N., & Šmuc, T. (2011) · PLoS ONE · doi:10.1371/journal.pone.0021800 · Cited by 6,264
Freeman, G. J., Long, A. J., Iwai, Y., Bourque, K., Chernova, T., Nishimura, H., Fitz, L. J., Malenkovich, N., Okazaki, T., Byrne, M. C., et al. (2000) · The Journal of Experimental Medicine · doi:10.1084/jem.192.7.1027 · Cited by 5,294
Predictive correlates of response to the anti-PD-L1 antibody MPDL3280A in cancer patients
Herbst, R. S., Soria, J.-C., Kowanetz, M., Fine, G. D., Hamid, O., Gordon, M. S., Sosman, J. A., McDermott, D. F., Powderly, J. D., Gettinger, S. N., et al. (2014) · Nature · doi:10.1038/nature14011 · Cited by 5,231
Nivolumab plus Ipilimumab in Advanced Melanoma
Wolchok, J. D., Kluger, H., Callahan, M. K., Postow, M. A., Rizvi, N. A., Lesokhin, A. M., Segal, N. H., Ariyan, C. E., Gordon, R.-A., Reed, K., et al. (2013) · New England Journal of Medicine · doi:10.1056/nejmoa1302369 · Cited by 4,230
Maere, S., Heymans, K., & Kuiper, M. T. R. (2005) · Computer applications in the biosciences · doi:10.1093/bioinformatics/bti551 · Cited by 4,163
Safety and Tumor Responses with Lambrolizumab (Anti–PD-1) in Melanoma
Hamid, O., Robert, C., DAUD, A. I., Hodi, F. S., Hwu, W., Kefford, R. F., Wolchok, J. D., Hersey, P., Joseph, R. W., Weber, J. S., et al. (2013) · New England Journal of Medicine · doi:10.1056/nejmoa1305133 · Cited by 3,427
Cited by
Sorted by citations
Items 101–155 of 155
Analysis of prognostic model based on immunotherapy related genes in lung adenocarcinoma
Zhang, P., Wang, W., Liu, L., Li, H., Sha, X., Wang, S., Huang, Z., Zhou, Y., & Shi, J. (2022) · Scientific Reports · doi:10.1038/s41598-022-26427-0 · Cited by 6
Self-citationChew, H. Y., Chan, V., Simpson, F., & Dolcetti, R. (2020) · Cancers · doi:10.3390/cancers12113392 · Cited by 6
Dedifferentiated Chondrosarcoma: Diagnostic Controversies and Emerging Therapeutic Targets
Beaino, M. E., Hoda, S. T., Eldeib, A. J., & Masrouha, K. Z. (2023) · Current Oncology Reports · doi:10.1007/s11912-023-01441-1 · Cited by 5
A novel aging-associated lncRNA signature for predicting prognosis in osteosarcoma
He, Y., Huang, X., Ma, Y., Yang, G., Cui, Y., Lv, X., Zhao, R., Jin, H., Tong, Y., Zhang, X., et al. (2024) · Scientific Reports · doi:10.1038/s41598-024-51732-1 · Cited by 5
The potentiality of immunotherapy for sarcomas: a summary of potential predictive biomarkers
Liang, J., Chen, D., Chen, L., She, X., Zhang, H., & Xiao, Y. (2020) · Future Oncology · doi:10.2217/fon-2020-0118 · Cited by 5
Кушлинский, Н. Е., Alferov, A. A., Boulytcheva, I. V., Timofeev, Y. S., Korotkova, E. A., Khvan, O. T., Kuzmin, Y. B., Kuznetsov, I. N., Бондарев, А. В., Shchupak, M. Y., et al. (2020) · Russian Clinical Laboratory Diagnostics · doi:10.18821/0869-2084-2020-65-11-669-675 · Cited by 5
Lai, G., Zhao, X., Chen, Y., Xie, T., Su, Z., Lin, J., Chen, K., & Chen, K. (2025) · International Immunopharmacology · doi:10.1016/j.intimp.2025.114260 · Cited by 5
Zeng, Y., Xiang, Y., Chen, L., Wen, Y., Deng, C., Huang, X., Feng, L., Liu, S., & Zhao, H. (2026) · Frontiers in Immunology · doi:10.3389/fimmu.2026.1802194 · Cited by 4
Macrophage and osteosarcoma cell crosstalk is dependent on oxygen tension and 3D culture
Griffin, K. H., Sagheb, I. S., Coonan, T. P., Fierro, F. A., Randall, R. L., & Leach, J. K. (2024) · Biomaterials Advances · doi:10.1016/j.bioadv.2024.214154 · Cited by 4
Inhibitory checkpoint molecule mRNA expression in canine soft tissue sarcoma
Stevenson, V. B., Basso, E. K. G., Klahn, S. L., LeRoith, T., & Huckle, W. R. (2023) · Veterinary and Comparative Oncology · doi:10.1111/vco.12934 · Cited by 4
Zheng, B., Ren, T., Huang, Y., Sun, K., Wang, S., Bao, X., Liu, K., & Guo, W. (2018) · Journal of Hematology & Oncology · doi:10.1186/s13045-018-0580-x · Cited by 4
Self-citationGuo, Q., Ran, C., Wang, Z., Zhang, X., Yao, Y., Chen, X. Y., Zhang, Y., Yang, J., You, Y., & Dw, Z. (2026) · Regenerative Biomaterials · doi:10.1093/rb/rbag031 · Cited by 3
Bang, H. J., Lee, K., Park, M. S., Sun, E. G., Cho, S., Chung, I., Shim, H., & Bae, W. K. (2024) · Scientific Reports · doi:10.1038/s41598-024-69988-y · Cited by 3
Sunbul, F. S., Almuqbil, R. M., Zhang, H., Alhudaithi, S. S., Fernandez, M. E., Aldaqqa, R. R., Garcia, V. A., Robila, V., Halquist, M. S., Gordon, S. W., et al. (2025) · International Journal of Pharmaceutics · doi:10.1016/j.ijpharm.2025.125372 · Cited by 3
Wang, Q., Zhang, W., Guo, Y., Li, Y., & Fu, K. (2021) · Aging · doi:10.18632/aging.203671 · Cited by 3
Advances in T cell–based immunotherapy for osteosarcoma
Zhang, K., Wang, Z., He, J., Lu, L., Wang, W., Yang, A., Xie, H., Huang, L., Huang, Y., Zhang, K., et al. (2026) · Frontiers in Immunology · doi:10.3389/fimmu.2026.1769847 · Cited by 3
Self-citationThe Updated Status and Future Direction of Immunotherapy Targeting B7-H1/PD-1 in Osteosarcoma
Fan, M., Qi, L., Zhang, Q., & Wang, L. (2021) · Cancer Management and Research · doi:10.2147/cmar.s285560 · Cited by 2
Orthotopic PDX and CDX Mice Model for Cancer Stem Cell Research
Das, J., & Das, M. (2022) · Handbook of Animal Models and its Uses in Cancer Research · doi:10.1007/978-981-19-1282-5_26-1 · Cited by 2
Sorteberg, A. L., Ek, L., Lilienthal, I., & Herold, N. (2023) · Springer eBooks · doi:10.1007/978-3-030-80962-1_236-1 · Cited by 2
Niu, C., Wang, W., Xu, Q., Tian, Z., Li, H., Ding, Q., Guo, L., & Zeng, P. (2024) · Discover Oncology · doi:10.1007/s12672-024-01461-8 · Cited by 2
Xu, H., & Tao, H. (2024) · Heliyon · doi:10.1016/j.heliyon.2024.e41191 · Cited by 2
Wang, X., Gan, L., Ju, Y., Tang, M., & Liu, W. (2021) · Journal of Immunology Research · doi:10.1155/2021/9989321 · Cited by 2
Bone Implants (Bone Regeneration and Bone Cancer Treatments)
Sun, H., Zhou, X., Zhang, Y., Zhang, L., Yu, X., Ye, Z., & Laurencin, C. T. (2022) · Wiley eBooks · doi:10.1002/9783527831371.ch10 · Cited by 2
Hay, A. N., Simon, A., Ruger, L. N., Gannon, J., Coutermarsh‐Ott, S. L., Vickers, E., Eward, W. C., Neufeld, N. J., Vlaisavljevich, E., & Tuohy, J. L. (2025) · Biomedicines · doi:10.3390/biomedicines13092122 · Cited by 1
Sorteberg, A. L., Ek, L., Lilienthal, I., & Herold, N. (2025) · Springer eBooks · doi:10.1007/978-3-032-00769-8_236 · Cited by 1
BMP-9 promotes the expression of PD-L1 in osteosarcoma cells through FOXO1
Zhang, W., Ge, Y., & Xu, X. (2025) · Medical Oncology · doi:10.1007/s12032-025-03097-2 · Cited by 1
Haney, S. L., & Holstein, S. A. (2025) · Cancer Reports · doi:10.1002/cnr2.70390 · Cited by 1
Huang, H., Dong, D., You, H., & Fu, X. (2026) · Frontiers in Immunology · doi:10.3389/fimmu.2026.1826432 · Cited by 1
Paediatric therapeutic development workshop on osteosarcoma
Baxter, J. S., Montiel-Equihua, C., Molenaar, J. J., Berlanga, P., Bishop, M. W., Blanc, P., Campbell-Hewson, Q., Casanova, M., Cortés‐Ciriano, I., Crompton, B. D., et al. (2026) · British Journal of Cancer · doi:10.1038/s41416-026-03572-1 · Cited by 1
Orthotopic PDX and CDX Mice Model for Cancer Stem Cell Research
Das, J., & Das, M. (2023) · Handbook of Animal Models and its Uses in Cancer Research · doi:10.1007/978-981-19-3824-5_26 · Cited by 1
Visual analysis of bone malignancies immunotherapy: A bibliometric analysis from 2010 to 2023
Shen, K., Liu, Y., Ke, S., & Gao, W. (2024) · Medicine · doi:10.1097/md.0000000000037269 · Cited by 1
Wang, J., Zhang, H., Sun, X., Wang, X., Ren, T., Huang, Y., Zhang, R., Zheng, B., & Guo, W. L. (2020) · doi:10.21203/rs.3.rs-40872/v1
Self-citationConstruction and Analysis of a Prognostic Model of Osteosarcoma Based on m6A-Related lncRNAPreprint
Ling, Z., Liang, Y., Wei, S., Chen, Y., & Zhao, J. (2021) · Research Square · doi:10.21203/rs.3.rs-966782/v1
Chen, W.-K., Zhang, H.-J., Jiang, Y.-H., Liu, A., Yin, K., Xie, P.-H., Chen, Y., Dai, Z., & Zhan, X. (2022) · Research Square · doi:10.21203/rs.3.rs-1206956/v1
Shi, J., Li, C., Zhao, Z., Jiang, K., Yang, R., Guo, W., Tang, X., & Yan, T. (2022) · Research Square · doi:10.21203/rs.3.rs-1593614/v1
Self-citationWang, J., Guo, W., Wang, X., Tang, X., Sun, X., & Ren, T. (2023) · doi:10.1158/1078-0432.c.6532946.v1
Self-citationWang, R., Zhang, J., Zhong, K., & Liu, X. (2023) · SSRN Electronic Journal · doi:10.2139/ssrn.4641209
Wang, J., Zhang, H., Sun, X., Wang, X., Ren, T., Huang, Y., Zhang, R., Zheng, B., & Guo, W. (2020) · Figshare · doi:10.6084/m9.figshare.13142107
Self-citationHumanized mouse models in immuno-oncology
Li, S., & Wang, Q. (2024) · Elsevier eBooks · doi:10.1016/b978-0-443-14064-8.00024-2
Wang, K., Silli, E. K., Lv, H., & Song, R. (2025) · Drug Development Research · doi:10.1002/ddr.70207 · Cited by 1
Wu, C., Tan, J., Shen, H., Deng, C., Kleber, C., Osterhoff, G., & Schopow, N. (2024) · Figshare · doi:10.6084/m9.figshare.26666740
Wu, C., Tan, J., Shen, H., Deng, C., Kleber, C., Osterhoff, G., & Schopow, N. (2024) · Figshare · doi:10.6084/m9.figshare.26666737
Wu, C., Tan, J., Shen, H., Deng, C., Kleber, C., Osterhoff, G., & Schopow, N. (2024) · Figshare · doi:10.6084/m9.figshare.26666749
Wu, C., Tan, J., Shen, H., Deng, C., Kleber, C., Osterhoff, G., & Schopow, N. (2024) · Figshare · doi:10.6084/m9.figshare.26666743
Wang, J., Zhang, H., Sun, X., Wang, X., Ren, T., Huang, Y., Zhang, R., Zheng, B., & Guo, W. (2020) · Figshare · doi:10.6084/m9.figshare.13142116
Self-citationWang, J., Zhang, H., Sun, X., Wang, X., Ren, T., Huang, Y., Zhang, R., Zheng, B., & Guo, W. (2020) · Figshare · doi:10.6084/m9.figshare.13142110
Self-citationWang, J., Zhang, H., Sun, X., Wang, X., Ren, T., Huang, Y., Zhang, R., Zheng, B., & Guo, W. (2020) · Figshare · doi:10.6084/m9.figshare.13142113
Self-citationWu, C., Tan, J., Shen, H., Deng, C., Kleber, C., Osterhoff, G., & Schopow, N. (2024) · Figshare · doi:10.6084/m9.figshare.26666746
Li, Y., Li, Z., & Lingyu, C. (2025) · Cancer Investigation · doi:10.1080/07357907.2025.2599376
He, N., Chen, X., & Zhang, C. L. (2026) · International Journal of Genomics · doi:10.1155/ijog/2000690
Gong, R., Xi-min, J., Cui, X., Sun, J.-H., Xie, W., & Zhang, Y. (2026) · Frontiers in Immunology · doi:10.3389/fimmu.2026.1735090
Utilisation de miRNAs thérapeutiques pour traiter les chondrosarcomes et les ostéosarcomes
Veys, C. (2021) · theses.fr (ABES) · doi:10.70675/7a59188ez7981z4d53za4fdz22a6b5deaaad
Nakaya, J., Kojima, R., Nakanishi, S., Miyanishi, Y., Fujii, Y., Tsukao, H., Yamaguchi, W., & 児島, 亨. (2026) · Respiratory Investigation · doi:10.1016/j.resinv.2026.101496
Hay, A. N., Ruger, L. N., Vickers, E., Coutermarsh‐Ott, S. L., Vlaisavljevich, E., & Tuohy, J. L. (2026) · Cancers · doi:10.3390/cancers18152511
Metadata
- Authors
- Zheng, B., Ren, T., Huang, Y., Sun, K., Wang, S., Bao, X., Liu, K., & Guo, W.
- Affiliations
- Peking University People's Hospital (CN)
- Corresponding author
- Guo, Wei
- Venue
- Journal of Hematology & Oncology
- Published
- 2018-02-06
- Volume
- 11
- Issue
- 1
- Pages
- 16-16
- ISSN
- 1756-8722 (ISSN-L)
- PMC
- PMC5801803
- OpenAlex
- W2803454898
- Cited by
- 151
- References
- 45
- Citations by year
- 2026: 9 · 2025: 17 · 2024: 18 · 2023: 19 · 2022: 22 · 2021: 20 · 2020: 29 · 2019: 9 · 2018: 8
- FWCI
- 6.30
- Type
- journal article
- Language
- en
- Update notices
- correction (2018-03-12)
- Open access
- gold
- doi.org
- Licence
- cc-by
- Locations
- Journal of Hematology & Oncology (publishedVersion, cc-by)
- PubMed Central (publishedVersion, cc-by)
- PubMed (publishedVersion)
- DOAJ (DOAJ: Directory of Open Access Journals) (submittedVersion)
- Funders
- National Natural Science Foundation of China (81572633, 81472509)
- Topics
- Health Sciences › Medicine › Oncology › Cancer Immunotherapy and Biomarkers
- Health Sciences › Medicine › Oncology › Sarcoma Diagnosis and Treatment
- Life Sciences › Immunology and Microbiology › Immunology › Immunotherapy and Immune Responses
- Keywords
- PD-L1, PD-L2, nivolumab, osteosarcoma, musculoskeletal tumors, immune checkpoint inhibitors, lung metastasis, humanized mice, CD8+ T cells, prognostic factors, chondrosarcoma, synovial sarcoma, giant cell tumor
- MeSH terms
- Antineoplastic Agents, Immunological, Nivolumab, Adult, Animals, Bone Neoplasms, Chondrosarcoma, Female, Giant Cell Tumors, Humans, Male, Middle Aged, Neoplasms, Connective Tissue, Osteosarcoma, Sarcoma, Synovial, Cell Line, Tumor, Mice, Young Adult, B7-H1 Antigen, Programmed Cell Death 1 Receptor, Programmed Cell Death 1 Ligand 2 Protein
About these checks
Registry, retraction, Cites and statistics results are computed, not judged, with one exception: a printed reference that no index lists is read once by a model before it counts as a citation error. Claims are extracted by a model and kept only when their quote appears verbatim in the text; each cited source is then checked, with a model’s help, for whether it says what the claim relies on. Those verdicts can be wrong — read the claim’s quote and the cited source before relying on one.
Statistics and arithmetic are recomputed, not judged.
Confidence bands are shown only for fields calibrated on our annotated test set. None is calibrated yet, so no band is shown.
What counts as a claim ›How we measure confidence ›How we check this ›
Are you an author, or do you see a problem with this page? Request a review
