

The DOI matches its Crossref record; 42 of the 42 references it cites were found in a registry or an index.
Intestinal dysbacteriosis-induced IL-25 promotes development of HCC via alternative activation of macrophages in tumor microenvironment
Open accessAbstract
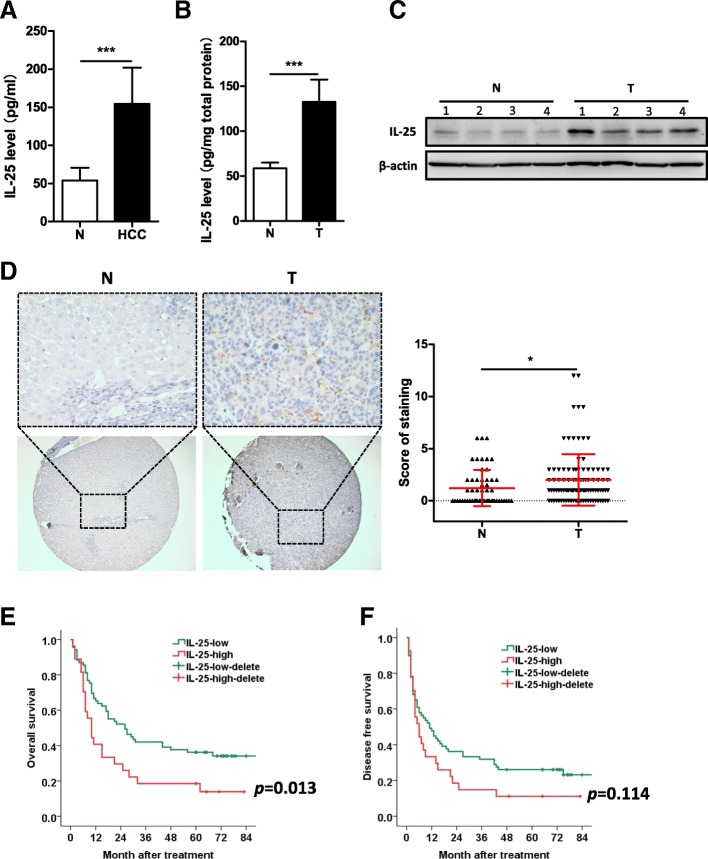
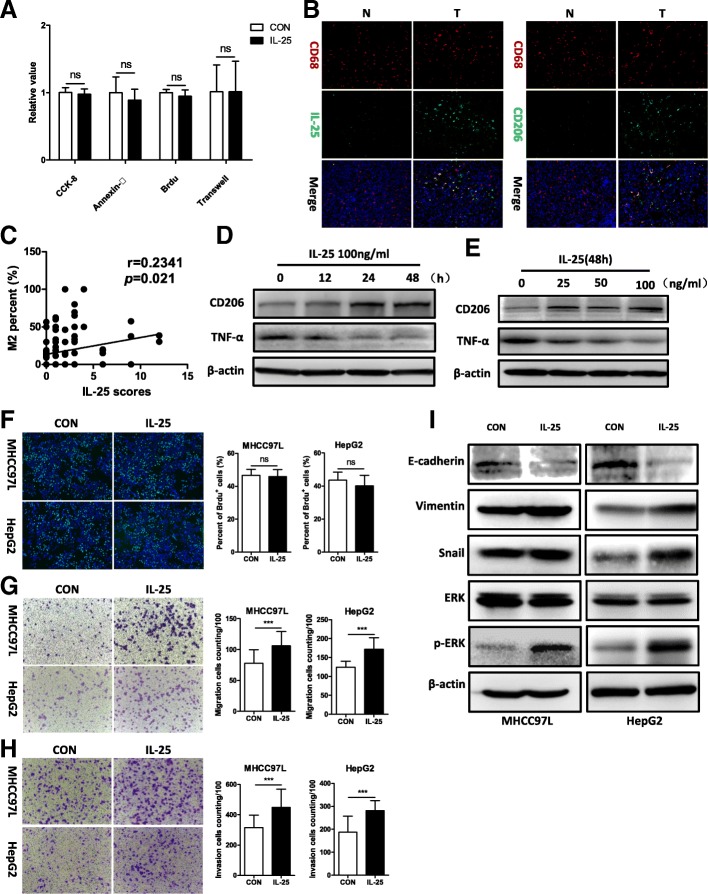
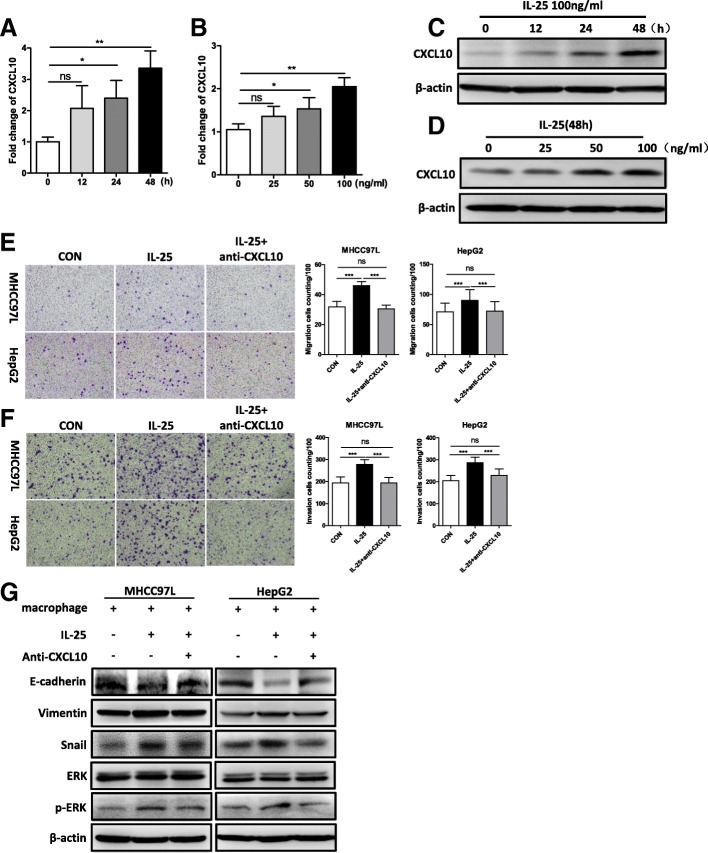
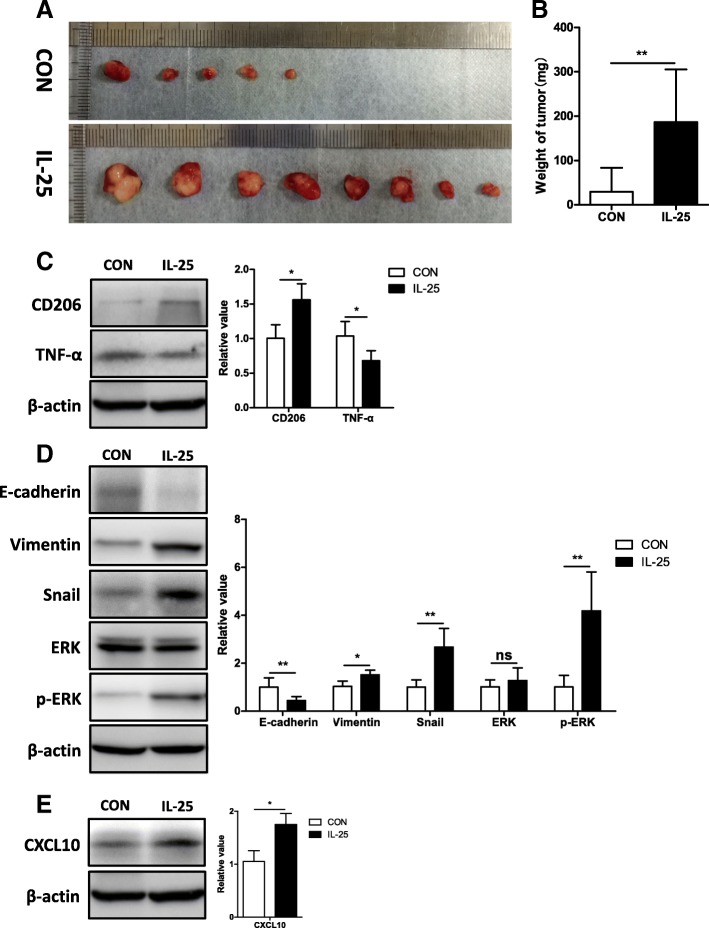
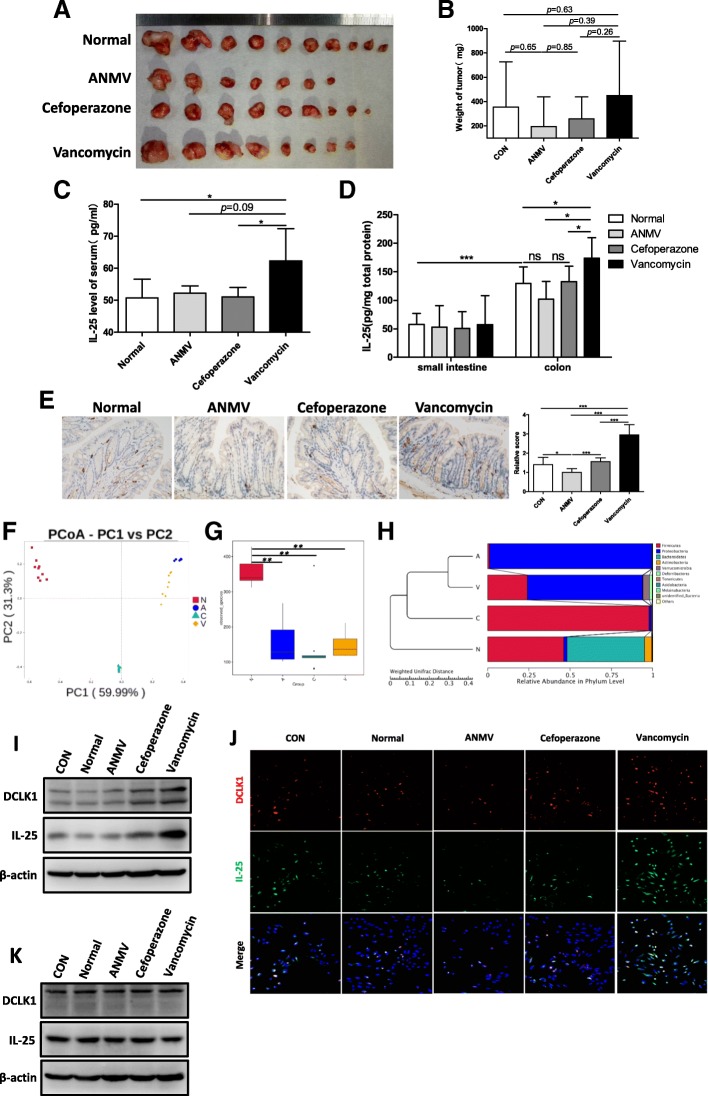
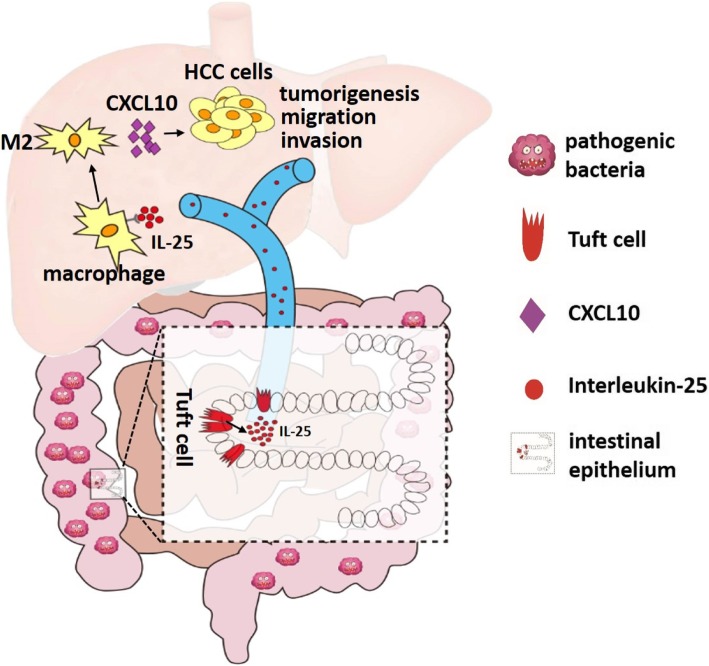
BACKGROUND: Gut microbiota and the tumor microenvironment are thought to be critical factors that modulate the processes of liver diseases, including hepatocellular carcinoma (HCC). Interleukin-25 (IL-25) promotes type 2 immunity via alternative activation of macrophages, and is closely associated with inflammation-related diseases, even malignancies. However, it is not clear which role IL-25 plays in the development of HCC, and whether gut microbiota are involved. METHODS: IL-25 was detected by ELISA, Western blotting (WB), and immunohistochemistry. Chemokines were measured by RT-qPCR and WB. After co-culture with IL-25-stimulated macrophages, the cell growth, migration, invasion and EMT marker of HCC cell lines (MHCC97L and HepG2) were evaluated by Brdu proliferation, Transwell assays and WB. An antibody neutralization assay of chemokine CXCL10 was performed to confirm its role in HCC development. Furthermore, the effects of IL-25 in HCC were investigated in vivo. Dysbiosis of gut microflora was induced by antibiotics (vancomycin, cefoperazone or combination of ampicillin, neomycin, metronidazole, and vancomycin). We used feces suspension to treat colonic epithelial NCM460 cells, and detected IL-25 and tuft cell marker DCLK1 using WB and immunofluorescence staining. RESULTS: We found that the level of IL-25 was significantly elevated in HCC patients, and was negatively correlated with survival rate after hepatectomy. However, IL-25 did not directly promote the development of HCC cells. Then, we observed the significant positive correlation between IL-25 level and M2 percentage (CD206/CD68) in HCC tumors. In vitro and in vivo, IL-25 induced alternative activation of macrophages promoted HCC cell migration, invasion and tumorigenesis, increased the expression of vimentin, Snail and phospho-ERK, and decreased the expression of E-cadherin in HCC cells. After IL-25 treatment, chemokine CXCL10 was increased in macrophages. Neutralizing CXCL10 in macrophage-conditioned medium reversed the IL-25-mediated effect on HCC cells. Vancomycin-induced dysbiosis promoted the growth of orthotopic HCC homograft. Surprisedly, we found the hyperplasia of colonic epithelial tuft cells, from which more IL-25 was secreted . CONCLUSIONS: IL-25 promotes the progression of HCC through inducing alternative activation and CXCL10 secretion of macrophages in tumor microenvironment, and IL-25 secretion may partly result from hyperplastic epithelial tuft cells in colon, induced by gut microbiota dysbiosis.
Overview
The claims and statistics of this paper haven’t been checked yet.
Run the check — free, no account needed. It reads the open-access text and checks the sources it cites.
Integrity signals
Registry
Cites
Statistics
Figures
Verification
Claims the paper makes
The claims and statistics of this paper haven’t been checked yet.
Run the check — free, no account needed. It reads the open-access text and checks the sources it cites.
Claims other papers make about this one
Each is checked against this paper’s own text: does it say what the citing paper says it does?
In the citing paper
“Emerging evidence demonstrated that the disruption of microbiota resulted in immunosuppression via inducing M2-like TAM.”
From Gut microbiota-mediated immunomodulation in tumor (2021) · cites this paper as [16]
In the citing paper
“Further investigation found that dysbacteriosis resulted in hyperplasia of intestinal epithelial tuft cells, from which IL-25 was derived [16].”
From Gut microbiota-mediated immunomodulation in tumor (2021) · cites this paper as [16]
Self-check
Percentages, sums and reported differences re-computed from the paper’s own numbers.
The self-check needs the paper’s full text.
Citations
Cites
Cancer incidence and mortality worldwide: Sources, methods and major patterns in GLOBOCAN 2012
Ferlay, J., Soerjomataram, I., Dikshit, R., Eser, S., Mathers, C., Rebelo, M., Parkin, D. M., Forman, D., & Bray, F. (2015) · International Journal of Cancer · doi:10.1002/ijc.29210 · Cited by 28,766
Mantovani, A., Allavena, P., Sica, A., & Balkwill, F. (2008) · Nature · doi:10.1038/nature07205 · Cited by 11,399
Forner, A., Reig, M., & Bruix, J. (2018) · The Lancet · doi:10.1016/s0140-6736(18)30010-2 · Cited by 5,774
MANTOVANI, A., SOZZANI, S., LOCATI, M., ALLAVENA, P., & SICA, A. (2002) · Trends in Immunology · doi:10.1016/s1471-4906(02)02302-5 · Cited by 5,528
Interleukin-17 Family Members and Inflammation
Kolls, J. K., & Lindén, A. (2004) · Immunity · doi:10.1016/j.immuni.2004.08.018 · Cited by 2,371
Promotion of Hepatocellular Carcinoma by the Intestinal Microbiota and TLR4
Dapito, D. H., Mencin, A., Gwak, G.-Y., Pradere, J.-P., Jang, M.-K., Mederacke, I., Caviglia, J. M., Khiabanian, H., Adeyemi, A., Bataller, R., et al. (2012) · Cancer Cell · doi:10.1016/j.ccr.2012.02.007 · Cited by 1,346
Pathogenesis, Diagnosis, and Management of Cholangiocarcinoma
Ilyas, S. I., & Gores, G. J. (2013) · Gastroenterology · doi:10.1053/j.gastro.2013.10.013 · Cited by 1,331
Tuft-cell-derived IL-25 regulates an intestinal ILC2-epithelial response circuit
von Moltke, J., Ji, M., Liang, H.-E., & Locksley, R. M. (2016) · Nature · doi:10.1038/nature16161 · Cited by 1,230
Intestinal epithelial tuft cells initiate type 2 mucosal immunity to helminth parasites
Gerbe, F., Sidot, E., Smyth, D. J., Ohmoto, M., Matsumoto, I., Dardalhon, V., Cesses, P., Garnier, L., Pouzolles, M., Brulin, B., et al. (2016) · Nature · doi:10.1038/nature16527 · Cited by 1,002
Meng, F., Wang, K., Aoyama, T., Grivennikov, S. I., Paik, Y., Scholten, D., Cong, M., Iwaisako, K., Liu, X., Zhang, M., et al. (2012) · Gastroenterology · doi:10.1053/j.gastro.2012.05.049 · Cited by 711
Cited by
Sorted by citations
Items 101–104 of 104
Interleukin-25: orchestrating resistance to intestinal helminth infections
Cociancic, P., Fiallos, E., Esteban, J. G., Muñoz-Antolí, C., & Toledo, R. (2026) · Trends in Parasitology · doi:10.1016/j.pt.2026.07.010
段和清, Liu, X., Yang, X., Cai, D., Li, X., Cao, J.-Z., Liu, J., 廖首生, Liu, Y., & Zou, Z. (2026) · International Immunopharmacology · doi:10.1016/j.intimp.2026.117246
Gastrointestinal Microbiome Dysbiosis in Cancer Development: Mechanisms and Biomarker Potential
Asgari, N., Asghari, M., & Farazmandfar, T. (2026) · MicrobiologyOpen · doi:10.1002/mbo3.70404
Yang, J., Liu, L., Liu, Y., Zhang, W., Chen, H., Gao, T., Luo, B., Li, X., & Zhou, Y. (2026) · Frontiers in Immunology · doi:10.3389/fimmu.2026.1985689
Metadata
- Authors
- Li, Q., Ma, L., Shen, S., Guo, Y., Cao, Q., Cai, X., Feng, J., Yan, Y., Hu, T., Luo, S., Zhou, L., Peng, B., Yang, Z., & Hua, Y.
- Affiliations
- The First Affiliated Hospital, Sun Yat-sen University (CN)
- Sun Yat-sen University (CN)
- Foshan University (CN)
- Southern Medical University (CN)
- Corresponding author
- Peng, Baogang
- Yang, Zhonghan
- Hua, Yunpeng
- ORCID
- Venue
- Journal of Experimental & Clinical Cancer Research
- Published
- 2019-07-11
- Volume
- 38
- Issue
- 1
- Pages
- 303-303
- ISSN
- 0392-9078 (ISSN-L)
- 1756-9966
- PMC
- PMC6625119
- OpenAlex
- W2960833787
- Cited by
- 104
- References
- 42
- Citations by year
- 2026: 13 · 2025: 12 · 2024: 18 · 2023: 19 · 2022: 15 · 2021: 14 · 2020: 10 · 2019: 2
- FWCI
- 4.09
- Type
- journal article
- Language
- en
- Open access
- gold
- doi.org
- Locations
- Journal of Experimental & Clinical Cancer Research (publishedVersion, cc-by)
- PubMed Central (publishedVersion, cc-by)
- PubMed (publishedVersion)
- DOAJ (DOAJ: Directory of Open Access Journals) (submittedVersion, cc-by-sa)
- Funders
- Science and Technology Project of Guangzhou city (201707010387)
- Science and Technology Project of Guangdong Province (2014A020212626)
- the Scientific Research Foundation for Returned Overseas Chinese Scholars, State Education Ministry (2015, no. 311)
- the National Nature Science Foundation of China (81501677, 81772095, 81370945)
- the Science and Technology Project of Guangzhou city (201807010069)
- Natural Science Foundation of Guangdong Province (2016A030313575)
- Topics
- Life Sciences › Immunology and Microbiology › Immunology › Immune cells in cancer
- Health Sciences › Medicine › Hepatology › Hepatocellular Carcinoma Treatment and Prognosis
- Health Sciences › Medicine › Hepatology › Liver physiology and pathology
- Keywords
- gut dysbiosis, gut microbiota, IL-25, hepatocellular carcinoma, M2 macrophages, alternative macrophage activation, tumor microenvironment, CXCL10, epithelial-mesenchymal transition, antibiotic-induced dysbiosis, tuft cells, DCLK1, Th2 immune response, tumor cell migration and invasion
- MeSH terms
- Gastrointestinal Microbiome, Animals, Cell Movement, Disease Models, Animal, Female, Carcinoma, Hepatocellular, Humans, Liver Neoplasms, Macrophage Activation, Macrophages, Male, Prognosis, Biomarkers, Immunophenotyping, Interleukin-17, Cell Line, Tumor, Cell Proliferation, Mice, Epithelial-Mesenchymal Transition, Tumor Microenvironment, Dysbiosis
About these checks
Registry, retraction, Cites and statistics results are computed, not judged, with one exception: a printed reference that no index lists is read once by a model before it counts as a citation error. Claims are extracted by a model and kept only when their quote appears verbatim in the text; each cited source is then checked, with a model’s help, for whether it says what the claim relies on. Those verdicts can be wrong — read the claim’s quote and the cited source before relying on one.
Statistics and arithmetic are recomputed, not judged.
Confidence bands are shown only for fields calibrated on our annotated test set. None is calibrated yet, so no band is shown.
What counts as a claim ›How we measure confidence ›How we check this ›
Are you an author, or do you see a problem with this page? Request a review
