

The DOI matches its Crossref record; 1 of the 1 references it cites were found in a registry or an index.
Integrative multi-omics analysis unravels the host response landscape and reveals a serum protein panel for early prognosis prediction for ARDS
Open accessAbstract
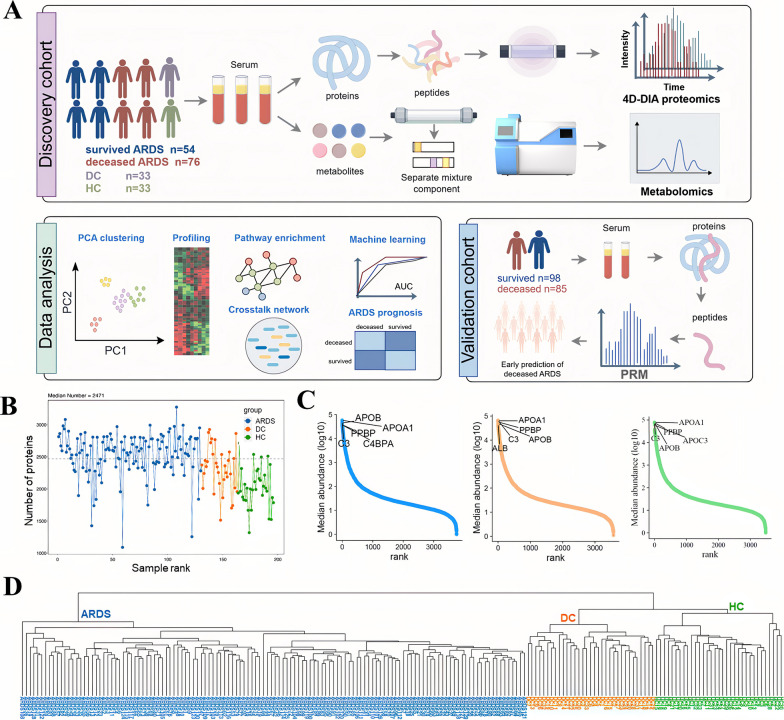
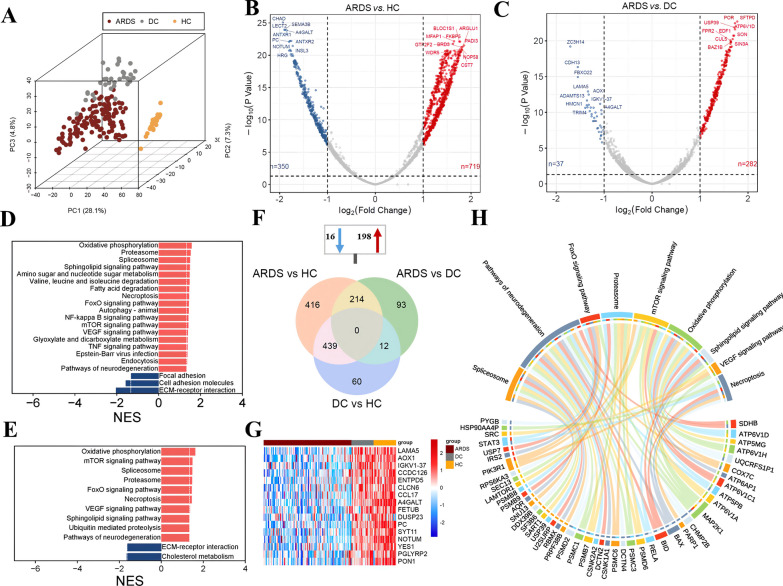
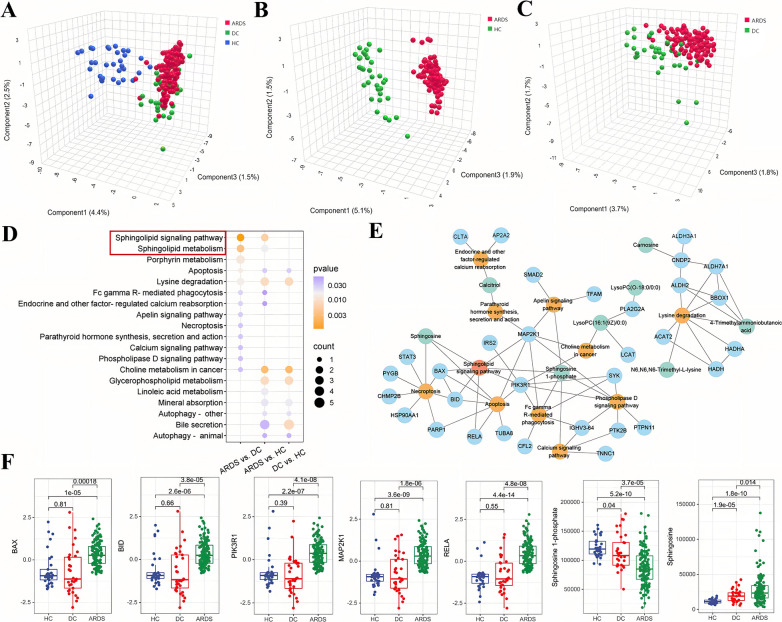
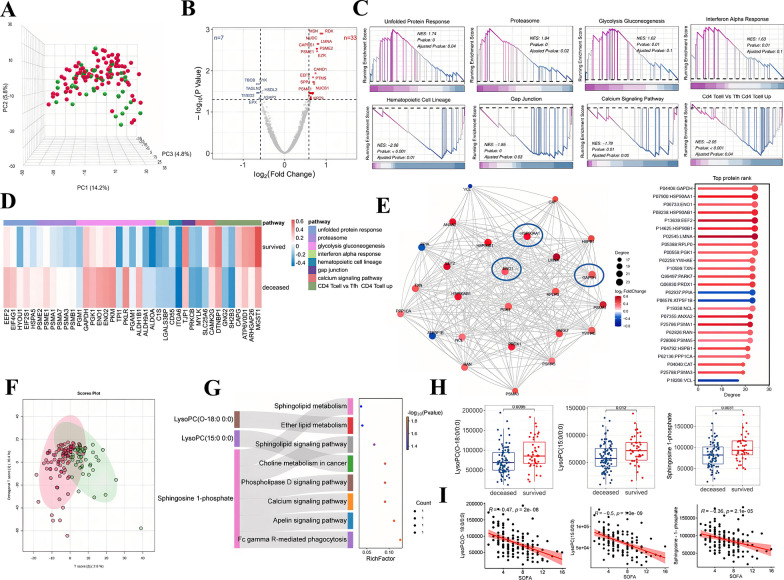
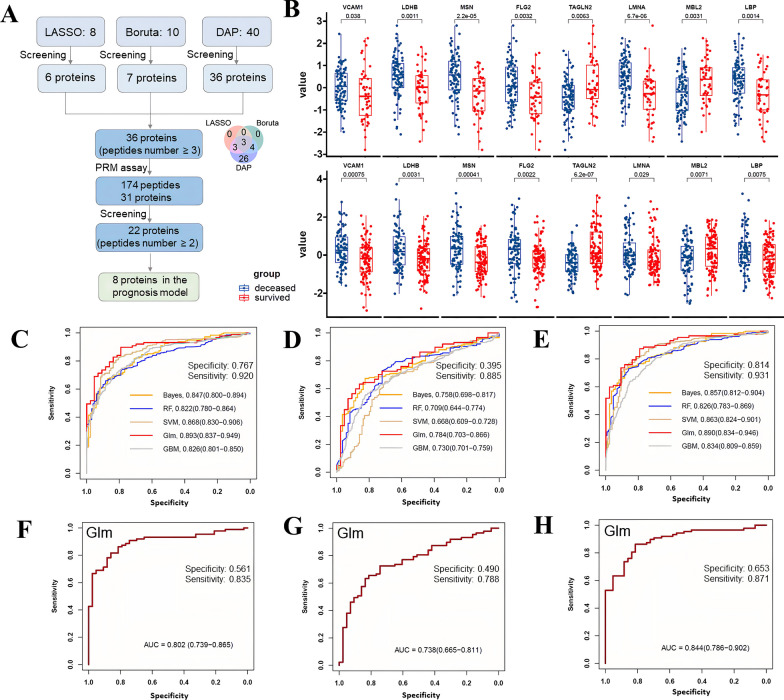
BACKGROUND: The multidimensional biological mechanisms underpinning acute respiratory distress syndrome (ARDS) continue to be elucidated, and early biomarkers for predicting ARDS prognosis are yet to be identified. METHODS: We conducted a multicenter observational study, profiling the 4D-DIA proteomics and global metabolomics of serum samples collected from patients at the initial stage of ARDS, alongside samples from both disease control and healthy control groups. We identified 28-day prognosis biomarkers of ARDS in the discovery cohort using the LASSO method, fold change analysis, and the Boruta algorithm. The candidate biomarkers were validated through parallel reaction monitoring (PRM) targeted mass spectrometry in an external validation cohort. Machine learning models were applied to explore the biomarkers of ARDS prognosis. RESULTS: In the discovery cohort, comprising 130 adult ARDS patients (mean age 72.5, 74.6% male), 33 disease controls, and 33 healthy controls, distinct proteomic and metabolic signatures were identified to differentiate ARDS from both control groups. Pathway analysis highlighted the upregulated sphingolipid signaling pathway as a key contributor to the pathological mechanisms underlying ARDS. MAP2K1 emerged as the hub protein, facilitating interactions with various biological functions within this pathway. Additionally, the metabolite sphingosine 1-phosphate (S1P) was closely associated with ARDS and its prognosis. Our research further highlights essential pathways contributing to the deceased ARDS, such as the downregulation of hematopoietic cell lineage and calcium signaling pathways, contrasted with the upregulation of the unfolded protein response and glycolysis. In particular, GAPDH and ENO1, critical enzymes in glycolysis, showed the highest interaction degree in the protein-protein interaction network of ARDS. In the discovery cohort, a panel of 36 proteins was identified as candidate biomarkers, with 8 proteins (VCAM1, LDHB, MSN, FLG2, TAGLN2, LMNA, MBL2, and LBP) demonstrating significant consistency in an independent validation cohort of 183 patients (mean age 72.6 years, 73.2% male), confirmed by PRM assay. The protein-based model exhibited superior predictive accuracy compared to the clinical model in both the discovery cohort (AUC: 0.893 vs. 0.784; Delong test, P < 0.001) and the validation cohort (AUC: 0.802 vs. 0.738; Delong test, P = 0.008). INTERPRETATION: Our multi-omics study demonstrated the potential biological mechanism and therapy targets in ARDS. This study unveiled several novel predictive biomarkers and established a validated prediction model for the poor prognosis of ARDS, offering valuable insights into the prognosis of individuals with ARDS.
Overview
The claims and statistics of this paper haven’t been checked yet.
Run the check — free, no account needed. It reads the open-access text and checks the sources it cites.
Integrity signals
Registry
Cites
Statistics
Figures
Verification
Claims the paper makes
The claims and statistics of this paper haven’t been checked yet.
Run the check — free, no account needed. It reads the open-access text and checks the sources it cites.
Claims other papers make about this one
Each is checked against this paper’s own text: does it say what the citing paper says it does?
The cited source says what the claim attributes to it.
In the citing paper
“although omics data have been used in unimodal AI models for the ICU [74–76], they were absent from the multimodal studies included in this review.”
From Multimodal Artificial Intelligence for Precision Critical Care: A Scoping Review (2026) · cites this paper as [76]
Self-check
Percentages, sums and reported differences re-computed from the paper’s own numbers.
The self-check needs the paper’s full text.
Citations
Cites
Proteomic and Metabolomic Characterization of COVID-19 Patient Sera
Shen, B., Yi, X., Sun, Y., Bi, X., Du, J., Zhang, C., Quan, S., Zhang, F., Sun, R., Qian, L., et al. (2020) · Cell · doi:10.1016/j.cell.2020.05.032 · Cited by 1,514
Research works printed but not linked: 54
- Chang YJ, Yoo HJ, Kim SJ, Lee KH, Lim CM, Hong SB, Koh Y, Huh JW. A targeted metabolomics approach for sepsis-induced ARDS and its subphenotypes. Crit Care. 2023. https://doi.org/10.1186/s13054-023-04552-0. · DOI
- Ñamendys-Silva SA, Gutiérrez-Villaseñor A, Romero-González JP. Hospital mortality in mechanically ventilated COVID-19 patients in Mexico. Intensive Care Med. 2020;46(11):2086–8. · DOI
- Kneyber MCJ, Khemani RG, Bhalla A, Blokpoel RGT, Cruces P, Dahmer MK, Emeriaud G, Grunwell J, Ilia S, Katira BH, et al. Understanding clinical and biological heterogeneity to advance precision medicine in paediatric acute respiratory distress syndrome. Lancet Resp Med. 2023;11(2):197–212. · DOI
- Shu T, Ning WS, Wu D, Xu JQ, Han QQ, Huang MH, Zou XJ, Yang QY, Yuan Y, Bie YY, et al. Plasma proteomics identify biomarkers and pathogenesis of COVID-19. Immunity. 2020;53(5):1108-1122.e5. · DOI · Paper page
- Gorman EA, O’Kane CM, McAuley DF. Acute respiratory distress syndrome 2022 2 Acute respiratory distress syndrome in adults: diagnosis, outcomes, long-term sequelae, and management. Lancet. 2022;400(10358):1157–70. · DOI
- Li MB, Parker BL, Pearson E, Hunter B, Cao J, Koay YC, Guneratne O, James DE, Yang J, Lal S, et al. Core functional nodes and sex-specific pathways in human ischaemic and dilated cardiomyopathy. Nat Commun. 2020. https://doi.org/10.1038/s41467-020-16584-z. · DOI
- Xu RH, Wang JR, Zhu QQ, Zou C, Wei ZH, Wang H, Ding Z, Meng MJ, Wei HM, Xia SJ, et al. Integrated models of blood protein and metabolite enhance the diagnostic accuracy for Non-Small Cell Lung Cancer. Biomark Res. 2023. https://doi.org/10.1186/s40364-023-00497-2. · DOI
- Ali RO, Quinn GM, Umarova R, Haddad JA, Zhang GY, Townsend EC, Scheuing L, Hill KL, Gewirtz M, Rampertaap S, et al. Longitudinal multi-omics analyses of the gut-liver axis reveals metabolic dysregulation in hepatitis C infection and cirrhosis. Nat Microbiol. 2023;8(1):12–27. · DOI
- Wozniak JM, Mills RH, Olson J, Caldera JR, Sepich-Poore GD, Carrillo-Terrazas M, Tsai CM, Vargas F, Knight R, Dorrestein PC, et al. Mortality risk profiling of Staphylococcus aureus bacteremia by multi-omic serum analysis reveals early predictive and pathogenic signatures. Cell. 2020;182(5):1311-1327e.1314. · DOI
- Wang Y, Huang XL, Li F, Jia XB, Jia N, Fu J, Liu S, Zhang J, Ge HY, Huang SY, et al. Serum-integrated omics reveal the host response landscape for severe pediatric community-acquired pneumonia. Crit Care. 2023. https://doi.org/10.1186/s13054-023-04378-w. · DOI
- Cao SR, Li HQ, Xin JY, Jin ZH, Zhang ZY, Li JW, Zhu YK, Su L, Huang PP, Jiang L, et al. Identification of genetic profile and biomarkers involved in acute respiratory distress syndrome. Intensive care Med. 2023;50(1):49–55.
- Ranieri VM, Rubenfeld GD, Thompson BT, Ferguson ND, Caldwell E, Fan E, Camporota L, Slutsky AS, Force ADT. Acute respiratory distress syndrome the berlin definition. Jama-J Am Med Assoc. 2012;307(23):2526–33.
- Blume JE, Manning WC, Troiano G, Hornburg D, Figa M, Hesterberg L, Platt TL, Zhao XY, Cuaresma RA, Everley PA, et al. Rapid, deep and precise profiling of the plasma proteome with multi-nanoparticle protein corona. Nat Commun. 2020. https://doi.org/10.1038/s41467-020-17033-7. · DOI
- Xing XH, Cai LS, Ouyang JH, Wang F, Li ZM, Liu MX, Wang YC, Zhou Y, Hu E, Huang CL, et al. Proteomics-driven noninvasive screening of circulating serum protein panels for the early diagnosis of hepatocellular carcinoma. Nat Commun. 2023. https://doi.org/10.1038/s41467-023-44255-2. · DOI
- Tang SS, Wang YZ, Luo RK, Fang RD, Liu YF, Xiang H, Ran P, Tong YX, Sun MJ, Tan SB, et al. Proteomic characterization identifies clinically relevant subgroups of soft tissue sarcoma. Nat Commun. 2024;15(1):1381. https://doi.org/10.1038/s41467-024-45306-y. · DOI
- Shannon P, Markiel A, Ozier O, Baliga NS, Wang JT, Ramage D, Amin N, Schwikowski B, Ideker T. Cytoscape: a software environment for integrated models of biomolecular interaction networks. Genome Res. 2003;13(11):2498–504. · DOI · Paper page
- Szklarczyk D, Gable AL, Nastou KC, Lyon D, Kirsch R, Pyysalo S, Doncheva NT, Legeay M, Fang T, Bork P, et al. The STRING database in 2021: customizable protein-protein networks, and functional characterization of user-uploaded gene/measurement sets. Nucleic Acids Res. 2021;49(18):10800–10800. · DOI
- Chin CH, Chen SH, Wu HH, Ho CW, Ko MT, Lin CY. Identifying hub objects and sub-networks from complex interactome. Bmc Syst Biol. 2014;8:S11. · DOI
- Hänzelmann S, Castelo R, Guinney J. GSVA: gene set variation analysis for microarray and RNA-Seq data. Bmc Bioinf. 2013;14:1–15. · DOI · Paper page
- Bojic S, Kotur-Stevuljevic J, Kalezic N, Jelic-Ivanovic Z, Stefanovic A, Palibrk I, Memon L, Kalaba Z, Stojanovic M, Simic-Ogrizovic S. Low paraoxonase 1 activity predicts mortality in surgical patients with sepsis. Dis Markers. 2014;2014: 427378. · DOI
- Lin HS, Liu QSJ, Zhao L, Liu ZQ, Cui HH, Li PH, Fan HJ, Guo LQ. Circulating pulmonary-originated epithelial biomarkers for acute respiratory distress syndrome: a systematic review and meta-analysis. Int J Mol Sci. 2023;24(7):6090. · DOI
- Zhao JP, Yu H, Liu YD, Gibson SA, Yan ZQ, Xu X, Gaggar A, Li PK, Li CL, Wei S, et al. Protective effect of suppressing STAT3 activity in LPS-induced acute lung injury. Am J Physiol-Lung C. 2016;311(5):L868–80. · DOI
- Zeng Y, Adamson RH, Curry FRE, Tarbell JM. Sphingosine-1-phosphate protects endothelial glycocalyx by inhibiting syndecan-1 shedding. Am J Physiol-Heart C. 2014;306(3):H363–72. · DOI
- Uchimido R, Schmidt EP, Shapiro NI. The glycocalyx: a novel diagnostic and therapeutic target in sepsis. Crit Care. 2019;23:1–12. · DOI
- Piotti A, Novelli D, Meessen JMTA, Ferlicca D, Coppolecchia S, Marino A, Salati G, Savioli M, Grasselli G, Bellani G, et al. Endothelial damage in septic shock patients as evidenced by circulating syndecan-1, sphingosine-1-phosphate and soluble VE-cadherin: a substudy of ALBIOS. Crit Care. 2021;25(1):1–12. · DOI
- Natarajan V, Dudek SM, Jacobson JR, Moreno-Vinasco L, Huang LS, Abassi T, Mathew B, Zhao YT, Wang LC, Bittman R, et al. Sphingosine-1-phosphate, FTY720, and sphingosine-1-phosphate receptors in the pathobiology of acute lung injury. Am J Resp Cell Mol. 2013;49(1):6–17. · DOI
- McVerry BJ, Peng XQ, Hassoun PM, Sammani S, Simon BA, Garcia JGN. Sphingosine 1-phosphate reduces vascular leak in murine and canine models of acute lung injury. Am J Resp Crit Care. 2004;170(9):987–93. · DOI
- Peng XQ, Hassoun PM, Sammani S, McVerry BJ, Burne MJ, Rabb H, Pearse D, Tuder RM, Garcia JGN. Protective effects of sphingosine 1-phosphate in murine endotoxin-induced inflammatory lung injury. Am J Resp Crit Care. 2004;169(11):1245–51. · DOI
- Sun XG, Ma SF, Wade MS, Acosta-Herrera M, Villar J, Pino-Yanes M, Zhou T, Liu B, Belvitch P, Moitra J, et al. Functional promoter variants in sphingosine 1-phosphate receptor 3 associate with susceptibility to sepsis-associated acute respiratory distress syndrome. Am J Physiol-Lung C. 2013;305(7):L467–77. · DOI
- Sammani S, Moreno-Vinasco L, Mirzapoiazova T, Singleton PA, Chiang ET, Evenoski CL, Wang T, Mathew B, Husain A, Moitra J, et al. Differential effects of sphingosine 1-phosphate receptors on airway and vascular barrier function in the murine lung. Am J Resp Cell Mol. 2010;43(4):394–402. · DOI
- Naz F, Arish M. Battling COVID-19 pandemic: sphingosine-1-phosphate analogs as an adjunctive therapy? Front Immunol. 2020;11:546310. · DOI
- Singleton PA, Dudek SM, Ma SF, Garcia JGN. Transactivation of sphingosine 1-phosphate receptors is essential for vascular barrier regulation—novel role for hyaluronan and CD44 receptor family. J Biol Chem. 2006;281(45):34381–93. · DOI
- Winkler MS, Nierhaus A, Holzmann M, Mudersbach E, Bauer A, Robbe L, Zahrte C, Geffken M, Peine S, Schwedhelm E, et al. Decreased serum concentrations of sphingosine-1-phosphate in sepsis. Crit Care. 2015;19:1–8. · DOI
- Cyr A, Zhong YJ, Reis SE, Namas RA, Amoscato A, Zuckerbraun B, Sperry J, Zamora R, Vodovotz Y, Billiar TR. Analysis of the plasma metabolome after trauma, novel circulating sphingolipid signatures, and in-hospital outcomes. J Am Coll Surgeons. 2021;232(3):276-287e1. · DOI
- Xiong YB, Piao WJ, Brinkman CC, Li L, Kulinski JM, Olivera A, Cartier A, Hla T, Hippen KL, Blazar BR, et al. CD4 T cell sphingosine 1-phosphate receptor (S1PR)1 and S1PR4 and endothelial S1PR2 regulate afferent lymphatic migration. Sci Immunol. 2019;4(33):eaav1263. · DOI
- Kilpatrick LE, Sun S, Mackie DM, Baik F, Li HY, Korchak HM. Regulation of TNF mediated antiapoptotic signaling in human neutrophils: role of δ-PKC and ERK1/2. J Leukocyte Biol. 2008;83(3):797–797. · DOI
- Wan P, Zhang SM, Ruan ZH, Liu XL, Yang G, Jia YL, Li YK, Pan P, Wang WB, Li G, et al. AP-1 signaling pathway promotes pro-IL-1β transcription to facilitate NLRP3 inflammasome activation upon influenza A virus infection. Virulence. 2022;13(1):502–13. · DOI
- Amunugama K, Pike DP, Ford DA. The lipid biology of sepsis. J Lipid Res. 2021;62:100090. · DOI
- Drobnik W, Liebisch G, Audebert FX, Fröhlich D, Glück T, Vogel P, Rothe G, Schmitz G. Plasma ceramide and lysophosphatidylcholine inversely correlate with mortality in sepsis patients. J Lipid Res. 2003;44(4):754–61. · DOI
- Park DW, Kwak DS, Park YY, Chang Y, Huh JW, Lim CM, Koh Y, Song DK, Hong SB. Impact of serial measurements of lysophosphatidylcholine on 28-day mortality prediction in patients admitted to the intensive care unit with severe sepsis or septic shock. J Crit Care. 2014;29(5):882e.5-882e.11. · DOI
- Ning L, Zou SS, Bo W, Lin HQ. Targeting immunometabolism against acute lung injury. Clin Immunol. 2023;249:109289. · DOI
- Karagiannis F, Peukert K, Surace L, Michla M, Nikolka F, Fox M, Weiss P, Feuerborn C, Maier P, Schulz S, et al. Impaired ketogenesis ties metabolism to T cell dysfunction in COVID-19. Nature. 2022;609(7928):801–7. · DOI
- Osuchowski MF, Winkler MS, Skirecki T, Cajander S, Shankar-Hari M, Lachmann G, Monneret G, Venet F, Bauer M, Brunkhorst FM, et al. The COVID-19 puzzle: deciphering pathophysiology and phenotypes of a new disease entity. Lancet Resp Med. 2021;9(6):622–42. · DOI
- O’Neill LAJ, Kishton RJ, Rathmell J. A guide to immunometabolism for immunologists. Nat Rev Immunol. 2016;16(9):553–65. · DOI · Paper page
- Wang L, Tang Y, Tang JJ, Liu X, Zi SF, Li SL, Chen HB, Liu AR, Huang W, Xie JF, et al. Endothelial cell-derived extracellular vesicles expressing surface VCAM1 promote sepsis-related acute lung injury by targeting and reprogramming monocytes. J Extracell Vesicles. 2024;13(3):e12423. · DOI
- Eisen DP, Dean MM, Boermeester MA, Fidler KJ, Gordon AC, Kronborg G, Kun JFJ, Lau YL, Payeras A, Valdimarsson H, et al. Low serum mannose-binding lectin level increases the risk of death due to pneumococcal infection. Clin Infect Dis. 2008;47(4):510–6. · DOI
- Osthoff M, Rovó A, Stern M, Danner D, Gratwohl A, Tichelli A, Trendelenburg M. Mannose-binding lectin levels and major infections in a cohort of very long-term survivors after allogeneic stem cell transplantation. Haematol-Hematol J. 2010;95(8):1389–96. · DOI
- Mullighan CG, Heatley SL, Danner S, Dean MM, Doherty K, Hahn U, Bradstock KF, Minchinton R, Schwarer AP, Szer J, et al. Mannose-binding lectin status is associated with risk of major infection following myeloablative sibling allogeneic hematopoietic stem cell transplantation. Blood. 2008;112(5):2120–8. · DOI
- Beltinger C. LDHA and LDHB are dispensable for aerobic glycolysis in neuroblastoma cells while promoting their aggressiveness. J Biol Chem. 2019;294(1):66–66. · DOI
- Lagresle-Peyrou C, Luce S, Ouchani F, Soheili TS, Sadek H, Chouteau M, Durand A, Pic I, Majewski J, Brouzes C, et al. X-linked primary immunodeficiency associated with hemizygous mutations in the moesin (MSN) gene. J Allergy Clin Immun. 2016;138(6):1681-1689e.8. · DOI
- Gabarin RS, Li MS, Zimmel PA, Marshall JC, Li YM, Zhang HB. Intracellular and extracellular lipopolysaccharide signaling in sepsis: avenues for novel therapeutic strategies. J Innate Immun. 2021;13(6):323–32. · DOI
- He LG, Liao JQ, Liu Z, Wang T, Zhou Y, Wang TF, Lei BY, Zhou GQ. Multi-omic analysis of mandibuloacral dysplasia type A patient iPSC-derived MSC senescence reveals miR-311 as a novel biomarker for MSC senescence. Hum Mol Genet. 2023;32(19):2872–86. · DOI
- Agren M, Litman T, Eriksen JO, Schjerling P, Bzorek M, Gjerdrum LMR. Gene expression linked to reepithelialization of human skin wounds. Int J Mol Sci. 2022;23(24):15746. · DOI
- Wang LD, Tan H, Huang YL, Guo MY, Dong YX, Liu CX, Zhao H, Liu Z. TAGLN2 promotes papillary thyroid carcinoma invasion via the Rap1/PI3K/AKT axis. Endocr-Relat Cancer. 2023;30(1):e210352. · DOI
Cited by
Sorted by citations
Multimodal Artificial Intelligence for Precision Critical Care: A Scoping Review
Yang, M., Shi, N., Chen, H., Po, E. Y. P., Ng, P. Y., Lai, P. C. K., Wu, Y.-C., & Fong, D. Y. T. (2026) · Health Data Science · doi:10.34133/hds.0356 · Cited by 3
Metadata
- Authors
- Lin, M., Xu, F., Sun, J., Song, J., Shen, Y., Lu, S., Ding, H., Lan, L., Chen, C., Ma, W., Wu, X., Song, Z., & Wang, W.
- Affiliations
- Fudan University (CN)
- Shanghai Medical College of Fudan University (CN)
- Shanghai Jiao Tong University (CN)
- Corresponding author
- Wu, Xueling
- Song, Zhenju
- Wang, Weibing
- Venue
- Critical Care
- Published
- 2024-07-02
- Volume
- 28
- Issue
- 1
- Pages
- 213-213
- ISSN
- 1364-8535 (ISSN-L)
- PMC
- PMC11218270
- OpenAlex
- W4400258367
- Cited by
- 38
- References
- 1
- Citations by year
- 2026: 25 · 2025: 10 · 2024: 3
- FWCI
- 11.04
- Type
- journal article
- Language
- en
- Open access
- gold
- doi.org
- Locations
- Critical Care (publishedVersion, cc-by)
- PubMed Central (publishedVersion, cc-by)
- PubMed (publishedVersion)
- Funders
- National Key Research and Development Program of China (2021YFC2501800)
- National Natural Science Foundation of China (82072214)
- Science and Technology of Shanghai Committee (23Y31900100)
- Shanghai Municipal Science and Technology Major Project (ZD2021CY001)
- Shanghai New Three-year Action Plan for Public Health (GWVI-11.1-03)
- Topics
- Health Sciences › Medicine › Pulmonary and Respiratory Medicine › Respiratory Support and Mechanisms
- Health Sciences › Medicine › Critical Care and Intensive Care Medicine › Sepsis Diagnosis and Treatment
- Physical Sciences › Chemistry › Spectroscopy › Advanced Proteomics Techniques and Applications
- Keywords
- acute respiratory distress syndrome, serum biomarkers, multi-omics integration, proteomics, metabolomics, sphingolipid signaling, sphingosine-1-phosphate, MEK1, glycolysis, unfolded protein response, protein-protein interaction network, VCAM-1, LDHB, MBL2, low back pain, early prediction model, host response
- MeSH terms
- Multiomics, Aged, Aged, 80 and over, Blood Proteins, Female, Humans, Male, Middle Aged, Prognosis, Respiratory Distress Syndrome, Cohort Studies, Biomarkers, Proteomics, Metabolomics
About these checks
Registry, retraction, Cites and statistics results are computed, not judged, with one exception: a printed reference that no index lists is read once by a model before it counts as a citation error. Claims are extracted by a model and kept only when their quote appears verbatim in the text; each cited source is then checked, with a model’s help, for whether it says what the claim relies on. Those verdicts can be wrong — read the claim’s quote and the cited source before relying on one.
Statistics and arithmetic are recomputed, not judged.
Confidence bands are shown only for fields calibrated on our annotated test set. None is calibrated yet, so no band is shown.
What counts as a claim ›How we measure confidence ›How we check this ›
Are you an author, or do you see a problem with this page? Request a review
