

The DOI matches its Crossref record; 104 of the 104 references it cites were found in a registry or an index.
Extensive identification and analysis of conserved small ORFs in animals
Open accessPublished version of a preprint
Abstract
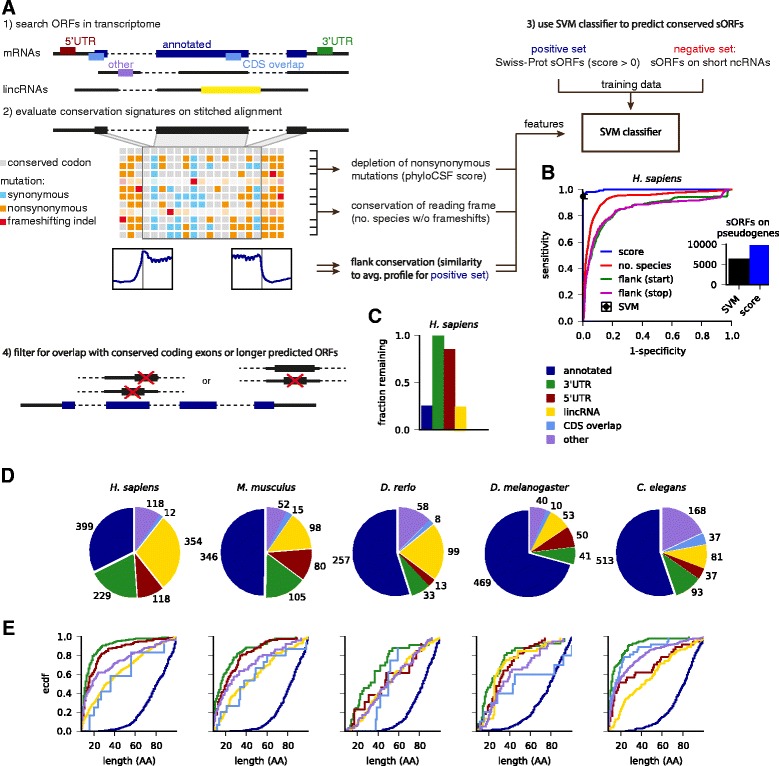
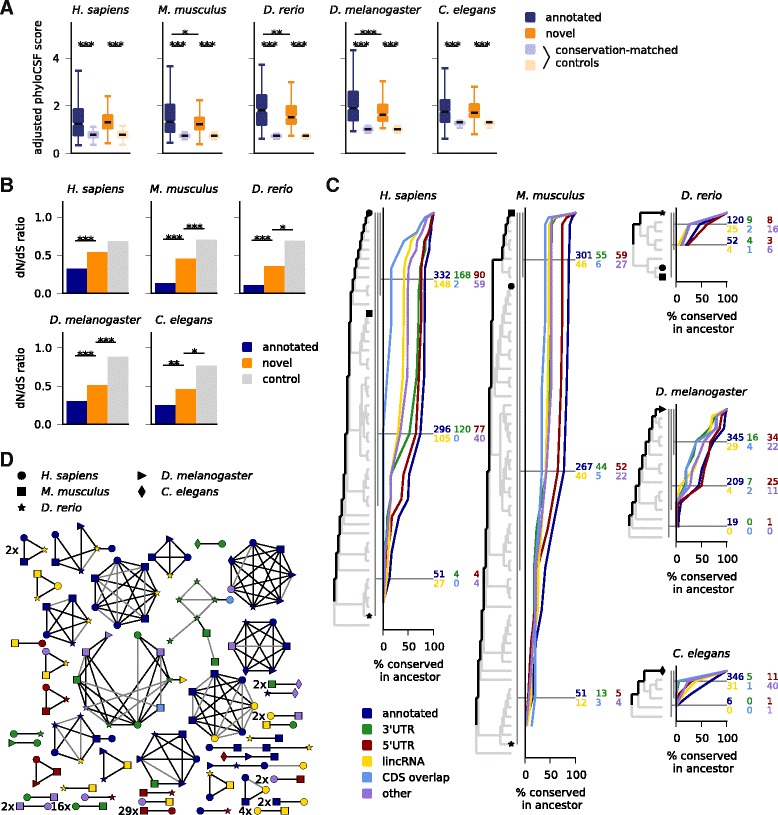
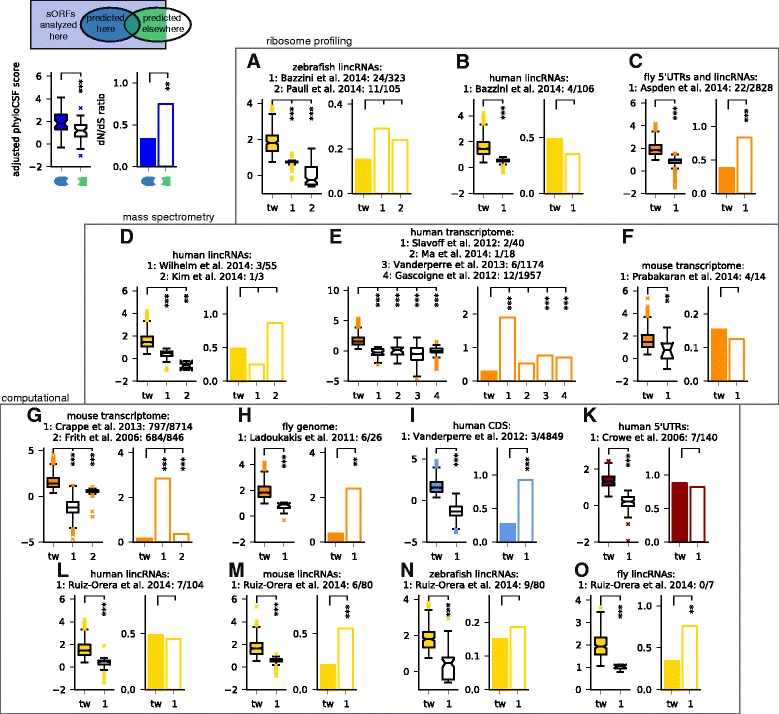
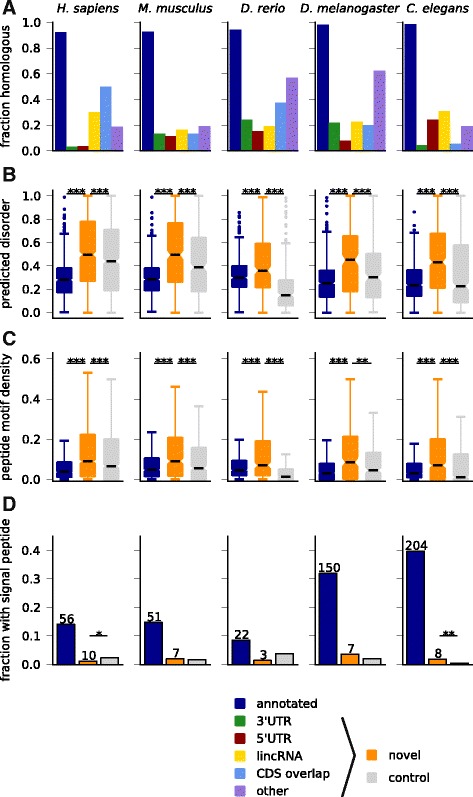
BACKGROUND: There is increasing evidence that transcripts or transcript regions annotated as non-coding can harbor functional short open reading frames (sORFs). Loss-of-function experiments have identified essential developmental or physiological roles for a few of the encoded peptides (micropeptides), but genome-wide experimental or computational identification of functional sORFs remains challenging. RESULTS: Here, we expand our previously developed method and present results of an integrated computational pipeline for the identification of conserved sORFs in human, mouse, zebrafish, fruit fly, and the nematode C. elegans. Isolating specific conservation signatures indicative of purifying selection on amino acid (rather than nucleotide) sequence, we identify about 2,000 novel small ORFs located in the untranslated regions of canonical mRNAs or on transcripts annotated as non-coding. Predicted sORFs show stronger conservation signatures than those identified in previous studies and are sometimes conserved over large evolutionary distances. The encoded peptides have little homology to known proteins and are enriched in disordered regions and short linear interaction motifs. Published ribosome profiling data indicate translation of more than 100 novel sORFs, and mass spectrometry data provide evidence for more than 70 novel candidates. CONCLUSIONS: Taken together, we identify hundreds of previously unknown conserved sORFs in major model organisms. Our computational analyses and integration with experimental data show that these sORFs are expressed, often translated, and sometimes widely conserved, in some cases even between vertebrates and invertebrates. We thus provide an integrated resource of putatively functional micropeptides for functional validation in vivo.
Overview
The claims and statistics of this paper haven’t been checked yet.
Run the check — free, no account needed. It reads the open-access text and checks the sources it cites.
Integrity signals
Registry
Cites
Statistics
Figures
Verification
Claims the paper makes
The claims and statistics of this paper haven’t been checked yet.
Run the check — free, no account needed. It reads the open-access text and checks the sources it cites.
Self-check
Percentages, sums and reported differences re-computed from the paper’s own numbers.
The self-check needs the paper’s full text.
Citations
Cites
Global quantification of mammalian gene expression control
Schwanhäusser, B., Busse, D., Li, N., Dittmar, G., Schuchhardt, J., Wolf, J., Chen, W., & Selbach, M. (2011) · Nature · doi:10.1038/nature10098 · Cited by 6,566 · cited 2×
“[80], using mouse liver from Azimifar et al.”
MethodSelf-citationAndromeda: A Peptide Search Engine Integrated into the MaxQuant Environment
Cox, J., Neuhauser, N., Michalski, A., Scheltema, R. A., Olsen, J. V., & Mann, M. (2011) · Journal of Proteome Research · doi:10.1021/pr101065j · Cited by 5,520
Identification of prokaryotic and eukaryotic signal peptides and prediction of their cleavage sites
Nielsen, H., Engelbrecht, J., Brunak, S., & von HEIJNE, G. (1997) · Protein Engineering Design and Selection · doi:10.1093/protein/10.1.1 · Cited by 5,343
The ENCODE Project Consortium (2007) · Nature · doi:10.1038/nature05874 · Cited by 5,223
Derrien, T., Johnson, R., Bussotti, G., Andrea Tanzer, A., Djebali, S., Tilgner, H., Guernec, G., Martin, D., Merkel, A., Knowles, D. G., et al. (2012) · Genome Research · doi:10.1101/gr.132159.111 · Cited by 5,135
Chromatin signature reveals over a thousand highly conserved large non-coding RNAs in mammals
Guttman, M., Amit, I., Garber, M., French, C., Lin, M. F., Feldser, D., Huarte, M., Zuk, O., Carey, B. W., Cassady, J. P., et al. (2009) · Nature · doi:10.1038/nature07672 · Cited by 4,098
Evolutionarily conserved elements in vertebrate, insect, worm, and yeast genomes
Siepel, A., Bejerano, G., Pedersen, J. S., Hinrichs, A. S., Hou, M., Rosenbloom, K., Clawson, H., Spieth, J., Hillier, L. W., Richards, S., et al. (2005) · Genome Research · doi:10.1101/gr.3715005 · Cited by 3,971 · cited 1×
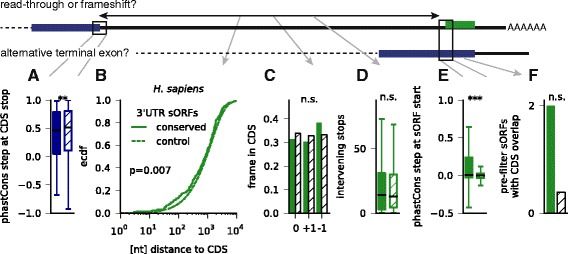
“Finally, we extracted phastCons conservation scores [100] in 50 nt windows around start and stop codon (excluding introns but extending into flanking genomic sequence if necessary) and used the Euclidean distance of the phastCons profiles from the base-wise average over the positive set as third and fourth feature.”
MethodIntrinsically unstructured proteins and their functions
Dyson, H. J., & Wright, P. E. (2005) · Nature Reviews Molecular Cell Biology · doi:10.1038/nrm1589 · Cited by 3,871
Cabili, M. N., Trapnell, C., Goff, L. A., Koziol, M. J., Tazón‐Vega, B., Regev, A., & Rinn, J. L. (2011) · Genes & Development · doi:10.1101/gad.17446611 · Cited by 3,551
The landscape of long noncoding RNAs in the human transcriptome
Iyer, M. K., Niknafs, Y. S., Malik, R., Singhal, U., Sahu, A., Hosono, Y., Barrette, T. R., Prensner, J. R., Evans, J. R., Zhao, S., et al. (2015) · Nature Genetics · doi:10.1038/ng.3192 · Cited by 2,738
Cited by
Sorted by citations
Machine Learning in Agriculture: A Review
Liakos, K., Busato, P., Moshou, D., Pearson, S., & Bochtis, D. (2018) · Sensors · doi:10.3390/s18082674 · Cited by 3,441
The functions and unique features of long intergenic non-coding RNA
Ransohoff, J. D., Wei, Y., & Khavari, P. A. (2017) · Nature Reviews Molecular Cell Biology · doi:10.1038/nrm.2017.104 · Cited by 1,364
The Translational Landscape of the Human Heart
van Heesch, S., Witte, F., Schneider-Lunitz, V., Schulz, J. F., Adami, E., Faber, A. B., Kirchner, M., Maatz, H., Blachut, S., Sandmann, C.-L., et al. (2019) · Cell · doi:10.1016/j.cell.2019.05.010 · Cited by 637
Self-citationTowards a complete map of the human long non-coding RNA transcriptome
Uszczyńska-Ratajczak, B., Lagarde, J., Frankish, A., Guigó, R., & Johnson, R. (2018) · Nature Reviews Genetics · doi:10.1038/s41576-018-0017-y · Cited by 637
Detecting actively translated open reading frames in ribosome profiling data
Calviello, L., Mukherjee, N., Wyler, E., Zauber, H., Hirsekorn, A., Selbach, M., Landthaler, M., Obermayer, B., & Ohler, U. (2015) · Nature Methods · doi:10.1038/nmeth.3688 · Cited by 430
Self-citation
Metadata
- Authors
- Mackowiak, S. D., Zauber, H., Bielow, C., Thiel, D., Kutz, K., Calviello, L., Mastrobuoni, G., Rajewsky, N., Kempa, S., Selbach, M., & Obermayer, B.
- Affiliations
- Max Delbrück Center (DE)
- Corresponding author
- Obermayer, Benedikt
- ORCID
- Venue
- Genome Biology
- Published
- 2015-09-14
- Volume
- 16
- Issue
- 1
- Pages
- 179-179
- ISSN
- 1465-6906 (ISSN-L)
- 1474-760X
- PMC
- PMC4568590
- OpenAlex
- W2154350719
- Cited by
- 227
- References
- 104
- Citations by year
- 2026: 8 · 2025: 21 · 2024: 23 · 2023: 29 · 2022: 20 · 2021: 26 · 2020: 21 · 2019: 11 · 2018: 27 · 2017: 25 · 2016: 10 · 2015: 6
- FWCI
- 9.85
- Type
- journal article
- Language
- en
- Open access
- gold
- doi.org
- Licence
- cc-by
- Locations
- Genome biology (publishedVersion, cc-by)
- bioRxiv (Cold Spring Harbor Laboratory) (acceptedVersion)
- PubMed Central (publishedVersion, cc-by)
- PubMed (publishedVersion)
- MDC Repository (Max-Delbrueck-Center for Molecular Medicine) (acceptedVersion)
- MDC Repository (Max-Delbrueck-Center for Molecular Medicine) (submittedVersion)
- Topics
- Life Sciences › Biochemistry, Genetics and Molecular Biology › Molecular Biology › Genomics and Phylogenetic Studies
- Life Sciences › Biochemistry, Genetics and Molecular Biology › Molecular Biology › RNA and protein synthesis mechanisms
- Life Sciences › Biochemistry, Genetics and Molecular Biology › Molecular Biology › RNA Research and Splicing
- Keywords
- small open reading frames, micropeptides, purifying selection, untranslated regions, non-coding transcripts, protein disorder, ribosome profiling, translation (biology), evolutionary conservation, model organisms
- MeSH terms
- Amino Acid Sequence, Animals, Exons, Humans, Peptides, Protein Biosynthesis, Open Reading Frames, Sequence Alignment, Conserved Sequence, Codon, Terminator, 3' Untranslated Regions, Amino Acid Motifs, Mice
About these checks
Registry, retraction, Cites and statistics results are computed, not judged, with one exception: a printed reference that no index lists is read once by a model before it counts as a citation error. Claims are extracted by a model and kept only when their quote appears verbatim in the text; each cited source is then checked, with a model’s help, for whether it says what the claim relies on. Those verdicts can be wrong — read the claim’s quote and the cited source before relying on one.
Statistics and arithmetic are recomputed, not judged.
Confidence bands are shown only for fields calibrated on our annotated test set. None is calibrated yet, so no band is shown.
What counts as a claim ›How we measure confidence ›How we check this ›
Are you an author, or do you see a problem with this page? Request a review
