

The DOI matches its Crossref record; 54 of the 54 references it cites were found in a registry or an index; 17 of the 20 sources its claims cite were checked for support.
Removing reference bias and improving indel calling in ancient DNA data analysis by mapping to a sequence variation graph
Open accessPublished version of a preprint
Abstract
Abstract Background During the last decade, the analysis of ancient DNA (aDNA) sequence has become a powerful tool for the study of past human populations. However, the degraded nature of aDNA means that aDNA molecules are short and frequently mutated by post-mortem chemical modifications. These features decrease read mapping accuracy and increase reference bias, in which reads containing non-reference alleles are less likely to be mapped than those containing reference alleles. Alternative approaches have been developed to replace the linear reference with a variation graph which includes known alternative variants at each genetic locus. Here, we evaluate the use of variation graph software to avoid reference bias for aDNA and compare with existing methods. Results We use to align simulated and real aDNA samples to a variation graph containing 1000 Genome Project variants and compare with the same data aligned with to the human linear reference genome. Using leads to a balanced allelic representation at polymorphic sites, effectively removing reference bias, and more sensitive variant detection in comparison with , especially for insertions and deletions (indels). Alternative approaches that use relaxed parameter settings or filter alignments can also reduce bias but can have lower sensitivity than , particularly for indels. Conclusions Our findings demonstrate that aligning aDNA sequences to variation graphs effectively mitigates the impact of reference bias when analyzing aDNA, while retaining mapping sensitivity and allowing detection of variation, in particular indel variation, that was previously missed.
Overview
CoChat Summary
TL;DR
The paper shows that mapping ancient DNA reads to a variation graph with `vg` largely removes reference bias and improves indel detection compared with standard `bwa aln` mapping. On both simulated and 34 real ancient human samples, `vg` gives more balanced allele representation and higher sensitivity, though at a cost of longer runtime and greater memory use.
Key findings
- In simulation, `bwa aln -n 0.02` produced an average alternate-allele fraction of 0.48267 (95% CI [0.48095, 0.48438]), while `vg` gave 0.49988 (95% CI [0.49984, 0.49991]), essentially eliminating reference bias.
- On the high-coverage Yamnaya sample, `vg` recovered an alternate-allele read fraction of 0.4925 (95% CI [0.4914, 0.4937]) versus 0.4742 for `bwa aln -n 0.02` and 0.4773 for `bwa aln -n 0.01 -o 2`.
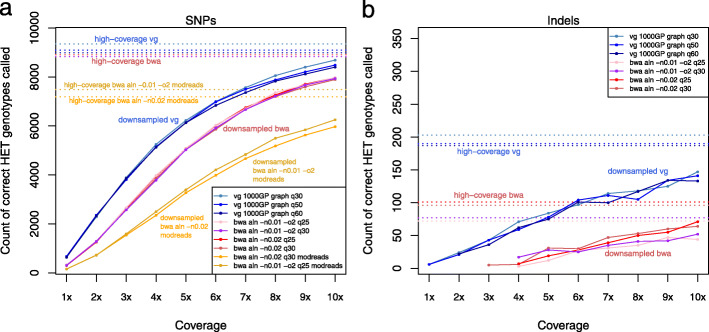
- At 4× coverage, `vg` recovered about 13% more heterozygotes than `bwa aln` in the downsampling experiment; for indels, `vg` recovered approximately twice as many as `bwa aln` at high coverage and even more at lower coverage.
- `bwa aln` failed to detect indels longer than 7 bp, whereas `vg` recovered indels up to at least 18 bp in the PCA/indel analysis; the CCR5 delta 32 deletion was detected in the 4900-year-old Yamnaya sample and three more recent ancient British samples.
Methods
- Compared `vg` mapping to a 1000 Genomes Project variation graph against `bwa aln` mapping to the GRCh37/hs37d5 linear reference using both simulated reads and 34 previously published ancient human samples spanning multiple archaeological contexts and sequencing strategies.
- Simulations generated 50-bp reads across chromosome 11 Human Origins SNP sites, added alternate alleles to half the reads, and introduced post-mortem deamination based on damage profiles from 102 ancient genomes; additional microbial-read simulations tested false alignments.
- Main analyses included allele-balance and mapping-accuracy comparisons, D-statistics, PCA, variant calling with bcftools/FreeBayes, and downsampling of the high-coverage Yamnaya individual to test recovery at lower coverage.
Limitations
- The paper states that `vg` alignment takes about 5× longer than bwa aln -n 0.01 -o 2 and 29× longer than bwa mem, and requires substantially more memory for indexing and mapping.
- It notes that mapping quality scores are not directly comparable between `vg` and `bwa aln`, so comparisons depend on chosen thresholds.
- It also states that the graph approach relies on a graph built from present-day human variation, so it is not appropriate for archaic populations such as Neanderthals and Denisovans; this is a limitation the paper explicitly discusses.
Model-written summary. Check it against the paper before relying on it.
Integrity signals
Registry
Cites
Statistics
Figures



Verification
Claims the paper makes
13 Valid · 0 Not valid · 1 Not checked · 59 Own results and interpretations
The cited sources support only part of this claim — read each source’s verdict below.
In the paper
“Reads containing the alternate allele are less likely to map than reads containing the reference allele, creating a potentially strong bias against non-reference variation”
§ Removing reference bias and improving indel calling in ancient DNA data analysis by mapping to a sequence variation graph > Background
What the sources say
- Partly supportedcites [9] Prüfer K, Stenzel U, Hofreiter M, Pääbo S, Kelso J, Green RE. Computational challenges in the analysis of ancient DNA. Genome Biol. 2010; 11(5):47. https://doi.org/10.1186/gb-2010-11-5-r47. sourceExperimental — accuracy not yet measured
The Results section (‘Pairwise differences’; page not provided) says highly divergent reads can fail to be identified or aligned, biasing measured differences downward. This supports the general mechanism of bias against differences from a reference, but the paper does not specifically compare mapping rates for reads carrying alternate versus reference alleles. (LLM, conf=0.83)
- Supportedcites [10] Günther T, Nettelblad C. The presence and impact of reference bias on population genomic studies of prehistoric human populations. PLoS Genet. 2019; 15(7):1008302. source
The Introduction says reads carrying an alternative allele have mismatches to the reference and lower mapping scores than reads carrying the reference allele. The Results (Mapping quality filtering) report fewer alternative-allele reads than expected after mapping, supporting the claimed bias. Page numbers are not provided in our copy. (LLM, conf=0.94)
hedgedstates a cause- Asserted: passes — The authors put it forward as true.
- Checkable: passes — It can be checked against evidence.
- Load-bearing: passes — The paper’s conclusions depend on it.
- Based: passes — The paper gives a reason why it holds.
- Partly supported
Every source the paper cites for this claim was checked and supports it.
In the paper
“An alternative way to improve read mapping and avoid reference bias is to map reads to a sequence graph that represents both reference and alternate alleles at known variable sites [18].”
§ Removing reference bias and improving indel calling in ancient DNA data analysis by mapping to a sequence variation graph > Background
What the sources say
- Supportedcites [18] Paten B, Novak AM, Eizenga JM, Garrison E. Genome graphs and the evolution of genome inference. Genome Res. 2017; 27(5):665–76. source
In “Reference allele bias” (page unavailable), the paper says richer references that represent population variation should mitigate bias by permitting more read mappings. “Genome inference with genome graphs” (page unavailable) says a graph contains many of a sample’s specific variants. Together, these support mapping reads to a graph containing alternative alleles as a way to improve mapping and reduce reference bias. (LLM, conf=0.88)
plainstates a cause- Asserted: passes — The authors put it forward as true.
- Checkable: passes — It can be checked against evidence.
- Load-bearing: passes — The paper’s conclusions depend on it.
- Based: passes — The paper gives a reason why it holds.
- Supported
The cited sources support only part of this claim — read each source’s verdict below.
In the paper
“However, despite its superior sensitivity, the Peyrégne et al. strategy comes at a cost of reduced accuracy in the mapping of reads containing the reference allele, as we demonstrate below.”
§ Removing reference bias and improving indel calling in ancient DNA data analysis by mapping to a sequence variation graph > Results > Evaluating reference bias in aDNA using simulation
What the sources say
- Partly supportedcites [15] Peyrégne S, Slon V, Mafessoni F, De Filippo C, Hajdinjak M, Nagel S, Nickel B, Essel E, Le Cabec A, Wehrberger K, et al. Nuclear DNA from two early neandertals reveals 80,000 years of genetic continuity in Europe. Sci Adv. 2019; 5(6):5873. sourceExperimental — accuracy not yet measured
The Results (page unavailable) say that aligning to an alternative Neandertal reference recovered additional sequences, supporting the strategy’s increased sensitivity. The Methods (page unavailable) describe excluding reads that aligned to different positions in the two references, but neither passage reports reduced mapping accuracy for reads carrying the reference allele. The citing sentence says that its authors demonstrate that cost below. (LLM, conf=0.85)
boostedstates a cause- Asserted: passes — The authors put it forward as true.
- Checkable: passes — It can be checked against evidence.
- Load-bearing: passes — The paper’s conclusions depend on it.
- Based: passes — The paper gives a reason why it holds.
- Partly supported
Every source the paper cites for this claim was checked and supports it.
In the paper
“Finally, reads mapped with vg continue to show terminal deamination damage, which is used as a standard diagnostic for the presence of true ancient DNA, as seen in mapDamage [28] plots, although levels are slightly reduced (Additional file 1: Fig. S12).”
§ Removing reference bias and improving indel calling in ancient DNA data analysis by mapping to a sequence variation graph > Results > Aligning ancient samples to the 1000GP variation graph
What the sources say
- Supportedcites [28] Jónsson H, Ginolhac A, Schubert M, Johnson PL, Orlando L. mapdamage2. 0: fast approximate bayesian estimates of ancient dna damage parameters. Bioinformatics. 2013; 29(13):1682–4. source
The citation identifies mapDamage as the tool used for the plots, not as the source of the vg mapping result or the slightly reduced damage levels. The Introduction says mapDamage identifies nucleotide misincorporation patterns driven largely by cytosine deamination and describes these patterns as a way to authenticate ancient DNA; the Abstract likewise says they distinguish ancient sequences from modern contaminants. (LLM, conf=0.90)
plainstates an association- Asserted: passes — The authors put it forward as true.
- Checkable: passes — It can be checked against evidence.
- Load-bearing: unclear — It is unclear whether the paper’s conclusions depend on it.
- Based: passes — The paper gives a reason why it holds.
- Supported
Every source the paper cites for this claim was checked and supports it.
In the paper
“which can have a significant effect on population genetic inference and implications for many aDNA studies [9, 10]”
§ Removing reference bias and improving indel calling in ancient DNA data analysis by mapping to a sequence variation graph > Background
What the sources say
- Supportedcites [9] Prüfer K, Stenzel U, Hofreiter M, Pääbo S, Kelso J, Green RE. Computational challenges in the analysis of ancient DNA. Genome Biol. 2010; 11(5):47. https://doi.org/10.1186/gb-2010-11-5-r47. source
The Results (Divergence triangulation) explain that alignment to a reference genome can selectively miss highly diverged ancient reads, making an extinct species appear more closely related to the genome used for identification. The Discussion says ancient-DNA shotgun projects depend heavily on the availability of a closely related reference genome, supporting the claim's broader implications. (LLM, conf=0.88)
- Supportedcites [10] Günther T, Nettelblad C. The presence and impact of reference bias on population genomic studies of prehistoric human populations. PLoS Genet. 2019; 15(7):1008302. source
The Discussion reports that reference bias can affect heterozygosity, allele sharing, and ancestry estimates, although its effects vary by analysis. The Conclusion says it is pervasive in ancient DNA data and can create spurious population-genomic results, supporting the claim's implications for many aDNA studies. (LLM, conf=0.93)
plainstates a possible cause- Asserted: passes — The authors put it forward as true.
- Checkable: passes — It can be checked against evidence.
- Load-bearing: passes — The paper’s conclusions depend on it.
- Based: passes — The paper gives a reason why it holds.
- Supported
35 more claims · 3 with their cited sources checked
Create a free account to see all 73 claims and every source verdict.
- Probably not a substantial claim. 4
- It may state two separate claims as one. 29
- The quote only partly states this claim. 1
Claims other papers make about this one
Each is checked against this paper’s own text: does it say what the citing paper says it does?
The cited source doesn’t support the claim as written.
In the citing paper
“For example, Martiniano et al. [9] find that the more relaxed parameters -n 0.02 -l 1024 -o 2 work best for BWA aln [10]”
From <tt>SAFARI</tt> : pangenome alignment of ancient DNA using purine/pyrimidine encodings (2025) · cites this paper as [9]
Checked by a reasoning model — may be wrong.
Experimental — accuracy not yet measuredThe source backs part of the claim, not all of it — or backs it for a different population, condition or comparison.
In the citing paper
“Crucially, the incorporation of more variation helps mitigate reference bias, and this mitigation has been shown to improve the alignment of both modern and aDNA reads [9, 16].”
From <tt>SAFARI</tt> : pangenome alignment of ancient DNA using purine/pyrimidine encodings (2025) · cites this paper as [9]
Experimental — accuracy not yet measuredThe cited source says what the claim attributes to it.
In the citing paper
“Pangenome graphs (also known as genome graphs or variation graphs) are relatively new data structures which have been shown to help to improve the alignment of aDNA [9].”
From <tt>SAFARI</tt> : pangenome alignment of ancient DNA using purine/pyrimidine encodings (2025) · cites this paper as [9]
Citations
Cites
R: A Language and Environment for Statistical Computing
R Core Team (2025) · doi:10.32614/r.manuals · Cited by 352,181
The Sequence Alignment/Map format and SAMtools
Li, H., Handsaker, B., Wysoker, A., Fennell, T., Ruan, J., Homer, N., Marth, G., Abecasis, G., Durbin, R., & 1000 Genome Project Data Processing Subgroup (2009) · Bioinformatics · doi:10.1093/bioinformatics/btp352 · Cited by 62,041 · cited 1×
“In order to estimate D-statistics and Principal Component Analyses, we generated pileups for each individual [48] at 1233553 SNPs from the Human Origins dataset using samtools mpileup, disabling base quality score recalibration and imposing a minimum base quality filter of q20.”
MethodSelf-citationCutadapt removes adapter sequences from high-throughput sequencing reads
Martin, M. (2011) · EMBnet.journal · doi:10.14806/ej.17.1.200 · Cited by 33,889
A global reference for human genetic variation
The 1000 Genomes Project Consortium, authors, C., Auton, A., Abecasis, G. R., Steering committee, Altshuler, D. M., Durbin, R. M., Abecasis, G. R., Bentley, D. R., Chakravarti, A., et al. (2015) · Nature · doi:10.1038/nature15393 · Cited by 18,247
Self-citationSecond-generation PLINK: rising to the challenge of larger and richer datasets
Chang, C. C., Chow, C. C., Tellier, L. C., Vattikuti, S., Purcell, S. M., & Lee, J. J. (2015) · Gigascience · doi:10.1186/s13742-015-0047-8 · Cited by 12,709
Principal components analysis corrects for stratification in genome-wide association studies
Price, A. L., Patterson, N. J., Plenge, R. M., Weinblatt, M. E., Shadick, N. A., & Reich, D. (2006) · Nature Genetics · doi:10.1038/ng1847 · Cited by 10,248
Population Structure and Eigenanalysis
Patterson, N., Price, A. L., & Reich, D. (2006) · PLoS Genetics · doi:10.1371/journal.pgen.0020190 · Cited by 5,280
A draft sequence of the Neandertal genome
Green, R. E., Krause, J., Briggs, A. W., Maricic, T., Stenzel, U., Kircher, M., Patterson, N., Li, H., Zhai, W., Fritz, M. H.-Y., et al. (2010) · Science · doi:10.1126/science.1188021 · Cited by 4,318
circlize implements and enhances circular visualization in R
Gu, Z., Gu, L., Eils, R., Schlesner, M., & Brors, B. (2014) · Bioinformatics · doi:10.1093/bioinformatics/btu393 · Cited by 4,246
Haplotype-based variant detection from short-read sequencing
Garrison, E., & Marth, G. (2012) · arXiv · doi:10.48550/arxiv.1207.3907 · Cited by 3,700 · cited 3×
“Bioinformatics 31(13), 2202–2204 (2015) [52] Garrison, E.”
MethodInfluentialSelf-citation
Research works printed but not linked: 1
- Li H, Handsaker B, Wysoker A, Fennell T, Ruan J, Homer N, Marth G, Abecasis G, Durbin R. The Sequence Alignment/Map format and SAMtools. Bioinformatics. 2009; 25(16):2078–9. · DOI · Paper page
Cited by
Graph pangenome captures missing heritability and empowers tomato breeding
Zhou, Y., Zhang, Z., Bao, Z., Li, H., Lyu, Y., Zan, Y., Wu, Y., Cheng, L., Fang, Y., Wu, K., et al. (2022) · Nature · doi:10.1038/s41586-022-04808-9 · Cited by 511
The Human Pangenome Project: a global resource to map genomic diversity
Wang, T., Antonacci-Fulton, L., Howe, K., Lawson, H. A., Lucas, J. K., Phillippy, A. M., Popejoy, A. B., Asri, M., Carson, C., Chaisson, M. J. P., et al. (2022) · Nature · doi:10.1038/s41586-022-04601-8 · Cited by 494
Self-citationGenetic load: genomic estimates and applications in non-model animals
Bertorelle, G., Raffini, F., Bosse, M., Bortoluzzi, C., Iannucci, A., Trucchi, E., Morales, H. E., & van Oosterhout, C. (2022) · Nature Reviews Genetics · doi:10.1038/s41576-022-00448-x · Cited by 306
The Allen Ancient DNA Resource (AADR): A curated compendium of ancient human genomesPreprint
Mallick, S., Micco, A., Mah, M., Ringbauer, H., Lazaridis, I., Olalde, Í., Patterson, N. J., & Reich, D. (2023) · bioRxiv (Cold Spring Harbor Laboratory) · doi:10.1101/2023.04.06.535797 · Cited by 153
“There are also differences around computational processing of raw sequencing data, which can produce batch effects across studies [14, 15].”
BackgroundThree assays for in-solution enrichment of ancient human DNA at more than a million SNPs
Rohland, N., Mallick, S., Mah, M., Maier, R., Patterson, N., & Reich, D. (2022) · Genome Research · doi:10.1101/gr.276728.122 · Cited by 163
“This reflects the fact that when sequences perfectly match the reference genome sequence, they will have a higher probability of aligning with high mapping quality and thus of passing the mapping filters used to allow sequences into analysis (Günther and Nettelblad 2019; Martiniano et al. 2020).”
Method
Metadata
- Authors
- Martiniano, R., Garrison, E., Jones, E. R., Manica, A., & Durbin, R.
- Affiliations
- University of Cambridge (GB)
- University of California, Santa Cruz (US)
- Corresponding author
- Durbin, Richard
- Venue
- Genome Biology
- Published
- 2020-09-17
- Volume
- 21
- Issue
- 1
- Pages
- 250-250
- ISSN
- 1465-6906 (ISSN-L)
- 1474-760X
- PMC
- PMC7499850
- OpenAlex
- W3086246013
- Semantic Scholar
- ccf0385d81e1e12c7a62e1ee51f22ca6d24c68c9
- Cited by
- 128
- References
- 54
- Citations by year
- 2026: 10 · 2025: 56 · 2024: 20 · 2023: 15 · 2022: 17 · 2021: 8 · 2020: 2
- FWCI
- 3.40
- Type
- journal article
- Language
- en
- Open access
- gold
- doi.org
- Licence
- cc-by
- creativecommons.org/licenses/by/4.0 (tdm)
- creativecommons.org/licenses/by/4.0 (vor)
- Locations
- Genome biology (publishedVersion, cc-by)
- PubMed Central (publishedVersion, cc-by)
- PubMed (publishedVersion)
- Liverpool John Moores University (acceptedVersion)
- DOAJ (DOAJ: Directory of Open Access Journals) (submittedVersion, cc-by-sa)
- Apollo (University of Cambridge) (submittedVersion, cc-by)
- Apollo (cc-by)
- Apollo
- Funders
- Wellcome Trust (WT207492, 207492/Z/17/Z, WT206194)
- Topics
- Life Sciences › Biochemistry, Genetics and Molecular Biology › Molecular Biology › Genomics and Phylogenetic Studies
- Life Sciences › Biochemistry, Genetics and Molecular Biology › Genetics › Forensic and Genetic Research
- Physical Sciences › Mathematics › Theoretical Computer Science › Algorithms and Data Compression
- Keywords
- ancient DNA, reference bias, variation graphs, indel calling, sequence alignment, VG, BWA, variant calling
- MeSH terms
- DNA, Ancient, Humans, Reference Standards, Genome, Human, Sequence Analysis, DNA, INDEL Mutation
About these checks
Registry, retraction, Cites and statistics results are computed, not judged, with one exception: a printed reference that no index lists is read once by a model before it counts as a citation error. Claims are extracted by a model and kept only when their quote appears verbatim in the text; each cited source is then checked, with a model’s help, for whether it says what the claim relies on. Those verdicts can be wrong — read the claim’s quote and the cited source before relying on one.
The claim verdicts this report counts are experimental: their accuracy is not yet measured.
A language model drew the claims from the paper on 2026-10-11, under version 3 of the claim definition (model deepseek-v4.1-flash, prompt extract-v3).
A second model labelled each claim on 2026-10-11 (model jev-1.13-20260917, definition revision gold-guideline-v0.2).
Cited sources are checked with a language model’s help (gpt-6-sol).
Statistics and arithmetic are recomputed, not judged.
Confidence bands are shown only for fields calibrated on our annotated test set. None is calibrated yet, so no band is shown.
What counts as a claim ›How we measure confidence ›How we check this ›
Are you an author, or do you see a problem with this page? Request a review
How to cite
Cite CoChat for the checks on this page, and the paper for its own findings.
- This page
- CoChat. (2026). Citation check: Removing reference bias and improving indel calling in ancient DNA data analysis by mapping to a sequence variation graph. https://app.cochat.ai/papers/10.1186/s13059-020-02160-7
- The paper
- Martiniano, R., Garrison, E., Jones, E. R., Manica, A., & Durbin, R. (2020). Removing reference bias and improving indel calling in ancient DNA data analysis by mapping to a sequence variation graph. Genome Biology. https://doi.org/10.1186/s13059-020-02160-7
Data sources
Bibliographic data: Semantic Scholar, OpenAlex, Crossref.
Contains information from the Semantic Scholar Academic Graph Datasets, made available under the ODC Attribution License (ODC-BY 1.0).
Semantic Scholar’s data is described in: Kinney, R., et al. (2023). The Semantic Scholar Open Data Platform. arXiv:2301.10140.
