

The DOI matches its Crossref record; 5 of the 5 references it cites were found in a registry or an index.
Universal chromatin state annotation of the mouse genome
Published version of a preprint
Abstract
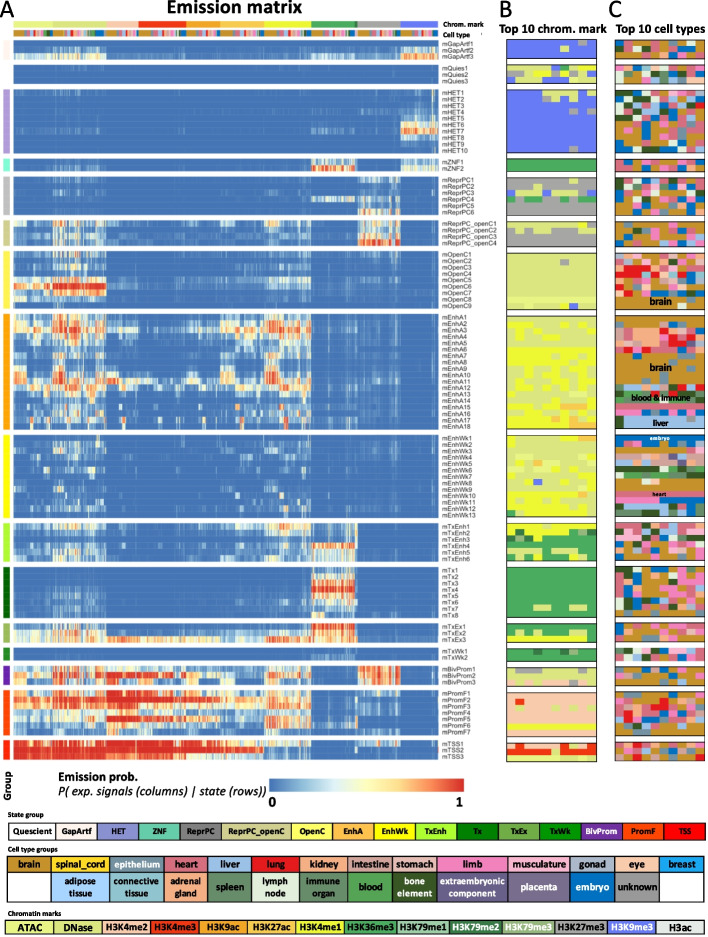
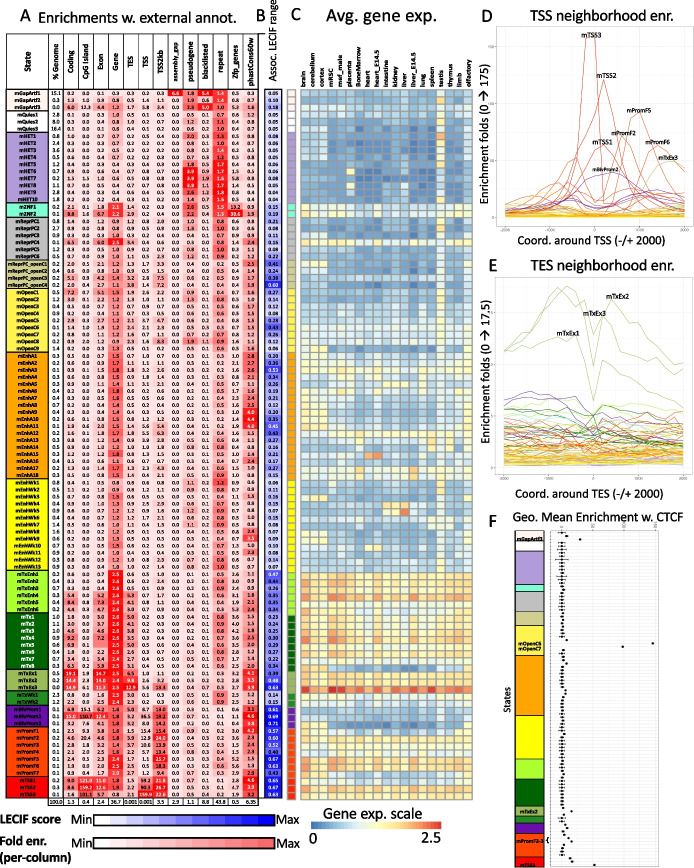
A large-scale application of the “stacked modeling” approach for chromatin state discovery previously provides a single “universal” chromatin state annotation of the human genome based jointly on data from many cell and tissue types. Here, we produce an analogous chromatin state annotation for mouse based on 901 datasets assaying 14 chromatin marks in 26 cell or tissue types. To characterize each chromatin state, we relate the states to external annotations and compare them to analogously defined human states. We expect the universal chromatin state annotation for mouse to be a useful resource for studying this key model organism’s genome.
Overview
The claims and statistics of this paper haven’t been checked yet.
Run the check — free, no account needed. It reads the open-access text and checks the sources it cites.
Integrity signals
Registry
Cites
Statistics
Figures
Verification
Claims the paper makes
The claims and statistics of this paper haven’t been checked yet.
Run the check — free, no account needed. It reads the open-access text and checks the sources it cites.
Claims other papers make about this one
Each is checked against this paper’s own text: does it say what the citing paper says it does?
In the citing paper
“In the main LARRY experiment in Figs. 1 and 2, this resulted in the identification of 110 CpGs, which we annotated for enhancer–heterochromatic regions57 and early–late-replicating domains66.”
From Clonal tracing with somatic epimutations reveals dynamics of blood ageing (2025) · cites this paper as [57]
Self-check
Percentages, sums and reported differences re-computed from the paper’s own numbers.
The self-check needs the paper’s full text.
Citations
Cites
Evolutionarily conserved elements in vertebrate, insect, worm, and yeast genomes
Siepel, A., Bejerano, G., Pedersen, J. S., Hinrichs, A. S., Hou, M., Rosenbloom, K., Clawson, H., Spieth, J., Hillier, L. W., Richards, S., et al. (2005) · Genome Research · doi:10.1101/gr.3715005 · Cited by 3,971 · cited 1×
“In addition, we looked at each state’s enrichment for sequence constraint elements as defined by PhastCons [26].”
BackgroundPerineuronal nets stabilize the grid cell network
Christensen, A. C., Lensjø, K. K., Lepperød, M. E., Dragly, S.-A., Sutterud, H., Blackstad, J. S., Fyhn, M., & Hafting, T. (2021) · Nature Communications · doi:10.1038/s41467-020-20241-w · Cited by 1,865
A comparative encyclopedia of DNA elements in the mouse genome
Yue, F., Cheng, Y., Breschi, A., Vierstra, J., Wu, W., Ryba, T., Sandstrom, R., Ma, Z., Davis, C., Pope, B. D., et al. (2014) · Nature · doi:10.1038/nature13992 · Cited by 1,781
A map of the cis-regulatory sequences in the mouse genome
Shen, Y., Yue, F., McCleary, D. F., Ye, Z., Edsall, L., Kuan, S., Wagner, U., Dixon, J., Lee, L., Lobanenkov, V. V., et al. (2012) · Nature · doi:10.1038/nature11243 · Cited by 1,361 · cited 1×
“[29] (http:// chrom osome. sdsc. edu/ mouse/ downl oad/ 19-tissu es-expr. zip).”
Joint profiling of histone modifications and transcriptome in single cells from mouse brain
Zhu, C., Zhang, Y., Li, Y. E., Lucero, J., Behrens, M. M., & Ren, B. (2021) · Nature Methods · doi:10.1038/s41592-021-01060-3 · Cited by 301
Research works printed but not linked: 33
- Vanhooren V, Libert C. The mouse as a model organism in aging research: usefulness, pitfalls and possibilities. Ageing Res Rev. 2013;12:8–21. · DOI
- Aitman TJ, Boone C, Churchill GA, Hengartner MO, Mackay TFC, Stemple DL. The future of model organisms in human disease research. Nat Rev Genet. 2011;12:575–82. · DOI
- Perlman RL. Mouse models of human disease: an evolutionary perspective. Evol Med Public Health. 2016;2016:170–6.
- Kazachenka A, Bertozzi TM, Sjoberg-Herrera MK, Walker N, Gardner J, Gunning R, et al. Identification, characterization, and heritability of murine metastable epialleles: implications for non-genetic inheritance. Cell. 2018;175:1259-1271.e13. · DOI · Paper page
- Stamatoyannopoulos JA, Snyder M, Hardison R, Ren B, Gingeras T, Gilbert DM, et al. An encyclopedia of mouse DNA elements (Mouse ENCODE). Genome Biol. 2012;13:1–5. · DOI
- Hon GC, Rajagopal N, Shen Y, McCleary DF, Yue F, Dang MD, et al. Epigenetic memory at embryonic enhancers identified in DNA methylation maps from adult mouse tissues. Nat Genet. 2013;45:1198–206. · DOI
- Tsai H-W, Grant PA, Rissman EF. Sex differences in histone modifications in the neonatal mouse brain. Epigenetics. 2009;4:47–53. · DOI
- Rugg-Gunn PJ, Cox BJ, Ralston A, Rossant J. Distinct histone modifications in stem cell lines and tissue lineages from the early mouse embryo. Proc Natl Acad Sci U S A. 2010;107:10783–90. · DOI
- Ernst J, Kellis M. Discovery and characterization of chromatin states for systematic annotation of the human genome. Nat Biotechnol. 2010;28:817–25. · DOI
- Ernst J, Kellis M. ChromHMM: automating chromatin-state discovery and characterization. Nat Methods. 2012;9:215–6. · DOI
- Hoffman MM, Buske OJ, Wang J, Weng Z, Bilmes JA, Noble WS. Unsupervised pattern discovery in human chromatin structure through genomic segmentation. Nat Methods. 2012;9:473. · DOI
- Libbrecht MW, Chan RC, Hoffman MM. Segmentation and genome annotation algorithms for identifying chromatin state and other genomic patterns. PLoS Comput Biol. 2021;17:e1009423. · DOI
- ENCODE Project Consortium. An integrated encyclopedia of DNA elements in the human genome. Nature. 2012;489:57–74. · DOI · Paper page
- van der Velde A, Fan K, Tsuji J, Moore JE, Purcaro MJ, Pratt HE, et al. Annotation of chromatin states in 66 complete mouse epigenomes during development. Commun Biol. 2021;4:1–15. · DOI
- Bogu GK, Vizán P, Stanton LW, Beato M, Di Croce L, Marti-Renom MA. Chromatin and RNA maps reveal regulatory long noncoding RNAs in mouse. Mol Cell Biol. 2015;36:809–19. · DOI
- Sugathan A, Waxman DJ. Genome-wide analysis of chromatin states reveals distinct mechanisms of sex-dependent gene regulation in male and female mouse liver. Mol Cell Biol. 2013;33:3594–610. · DOI
- Gorkin DU, Barozzi I, Zhao Y, Zhang Y, Huang H, Lee AY, et al. An atlas of dynamic chromatin landscapes in mouse fetal development. Nature. 2020;583:744–51. · DOI
- Ernst J, Kellis M. Chromatin-state discovery and genome annotation with ChromHMM. Nat Protoc. 2017;12:2478. · DOI
- Vu H, Ernst J. Universal annotation of the human genome through integration of over a thousand epigenomic datasets. Genome Biol. 2022;23:1–37. · DOI
- Kwon SB, Ernst J. Learning a genome-wide score of human–mouse conservation at the functional genomics level. Nat Commun. 2021;12:1–14. · DOI
- Wutz A. Gene silencing in X-chromosome inactivation: advances in understanding facultative heterochromatin formation. Nat Rev Genet. 2011;12:542–53. · DOI
- Yen A, Kellis M. Systematic chromatin state comparison of epigenomes associated with diverse properties including sex and tissue type. Nat Commun. 2015;6:1–13. · DOI · Paper page
- Smit AFA, Hubley R, Green P. RepeatMasker Open-4.0. 2013–2015. 2015.
- Ostuni R, Piccolo V, Barozzi I, Polletti S, Termanini A, Bonifacio S, et al. Latent enhancers activated by stimulation in differentiated cells. Cell. 2013;152:157–71. · DOI · Paper page
- The ENCODE Project Consortium, Moore JE, Purcaro MJ, Pratt HE, Epstein CB, Shoresh N, et al. Expanded encyclopaedias of DNA elements in the human and mouse genomes. Nature. 2020;583(699):710.
- Rosenbloom KR, Armstrong J, Barber GP, Casper J, Clawson H, Diekhans M, et al. The UCSC Genome Browser database: 2015 update. Nucleic Acids Res. 2015;43:D670–81. · DOI
- Kent WJ, Sugnet CW, Furey TS, Roskin KM, Pringle TH, Zahler AM, et al. The human genome browser at UCSC. Genome Res. 2002;12:996–1006. · DOI · Paper page
- Frankish A, Diekhans M, Ferreira A-M, Johnson R, Jungreis I, Loveland J, et al. GENCODE reference annotation for the human and mouse genomes. Nucleic Acids Res. 2019;47:D766–73. · DOI
- Amemiya HM, Kundaje A, Boyle AP. The ENCODE blacklist: identification of problematic regions of the genome. Sci Rep. 2019;9:1–5. · DOI · Paper page
- Davis CA, Hitz BC, Sloan CA, Chan ET, Davidson JM, Gabdank I, et al. The Encyclopedia of DNA elements (ENCODE): data portal update. Nucleic Acids Res. 2018;46:D794-801. · DOI · Paper page
- Hitz BC, Lee J-W, Jolanki O, Kagda MS, Graham K, Sud P, et al. The ENCODE Uniform Analysis Pipelines. bioRxiv. 2023:2023.04.04.535623. Available from: https://www.biorxiv.org/content/10.1101/2023.04.04.535623v1 [cited 12 Jun 2023]. · DOI
- Kagda MS, Lam B, Litton C, Small C, Sloan CA, Spragins E, et al. Data navigation on the ENCODE portal. arXiv; 2023. Available from: http://arxiv.org/abs/2305.00006 [cited 12 Jun 2023]. · arXiv
- Vu H, Ernst J. Universal chromatin state annotation of the mouse genome. 2023. Available from: https://github.com/ernstlab/mouse_fullStack_annotations. · DOI
Cited by
Clonal tracing with somatic epimutations reveals dynamics of blood ageing
Scherer, M., Singh, I., Braun, M. M., Szu-Tu, C., Sanchez Sanchez, P., Lindenhofer, D., Jakobsen, N. A., Körber, V., Kardorff, M., Nitsch, L., et al. (2025) · Nature · doi:10.1038/s41586-025-09041-8 · Cited by 89
Metadata
- Authors
- Vu, H., & Ernst, J.
- Venue
- Genome Biology
- Published
- 2023-06-27
- Volume
- 24
- Issue
- 1
- ISSN
- 1474-760X
- PMC
- PMC10294404
- Cited by
- 37
- References
- 5
- Language
- en
- Funders
- National Institute of Health (DP1DA044371, UH3NS104095, U01HG012079)
- National Science Foundation (2125664, 1254200)
- UCLA Jonsson Comprehensive Cancer Center and Eli and Edythe Broad Center of Regenerative Medicine and Stem Cell Research, University of California Los Angeles (Ablon Scholars Program)
- National Institutes of Health (U01MH130995, U01MH105578)
- Rose Hills Foundation (Rose Hills Innovator Award)
About these checks
Registry, retraction, Cites and statistics results are computed, not judged, with one exception: a printed reference that no index lists is read once by a model before it counts as a citation error. Claims are extracted by a model and kept only when their quote appears verbatim in the text; each cited source is then checked, with a model’s help, for whether it says what the claim relies on. Those verdicts can be wrong — read the claim’s quote and the cited source before relying on one.
Statistics and arithmetic are recomputed, not judged.
Confidence bands are shown only for fields calibrated on our annotated test set. None is calibrated yet, so no band is shown.
What counts as a claim ›How we measure confidence ›How we check this ›
Are you an author, or do you see a problem with this page? Request a review
How to cite
Cite CoChat for the checks on this page, and the paper for its own findings.
- This page
- CoChat. (2026). Citation check: Universal chromatin state annotation of the mouse genome. https://app.cochat.ai/papers/10.1186/s13059-023-02994-x
- The paper
- Vu, H., & Ernst, J. (2023). Universal chromatin state annotation of the mouse genome. Genome Biology. https://doi.org/10.1186/s13059-023-02994-x
