

The DOI matches its Crossref record; 35 of the 35 references it cites were found in a registry or an index.
Production of medium-chain fatty acids and higher alcohols by a synthetic co-culture grown on carbon monoxide or syngas
Open accessAbstract
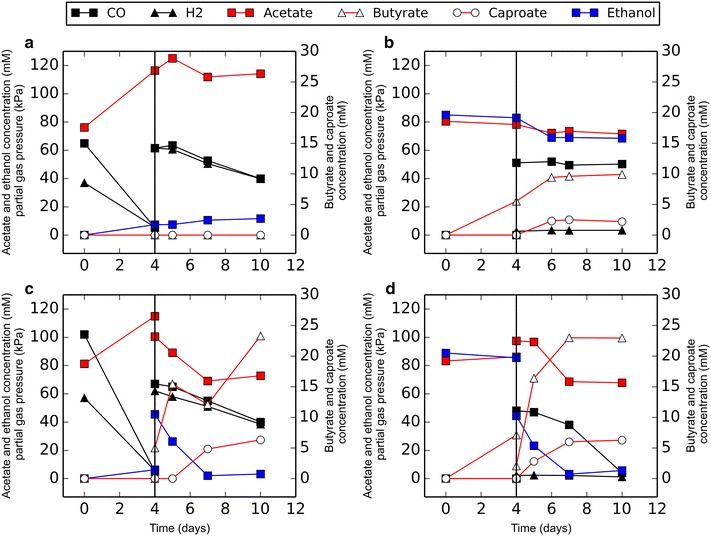
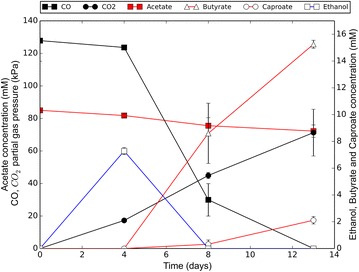
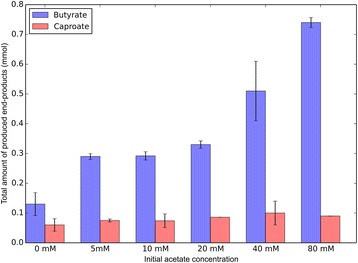
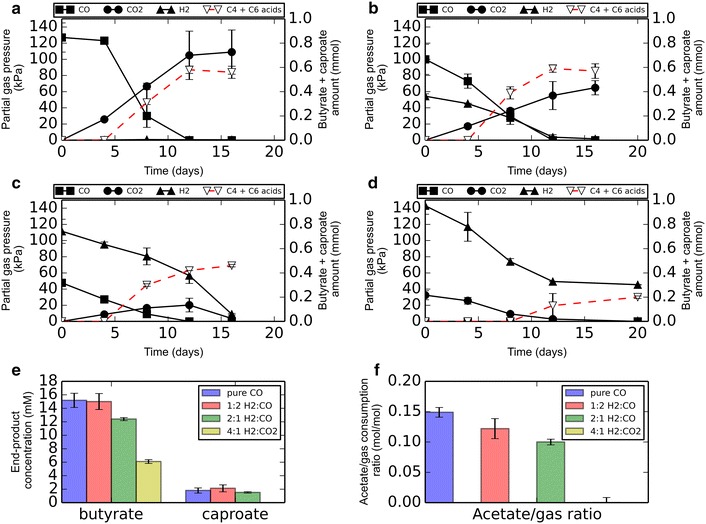
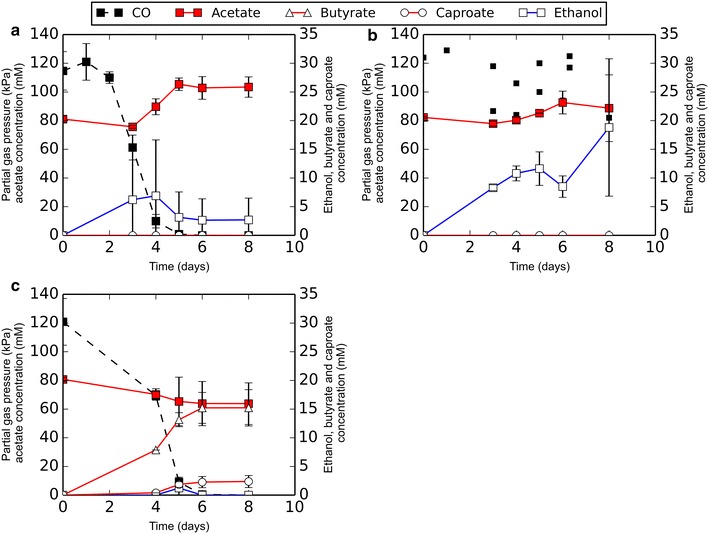
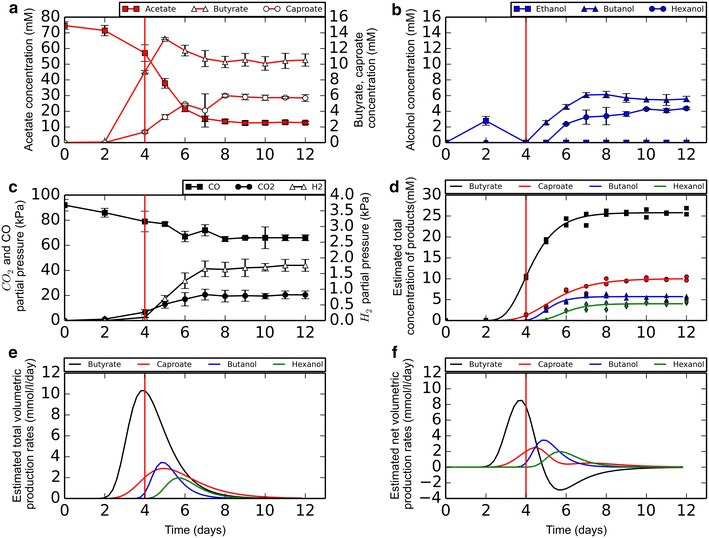
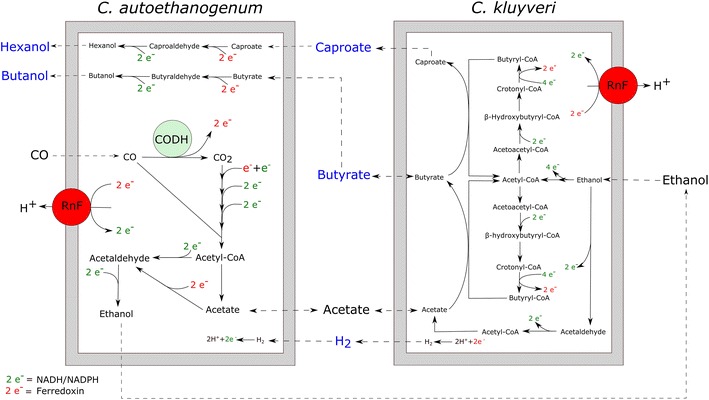
BACKGROUND: Synthesis gas, a mixture of CO, H2, and CO2, is a promising renewable feedstock for bio-based production of organic chemicals. Production of medium-chain fatty acids can be performed via chain elongation, utilizing acetate and ethanol as main substrates. Acetate and ethanol are main products of syngas fermentation by acetogens. Therefore, syngas can be indirectly used as a substrate for the chain elongation process. RESULTS: Here, we report the establishment of a synthetic co-culture consisting of Clostridium autoethanogenum and Clostridium kluyveri. Together, these bacteria are capable of converting CO and syngas to a mixture of C4 and C6 fatty acids and their respective alcohols. The co-culture is able to grow using solely CO or syngas as a substrate, and presence of acetate significantly stimulated production rates. The co-culture produced butyrate and caproate at a rate of 8.5 ± 1.1 and 2.5 ± 0.63 mmol/l/day, respectively. Butanol and hexanol were produced at a rate of 3.5 ± 0.69 and 2.0 ± 0.46 mmol/l/day, respectively. The pH was found to be a major factor during cultivation, influencing the growth performance of the separate strains and caproate toxicity. CONCLUSION: This co-culture poses an alternative way to produce medium-chain fatty acids and higher alcohols from carbon monoxide or syngas and the process can be regarded as an integration of syngas fermentation and chain elongation in one growth vessel.
Overview
The claims and statistics of this paper haven’t been checked yet.
Run the check — free, no account needed. It reads the open-access text and checks the sources it cites.
Integrity signals
Registry
Cites
Statistics
Figures
Verification
Claims the paper makes
The claims and statistics of this paper haven’t been checked yet.
Run the check — free, no account needed. It reads the open-access text and checks the sources it cites.
Claims other papers make about this one
Each is checked against this paper’s own text: does it say what the citing paper says it does?
In the citing paper
“Diender et al. recently demonstrated production of butyrate, caproate, butanol and hexanol by co-culture of C. kluyveri and C. autoethanogenum fed with CO and H2 (Diender et al., 2016).”
From Gas Fermentation—A Flexible Platform for Commercial Scale Production of Low-Carbon-Fuels and Chemicals from Waste and Renewable Feedstocks (2016) · cites this paper as Diender et al., 2016
Self-check
Percentages, sums and reported differences re-computed from the paper’s own numbers.
The self-check needs the paper’s full text.
Citations
Cites
Modeling of the Bacterial Growth Curve
Zwietering, M. H., Jongenburger, I., ROMBOUTS, F. M., & Riet, K. V. (1990) · Applied and Environmental Microbiology · doi:10.1128/aem.56.6.1875-1881.1990 · Cited by 4,266
Designer synthetic media for studying microbial-catalyzed biofuel production
Tang, X., Sousa, L. D. C., Jin, M., Chundawat, S. P. S., Chambliss, C. K., Lau, M. W., Xiao, Z., Dale, B. E., & Balan, V. (2015) · Biotechnology for Biofuels · doi:10.1186/s13068-014-0179-6 · Cited by 889
Waste to bioproduct conversion with undefined mixed cultures: the carboxylate platform
Agler, M. T., Wrenn, B. A., Zinder, S. H., & Angenent, L. T. (2010) · Trends in biotechnology · doi:10.1016/j.tibtech.2010.11.006 · Cited by 821
Clostridium ljungdahlii represents a microbial production platform based on syngas
Köpke, M., Held, C., Hujer, S., Liesegang, H., Wiezer, A., Wollherr, A., Ehrenreich, A., Liebl, W., Gottschalk, G., & Dürre, P. (2010) · Proceedings of the National Academy of Sciences · doi:10.1073/pnas.1004716107 · Cited by 660
Steinbusch, K. J. J., Hamelers, H. V. M., Plugge, C. M., & Buisman, C. J. N. (2011) · Energy Environ. Sci. · doi:10.1039/c0ee00282h · Cited by 453
Abrini, J., Naveau, H. P., & Nyns, E. J. (1994) · Archives of Microbiology · doi:10.1007/bf00303591 · Cited by 314
Phillips, J. R., Atiyeh, H. K., Tanner, R. S., Torres, J. R., Saxena, J., Wilkins, M. R., & Huhnke, R. L. (2015) · Bioresource Technology · doi:10.1016/j.biortech.2015.04.043 · Cited by 276
Bioenergetic constraints for conversion of syngas to biofuels in acetogenic bacteria
Bertsch, J., & Müller, V. (2015) · Biotechnology for Biofuels · doi:10.1186/s13068-015-0393-x · Cited by 258
C1-carbon sources for chemical and fuel production by microbial gas fermentation
Dürre, P., & Eikmanns, B. J. (2015) · Current Opinion in Biotechnology · doi:10.1016/j.copbio.2015.03.008 · Cited by 250
Pathways and Bioenergetics of Anaerobic Carbon Monoxide Fermentation
Diender, M., Stams, A. J. M., & Sousa, D. Z. (2015) · Frontiers in Microbiology · doi:10.3389/fmicb.2015.01275 · Cited by 208
Self-citation
Cited by
Sorted by citations
Items 201–262 of 262
Syngas fermentation platforms: alcohols from syngas and CO2
Kennes-Veiga, D. M., Robles‐Iglesias, R., Veiga, M. C., & Kennes, C. (2023) · Elsevier eBooks · doi:10.1016/b978-0-323-91756-8.00009-8 · Cited by 3
Bioreduction of chromate in a syngas-based membrane biofilm reactor
Niu, C., Zhao, X., Shi, D., Ying, Y., Wu, M., Lai, C.-Y., Guo, J., Hu, S., & Liu, T. (2024) · Journal of Hazardous Materials · doi:10.1016/j.jhazmat.2024.134195 · Cited by 3
Cheng, M., Qu, G., Xu, R., & Ren, N. (2024) · Chemosphere · doi:10.1016/j.chemosphere.2024.143430 · Cited by 3
Rajagopalan, G., & Krishnan, C. (2022) · Elsevier eBooks · doi:10.1016/b978-0-323-90040-9.00008-4 · Cited by 3
Synthesis of Acetyl-CoA from Carbon Dioxide in Acetogenic Bacteria
Müller, V., & Wiechmann, A. (2017) · Springer eBooks · doi:10.1007/978-3-319-43676-0_4-1 · Cited by 4
Li, X., & Henson, M. A. (2021) · Journal of Applied Microbiology · doi:10.1111/jam.15155 · Cited by 3
Diender, M. (2019) · doi:10.18174/466065 · Cited by 4
Self-citationZhang, Y., Liu, B., Wu, W., Liu, H., & Wang, W. (2024) · Journal of Environmental Sciences · doi:10.1016/j.jes.2024.12.033 · Cited by 2
Chouhan, A., & Das, P. K. (2025) · Biofuels · doi:10.1080/17597269.2025.2505259 · Cited by 2
Oehlenschläger, K., Lorenz, M., Schepp, E., Nonno, S. D., Holtmann, D., & Ulber, R. (2025) · Biotechnology for Biofuels and Bioproducts · doi:10.1186/s13068-025-02698-3 · Cited by 2
Metabolic engineering of Escherichia coli for de novo production of lauryl glucoside
Promubon, K., Arjin, C., Pumas, C., Panya, A., Jones, P. R., & Sattayawat, P. (2025) · BioDesign Research · doi:10.1016/j.bidere.2025.100045 · Cited by 2
Wu, Z., Rossi, R., & Zhao, H. (2025) · ACS ES&T Engineering · doi:10.1021/acsestengg.5c00768 · Cited by 2
Suazo, A., Olm, I. P., Otálora, F., Martínez-Ruano, J. A., Conejeros, R., Aroca, G. E., & Sousa, D. Z. (2026) · Chemical Engineering Journal · doi:10.1016/j.cej.2026.172982 · Cited by 3
Self-citationZhang, L., Zheng, J., Ren, C., & Xu, Y. (2026) · Bioresource Technology · doi:10.1016/j.biortech.2026.134469 · Cited by 2
Ghosh, S., Pathak, S., Manna, D., & Chowdhury, R. (2020) · Indian Chemical Engineer · doi:10.1080/00194506.2020.1815597 · Cited by 2
Prospects of R&D in the biofuel sector/industry
Naveed, H., Al-Muhtaseb, A. H., Jamil, F., Al-Maawali, S., & Al-Hajri, R. S. (2022) · Elsevier eBooks · doi:10.1016/b978-0-323-91159-7.00021-7 · Cited by 2
Jia, X., Xu, J., Liu, L., Liang, X., He, Y., Han, L., & Xiao, W. (2024) · Journal of environmental chemical engineering · doi:10.1016/j.jece.2024.114836 · Cited by 2
Manipulation of Biodiversity to Steer and Optimize Microbial Community Function
Augelletti, F., Stenuit, B. A., Agathos, S. N., & Jousset, A. (2019) · Elsevier eBooks · doi:10.1016/b978-0-444-64046-8.00478-x · Cited by 3
Synthesis of Acetyl-CoA from Carbon Dioxide in Acetogenic Bacteria
Wiechmann, A., & Müller, V. (2019) · Springer eBooks · doi:10.1007/978-3-319-50430-8_4 · Cited by 5
Effect of Endogenous and Exogenous Butyric Acid on Butanol Production From CO by Enriched Clostridia
He, Y., Lens, P. N. L., Veiga, M. C., & Kennes, C. (2022) · Frontiers in Bioengineering and Biotechnology · doi:10.3389/fbioe.2022.828316 · Cited by 2
Control strategies for ethanol-based chain elongation processes
Roghair, M. (2018) · doi:10.18174/460693 · Cited by 2
Devi, N. B., & Pakshirajan, K. (2026) · Industrial & Engineering Chemistry Research · doi:10.1021/acs.iecr.5c05036 · Cited by 1
Genetic modification of Clostridium kluyveri for heterologous n -butanol and n -hexanol production
Schlaiß, C., Baur, S. T., Marsh, J. W., Gemeinhardt, K., & Angenent, L. T. (2026) · Applied and Environmental Microbiology · doi:10.1128/aem.00058-26 · Cited by 1
Wu, K.-K., Wu, S., Chen, C., Wang, Z.-H., Wang, Y.-R., Zhao, L., Tong, J., Shen, F., Xing, D.-F., Ren, N.-Q., et al. (2026) · Water Research · doi:10.1016/j.watres.2026.125890 · Cited by 1
The potential of syngas as a central mediator for a carbon-agnostic circular economy
Krüsemann, J. L., Köpke, M., Blombach, B., Leger, D., & Lindner, S. N. (2026) · Nature Communications · doi:10.1038/s41467-026-76965-8 · Cited by 1
Microbial CO2 Conversion Routes
Magiri-Skouloudi, D., Topakas, E., & Karellas, S. (2022) · Royal Society of Chemistry eBooks · doi:10.1039/9781839167645-00494 · Cited by 1
Unassisted stimulation of autotrophic ethanol bioproduction by visible light
Rao, W., Yu, K., Zheng, H., Ye, M., Liu, Z., Zhang, T., & Tremblay, P. (2023) · Sustainable Energy & Fuels · doi:10.1039/d3se00048f · Cited by 1
Bioconversion of CO2 into Valuables
Sharma, N., Das, S., & Pant, D. (2024) · Green chemistry and sustainable technology · doi:10.1007/978-981-99-8822-8_8 · Cited by 1
Microbial chain elongation based on methanol
Chen, W. (2017) · doi:10.18174/413896 · Cited by 1
Open culture chain elongation for branched carboxylate formation
de Leeuw, K. D. (2020) · doi:10.18174/530424 · Cited by 1
Nano zero-valent iron assisted microbial electrosynthesis for medium-chain fatty acids productionPreprint
Wu, P., Zhang, J., Li, J., Zhang, Y., Fu, B., Xu, M., Zhang, Y., & Liu, H. (2022) · Research Square · doi:10.21203/rs.3.rs-1390931/v1 · Cited by 1
Baleeiro, F. C. F., Varchmin, L., Kleinsteuber, S., Sträuber, H., & Neumann, A. (2022) · bioRxiv (Cold Spring Harbor Laboratory) · doi:10.1101/2022.06.30.498223 · Cited by 1
Production of medium-chain, a, omega-bifunctional monomers from fatty acids and n-alkanes
van Nuland, Y. M. (2017) · doi:10.18174/422088
Metabolism and cell-to-cell interactions of anaerobic syntrophic Clostridia co-cultures
Streett, H. (2025) · Library, Museums and Press - UDSpace (University of Delaware) · doi:10.58088/pe3w-rj36
Whang, K., Chang, J., Jung, K., Ko, H., Lee, J., Choi, I., & Kang, T. (2019) · Analytical Chemistry · doi:10.1021/acs.analchem.9b03439
Model-driven design of synthetic microbial communities for the upcycling of One-Carbon feedstocks
Benito-Vaquerizo, S. (2023) · doi:10.18174/630256
Amazing attributes of acetogensPreprint
Poehlein, A., Zeldes, B. M., Flaiz, M., Böer, T., Lüschen, A., Höfele, F., Baur, K. S., Molitor, B., Kröly, C., Wang, M., et al. (2024) · SSRN Electronic Journal · doi:10.2139/ssrn.4872466
Self-citationValue-added products of biorefinery
Dahunsi, O. S. (2024) · Elsevier eBooks · doi:10.1016/b978-0-443-24129-1.00023-5
Microorganisms of importance in biorefinery
Dahunsi, O. S. (2024) · Elsevier eBooks · doi:10.1016/b978-0-443-24129-1.00021-1
Herzog, J., Gregg, S., Gröninger, L., Kastlunger, F., Poppe, J., Uhlig, V., Wei, Y., & Weuster‐Botz, D. (2025) · Applied Sciences · doi:10.3390/app15179800
Lauer, I., Philipps, G., & Jennewein, S. (2022) · Figshare · doi:10.6084/m9.figshare.19767719
Baleeiro, F. C. F., Varchmin, L., Kleinsteuber, S., Sträuber, H., & Neumann, A. (2024) · Figshare · doi:10.6084/m9.figshare.26569285
Baleeiro, F. C. F., Varchmin, L., Kleinsteuber, S., Sträuber, H., & Neumann, A. (2024) · Figshare · doi:10.6084/m9.figshare.26569288
Olm, I. P., & Sousa, D. Z. (2024) · Figshare · doi:10.6084/m9.figshare.26589948
Self-citationBaleeiro, F. C. F., Varchmin, L., Kleinsteuber, S., Sträuber, H., & Neumann, A. (2024) · Figshare · doi:10.6084/m9.figshare.26569291
Mook, A., Herzog, J., Walther, P., Dürre, P., & Bengelsdorf, F. R. (2024) · Figshare · doi:10.6084/m9.figshare.26754064
Mook, A., Herzog, J., Walther, P., Dürre, P., & Bengelsdorf, F. R. (2024) · Figshare · doi:10.6084/m9.figshare.26754061
Ivanov, N. V., Konkin, P., Kozlov, M. A., & Pentsak, E. O. (2025) · Solid Fuel Chemistry · doi:10.3103/s0361521925600890
Long-chain alcohols production from sewage sludge
Xu, Q., Wu, L., Liu, X., Wei, W., & Ni, B. (2026) · Elsevier eBooks · doi:10.1016/b978-0-443-29127-2.00015-8
Naorem, N., Patharla, C., Sonkar, V., Kashyap, A. K., & Thatikonda, S. (2026) · SSRN Electronic Journal · doi:10.2139/ssrn.6388955
Agena, E., Badani, A. A., Lindner, B. G., Gois, I. M., Dempster, A. W., Minton, N. P., Mahadevan, R., & Lawson, C. E. (2026) · ACS Synthetic Biology · doi:10.1021/acssynbio.5c00788
Maimaitiabula, M., Chao, J., Lü, M., Xi, L., Gao, L., Zhao, Y., Fan, H., & Zhao, K. (2026) · Food Bioscience · doi:10.1016/j.fbio.2026.108861
Bioproduction of short- and medium-chain fatty acids
Grigore‐Gurgu, L., Horincar, G., Oprișanu, M., Cotârleț, M., & Bahrim, G. E. (2026) · Elsevier eBooks · doi:10.1016/b978-0-12-819533-8.00001-4
Emmanuel, O., Okonkwo, C. C., Akinola, S. A., Atiyeh, H. K., & Ezeji, T. C. (2026) · Bioresource Technology Reports · doi:10.1016/j.biteb.2026.102802
Thunuguntla, R., Tanner, R. S., & Atiyeh, H. K. (2026) · Bioresource Technology · doi:10.1016/j.biortech.2026.134887
Jiang, N., Li, L., Li, X., Li, R., Wang, G., Li, T., & Wang, X. L. (2026) · Bioprocess and Biosystems Engineering · doi:10.1007/s00449-026-03381-z
Kim, H.-J., Choi, Y., Han, J., Ko, J. K., Song, H.-S., & Seo, H. (2026) · Green Chemistry · doi:10.1039/d6gc01271j
Naorem, N., Patharla, C., Sonkar, V., Kashyap, A. K., & Thatikonda, S. (2026) · SSRN Electronic Journal · doi:10.2139/ssrn.7207664
Nwanebu, E. O., Pauzé-Foixet, J., Mihin, T., Schreiber, L., Lawson, C. E., Monteil‐Rivera, F., Burton, I., & Tartakovsky, B. (2026) · Bioelectrochemistry · doi:10.1016/j.bioelechem.2026.109456
Liu, J., Liu, Y., Guo, T., Yan, P., Chen, Y.-P., & Gao, M.-J. (2026) · Journal of Environmental Sciences · doi:10.1016/j.jes.2026.105836
Multienzyme cascades for non-grain carbon feedstocks valorization: Recent advances and perspectives
Wang, X., Chen, H., Chun-jiang, M., Zhang, J.-J., Cheng, F., Xue, Y.-P., & Yu-guo, Z. (2026) · Biotechnology Advances · doi:10.1016/j.biotechadv.2026.109082
Metadata
- Authors
- Diender, M., Stams, A. J. M., & Sousa, D. Z.
- Affiliations
- Wageningen University & Research (NL)
- Corresponding author
- Diender, Martijn
- Venue
- Biotechnology for Biofuels
- Published
- 2016-04-02
- Volume
- 9
- Issue
- 1
- Pages
- 82-82
- ISSN
- 1754-6834 (ISSN-L)
- PMC
- PMC4818930
- OpenAlex
- W2316195511
- Cited by
- 259
- References
- 35
- Citations by year
- 2026: 20 · 2025: 28 · 2024: 35 · 2023: 27 · 2022: 32 · 2021: 29 · 2020: 25 · 2019: 22 · 2018: 17 · 2017: 19 · 2016: 5
- FWCI
- 23.02
- Type
- journal article
- Language
- en
- Open access
- gold
- doi.org
- Licence
- cc-by
- Locations
- Biotechnology for Biofuels (publishedVersion, cc-by)
- Europe PMC (PubMed Central) (publishedVersion, cc-by)
- PubMed Central (publishedVersion, cc-by)
- PubMed (publishedVersion)
- Socio-Environmental Systems Modeling (acceptedVersion, cc-by)
- Portuguese National Funding Agency for Science, Research and Technology (RCAAP Project by FCT) (submittedVersion, other-oa)
- Portuguese National Funding Agency for Science, Research and Technology (RCAAP Project by FCT) (submittedVersion, cc-by-nc-nd)
- Data Archiving and Networked Services (DANS) (submittedVersion, cc-by)
- Funders
- Ministerie van Onderwijs, Cultuur en Wetenschap (SIAM 024.002.002)
- European Research Council (323009)
- Topics
- Physical Sciences › Energy › Renewable Energy, Sustainability and the Environment › Anaerobic Digestion and Biogas Production
- Life Sciences › Biochemistry, Genetics and Molecular Biology › Molecular Biology › Microbial Metabolic Engineering and Bioproduction
- Physical Sciences › Engineering › Biomedical Engineering › Biofuel production and bioconversion
- Keywords
- medium-chain fatty acids, higher alcohols, syngas fermentation, carbon monoxide, chain extension, Clostridium autoethanogenum, Clostridium kluyveri, butyrate, caproate, butanol, hexanol, acetate, pH effect, acetogenic bacteria
About these checks
Registry, retraction, Cites and statistics results are computed, not judged, with one exception: a printed reference that no index lists is read once by a model before it counts as a citation error. Claims are extracted by a model and kept only when their quote appears verbatim in the text; each cited source is then checked, with a model’s help, for whether it says what the claim relies on. Those verdicts can be wrong — read the claim’s quote and the cited source before relying on one.
Statistics and arithmetic are recomputed, not judged.
Confidence bands are shown only for fields calibrated on our annotated test set. None is calibrated yet, so no band is shown.
What counts as a claim ›How we measure confidence ›How we check this ›
Are you an author, or do you see a problem with this page? Request a review
