

The DOI matches its Crossref record; 2 of the 2 references it cites were found in a registry or an index.
SANS investigation of fungal loosenins reveals substrate-dependent impacts of protein action on the inter-microfibril arrangement of cellulosic substrates
Open accessPublished version of a preprint
Abstract
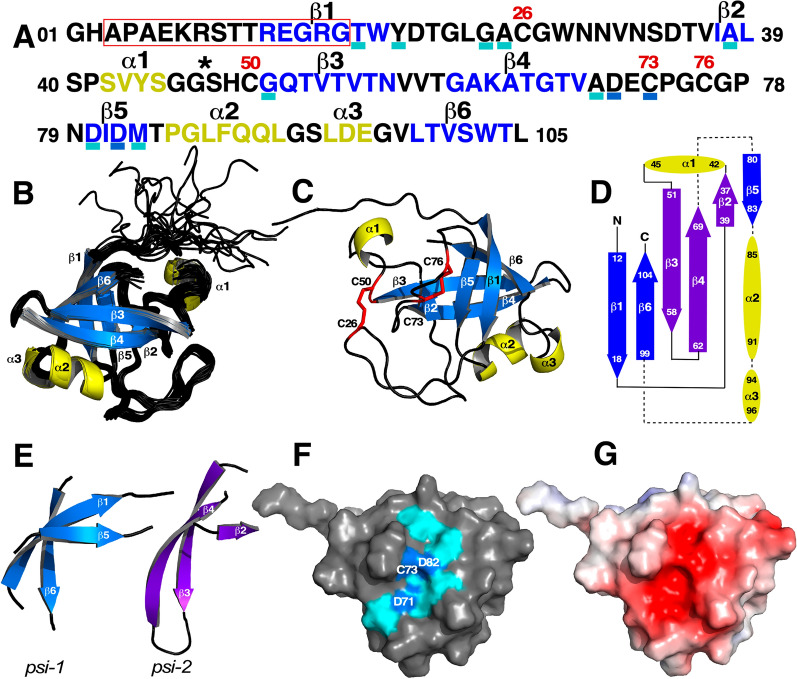
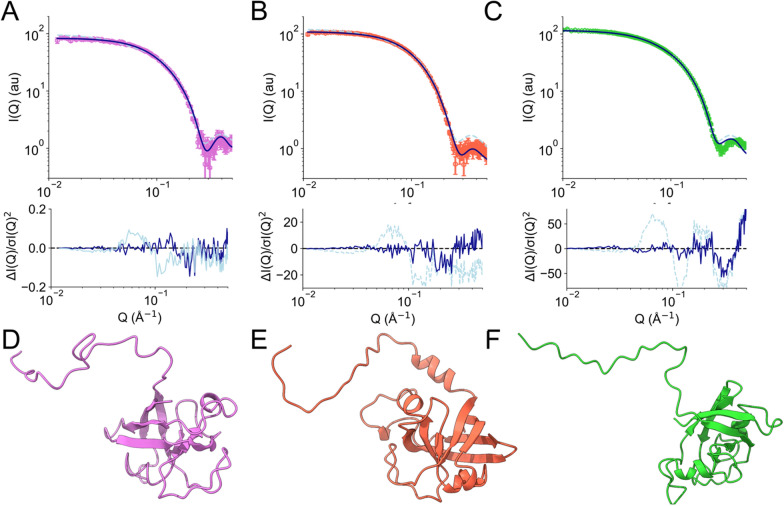
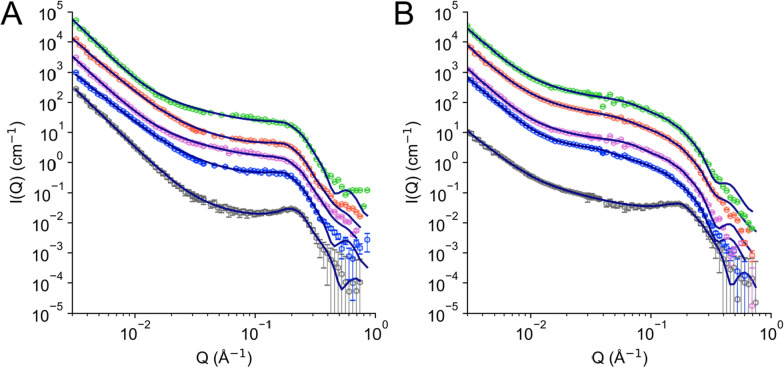
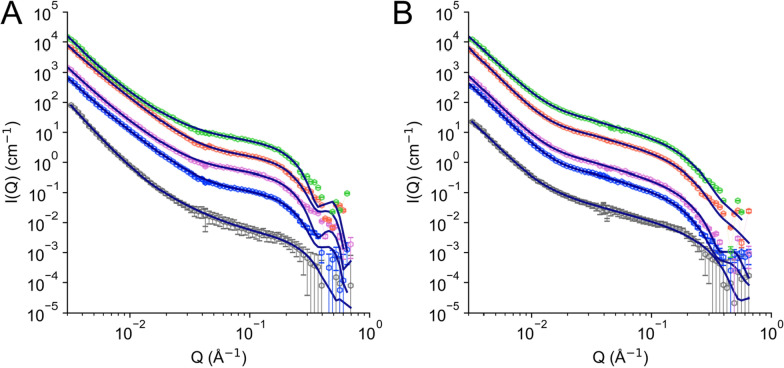
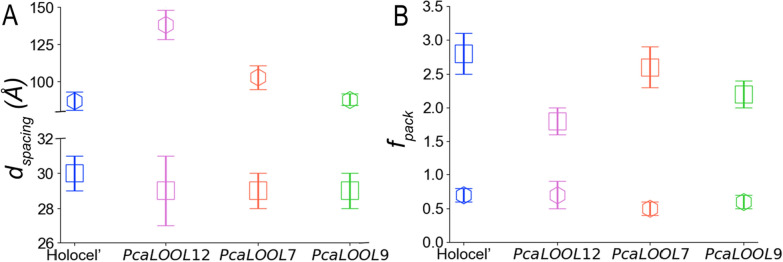
BACKGROUND: Microbial expansin-related proteins include fungal loosenins, which have been previously shown to disrupt cellulose networks and enhance the enzymatic conversion of cellulosic substrates. Despite showing beneficial impacts to cellulose processing, detailed characterization of cellulosic materials after loosenin treatment is lacking. In this study, small-angle neutron scattering (SANS) was used to investigate the effects of three recombinantly produced loosenins that originate from Phanerochaete carnosa, PcaLOOL7, PcaLOOL9, and PcaLOOL12, on the organization of holocellulose preparations from Eucalyptus and Spruce wood samples. RESULTS: Whereas the SANS analysis of Spruce holocellulose revealed an increase in interfibril spacing of neighboring cellulose microfibrils following treatment with PcaLOOL12 and to a lesser extent PcaLOOL7, the analysis of Eucalyptus holocellulose revealed a reduction in packing number following treatment with PcaLOOL12 and to a lesser extent PcaLOOL9. Parallel SEC-SAXS characterization of PcaLOOL7, PcaLOOL9, and PcaLOOL12 indicated the proteins likely function as monomers; moreover, all appear to retain a flexible disordered N-terminus and folded C-terminal region. The comparatively high impact of PcaLOOL12 motivated its NMR structural characterization, revealing a double-psi b-barrel (DPBB) domain surrounded by three alpha-helices - the largest nestled against the DPBB core and the other two part of loops extending from the core. CONCLUSIONS: The SANS analysis of PcaLOOL action on holocellulose samples confirms their ability to disrupt cellulose fiber networks and suggests a progression from reducing microfibril packing to increasing interfibril distance. The most impactful PcaLOOL, PcaLOOL12, was previously observed to be the most highly expressed loosenin in P. carnosa. Its structural characterization herein reveals its stabilization through two disulfide linkages, and an extended N-terminal region distal to a negatively charged and surface accessible polysaccharide binding groove.
Overview
The claims and statistics of this paper haven’t been checked yet.
Run the check — free, no account needed. It reads the open-access text and checks the sources it cites.
Integrity signals
Registry
Cites
Statistics
Figures
Verification
Claims the paper makes
The claims and statistics of this paper haven’t been checked yet.
Run the check — free, no account needed. It reads the open-access text and checks the sources it cites.
Self-check
Percentages, sums and reported differences re-computed from the paper’s own numbers.
The self-check needs the paper’s full text.
Citations
Cites
Highly accurate protein structure prediction with AlphaFold
Jumper, J., Evans, R., Pritzel, A., Green, T., Figurnov, M., Ronneberger, O., Tunyasuvunakool, K., Bates, R., Žídek, A., Potapenko, A., et al. (2021) · Nature · doi:10.1038/s41586-021-03819-2 · Cited by 43,764
Folding of xylan onto cellulose fibrils in plant cell walls revealed by solid-state NMR
Simmons, T. J., Mortimer, J. C., Bernardinelli, O. D., Pöppler, A.-C., Brown, S. P., deAzevedo, E. R., Dupree, R., & Dupree, P. (2016) · Nature Communications · doi:10.1038/ncomms13902 · Cited by 436
Research works printed but not linked: 85
- Cosgrove DJ. Characterization of long-term extension of isolated cell walls from growing cucumber hypocotyls. Planta. 1989;177(1):121–30. · DOI
- Cosgrove DJ. Plant expansins: diversity and interactions with plant cell walls. Curr Opin Plant Biol. 2015;25:162–72. · DOI
- McQueen-Mason S, Durachko DM, Cosgrove DJ. Two endogenous proteins that induce cell wall extension in Plants. Plant Cell. 1992;4(11):1425.
- Cosgrove D. Structure and growth of plant cell walls. Nat Rev Mol Cell Biol. 2024; 25:340–358. · DOI
- Park Y, Cosgrove D. A revised architecture of primary cell walls based on biomechanical changes induced by substrate-specific endoglucanases. Plant Physiol. 2012;158(4):1933–43. · DOI
- Sampedro J, Cosgrove DJ. The expansin superfamily. Genome Biol. 2005;6:242. · DOI
- Georgelis N, Nikolaidis N, Cosgrove DJ. Bacterial expansins and related proteins from the world of microbes. Appl Microbiol Biotechnol. 2015;99(9):3807–23. · DOI
- Cosgrove DJ. Microbial expansins. Annu Rev Microbiol. 2017;71:479–97. · DOI
- Chase WR, Zhaxybayeva O, Rocha J, Cosgrove DJ, Shapiro LR. Global cellulose biomass, horizontal gene transfers and domain fusions drive microbial expansin evolution. New Phytol. 2020;226(3):921–38. · DOI
- Kerff F, Amoroso A, Herman R, Sauvage E, Petrella SP, Filé P, et al. Crystal structure and activity of Bacillus subtilis YoaJ (EXLX1), a bacterial expansin that promotes root colonization. Biochem. 2008;105(44):16876–81.
- Georgelis N, Tabuchi A, Nikolaidis N, Cosgrove DJ. Structure-function analysis of the bacterial eexpansin EXLX1. J Biol Chem. 2011;286(19):16814–23. · DOI
- Hepler NK, Cosgrove DJ. Directed in vitro evolution of bacterial expansin BsEXLX1 for higher cellulose binding and its consequences for plant cell wall-loosening activities. FEBS Lett. 2019;593(18):2545–55. · DOI
- Saloheimo M, Paloheimo M, Hakola S, Pere J, Swanson B, Nyyssönen E, Bhatia A, Ward M, Penttilä M. Swollenin, a Trichoderma reesei protein with sequence similarity to the plant expansins, exhibits disruption activity on cellulosic materials. Eur J Biochem. 2002;269(17):4202–11. · DOI
- Quiroz-Castañeda RE, Martínez-Anaya C, Cuervo-Soto LI, Segovia L, Folch-Mallol JL. Loosenin, a novel protein with cellulose-disrupting activity from Bjerkandera adusta. Microb Cell Fact. 2011;10:8. · DOI
- Suzuki H, Vuong TV, Gong Y, Chan K, Ho CY, Master ER, Kondo A. Sequence diversity and gene expression analyses of expansin-related proteins in the white-rot basidiomycete, Phanerochaete carnosa. Fungal Genet Biol. 2014;72:115–23. · DOI
- Andberg M, Penttilä M, Saloheimo M. Swollenin from Trichoderma reesei exhibits hydrolytic activity against cellulosic substrates with features of both endoglucanases and cellobiohydrolases. Bioresour Technol. 2015;181:105–13. · DOI
- Kim I, Lee H, Choi I, Kim K. Synergistic proteins for the enhanced enzymatic hydrolysis of cellulose by cellulase. Appl Microbiol Biotechnol. 2014;98:8469–80. · DOI
- Gourlay K, Hu J, Arantes V, Andberg M, Saloheimo M, Penttilä M, Saddler J. Swollenin aids in the amorphogenesis step during the enzymatic hydrolysis of pretreated biomass. Bioresour Technol. 2013;142:498–503. · DOI
- Bunterngsook B, Eurwilaichitr L, Thamchaipenet A, Champreda V. Binding characteristics and synergistic effects of bacterial expansins on cellulosic and hemicellulosic substrates. Bioresour Technol. 2014;176:129–35. · DOI
- Ding S, Liu X, Hakulinen N, Taherzadeh M, Wang Y, Wang Y, et al. Boosting enzymatic degradation of cellulose using a fungal expansin: structural insight into the pretreatment mechanism. Bioresour Technol. 2022;358:127434. · DOI
- Dahiya D, Koitto T, Kutvonen K, Wang Y, Momeni M, de Ruijter S, et al. Fungal loosenin-like proteins boost the cellulolytic enzyme conversion of pretreated wood fiber and cellulosic pulps. Bioresour Technol. 2024;394:130188. · DOI
- Baker JO, King MR, Adney WS, Decker SR, Vinzant TB, Lantz SE, et al. Investigation of the cell-wall loosening protein expansin as a possible additive in the enzymatic saccharification of lignocellulosic biomass. Appl Biochem Biotechnol. 2000;84–86:217–23. · DOI
- Liu X, Ma Y, Zhang M. Research advances in expansins and expansion-like proteins involved in lignocellulose degradation. Biotechnol Lett. 2015;37(8):1541–51. · DOI
- Eibinger M, Sigl K, Sattelkow J, Ganner T, Ramoni J, Seiboth B, et al. Functional characterization of the native swollenin from Trichoderma reesei: Study of its possible role as C1 factor of enzymatic lignocellulose conversion. Biotechnol Biofuels. 2016;9(1):178. · DOI
- Lee H, Lee S, Ko H, Kim K, Choi I. An expansin-like protein from Hahella chejuensis binds cellulose and enhances cellulase activity. Mol Cells. 2010;29(4):379–85. · DOI
- Olarte-Lozano M, Mendoza-Nuñez MA, Pastor N, Segovia L, Folch-Mallol J, Martínez-Anaya C. PcExl1 a novel acid expansin-like protein from the plant pathogen Pectobacterium carotovorum, binds cell walls differently to BsEXLX1. PLoS ONE. 2014;9(4):e95638. · DOI
- Monschein M, Ioannou E, Koitto T, Al Amin LAKM, Varis JJ, Wagner ER, et al. Loosenin-like proteins from Phanerochaete carnosa impact both cellulose and chitin fiber networks. Appl Environ Microbiol. 2023;89(1):e0186322. · DOI
- Curtis JE, Nanda H, Khodadadi S, Cicerone M, Lee HJ, McAuley A, et al. Small-angle neutron scattering study of protein crowding in liquid and solid phases: lysozyme in aqueous solution, frozen solution, and carbohydrate powders. J Phys Chem B. 2012;116(32):9653–67. · DOI
- Pingali SV, Urban VS, Heller WT, McGaughey J, O’Neill HM, Foston M, et al. SANS study of cellulose extracted from switchgrass. Acta Crystallogr D Biol Crystallogr. 2010;66(11):1189–93. · DOI
- Zhu Y, Plaza N, Kojima Y, Yoshida M, Zhang J, Jellison J, et al. Nanostructural analysis of enzymatic and non-enzymatic brown rot fungal deconstruction of the lignocellulose cell wall. Front Microbiol. 2020;11:551979. · DOI
- Wise L, Murphy M, d’Addieco A. Chlorite holocellulose, its fractionation and bearing on summative wood analysis and on studies on the hemicelluloses. Pap Trade J. 1946;122(2):35–43.
- Ahlgren PA, Goring DAI. Removal of wood components during chlorite delignification of black spruce. Can J Chem. 1971;49(8):1272–5. · DOI
- Saeman J. Techniques for the determination of pulp constituents by quantitative paper chromatography. Tappi. 1954;37:336–43.
- Albersheim P, Nevins D, English P, Karr A. A method for the analysis of sugars in plant cell-wall polysaccharides by gas-liquid chromatography. Carbohydr Res. 1967;5(3):340–5. · DOI
- Iiyama K, Wallis AFA. An improved acetyl bromide procedure for determining lignin in woods and wood pulps. Wood Sci Technol. 1988;22(3):271–80. · DOI
- Johnson D, Moore W, Zank L. The spectrophotometric determination of lignin in small wood samples. Tappi. 1961;44(11):793.
- Hatfield RD, Grabber J, Ralph J, Brei K. Using the acetyl bromide assay to determine lignin concentrations in herbaceous plants: Some cautionary notes. J Agric Food Chem. 1999;47(2):628–32. · DOI
- Correddu D, López JM, Vadakkedath P, Lai A, Pernes J, Watson P, et al. An improved method for the heterologous production of soluble human ribosomal proteins in Escherichia coli. Sci Rep. 2019;9(1):8884. · DOI
- LaVallie E, Lu Z, Diblasio-Smith E, Collins-Racie L, McCoy J. Thioredoxin as a fusion partner for production of soluble recombinant proteins in Escherichia coli. Methods Enzymol. 2000;326(326):322–40. · DOI
- Szyperski T, Yeh DC, Sukumaran DK, Moseley HNB, Montelione GT. Reduced-dimensionality NMR spectroscopy for high-throughput protein resonance assignment. Proc Natl Acad Sci U S A. 2002;99(12):8009–14. · DOI
- Delaglio F, Grzesiek S, Vuister G, Zhu G, Pfeifer J, Bax A. NMRPipe: a multidimensional spectral processing system based on UNIX pipes. J Biomol NMR. 1995;6(3):277–93. · DOI
- Lee W, Rahimi M, Lee Y, Chiu A. POKY: a software suite for multidimensional NMR and 3D structure calculation of biomolecules. Bioinformatics. 2021;37(18):3041–2. · DOI
- Güntert P. Automated NMR structure calculation with CYANA. Methods Mol Biol. 2004;278:353–78.
- Shen Y, Delaglio F, Cornilescu G, Bax A. TALOS+: a hybrid method for predicting protein backbone torsion angles from NMR chemical shifts. J Biomol NMR. 2009;44:213–23. · DOI
- Sharma D, Rajarathnam K. 13C NMR chemical shifts can predict disulfide bond formation. J Biomol NMR. 2000;18(2):165–71. · DOI
- Linge JP, Williams MA, Spronk CAEM, Bonvin AMJJ, Nilges M. Refinement of protein structures in explicit solvent. Proteins. 2003;50(3):496–506. · DOI
- Bhattacharya A, Tejero R, Montelione G. Evaluating protein structures determined by structural genomics consortia. Proteins. 2007;66(4):778–95. · DOI
- Difabio J, Chodankar S, Pjerov S, Jakoncic J, Lucas M, Krywka C, et al. The life science x-ray scattering beamline at NSLS-II. AIP Conf Proc. 2016;1741(1):030049. · DOI
- Yang L, Antonelli S, Chodankar S, Byrnes J, Lazo E, Qian K. Solution scattering at the Life Science X-ray Scattering (LiX) beamline. J Synchrotron Radiat. 2020;27(3):804–12. · DOI
- Yang L, Lazo E, Byrnes J, Chodankar S, Antonelli S, Rakitin M. Tools for supporting solution scattering during the COVID-19 pandemic. J Synchrotron Radiat. 2021;28(4):1237–44. · DOI
- Hopkins J, Gillilan R, Skou S. BioXTAS RAW: improvements to a free open-source program for small-angle X-ray scattering data reduction and analysis. J Appl Crystallogr. 2017;50(5):1545–53. · DOI
- Franke D, Petoukhov M, Konarev P, Panjkovich A, Tuukkanen A, Mertens H, et al. ATSAS 2.8: a comprehensive data analysis suite for small-angle scattering from macromolecular solutions. J Appl Crystallogr. 2017;50(4):1212–25. · DOI
- Svergun D. Determination of the regularization parameter in indirect-transform methods using perceptual criteria. J Appl Crystallogr. 1992;25(4):495–503. · DOI
- Piiadov V, Ares de Araujo E, Oliveira Neto M, Craievich A, Polikarpov I. SAXSMoW 2.0 Online calculator of the molecular weight of proteins in dilute solution from experimental SAXS data measured on a relative scale. Protein Sci. 2019;28(2):454–63. · DOI
- Schneidman-Duhovny D, Hammel M, Sali A. FoXS: a web server for rapid computation and fitting of SAXS profiles. Nucleic Acids Res. 2010;38(2):W540–4. · DOI
- Schneidman-Duhovny D, Hammel M, Tainer J, Sali A. Accurate SAXS profile computation and its assessment by contrast variation experiments. Biophys J. 2013;105(4):962–74. · DOI
- Panjkovich A, Svergun DI. Deciphering conformational transitions of proteins by small angle X-ray scattering and normal mode analysis. Phys Chem Chem Phys. 2016;18(8):5707–19. · DOI · Paper page
- Pettersen EF, Goddard TD, Huang CC, Couch GS, Greenblatt DM, Meng EC, et al. UCSF Chimera—a visualization system for exploratory research and analysis. J Comput Chem. 2004;25(13):1605–12. · DOI
- Senanayake M, Lin CY, Mansfield SD, Eudes A, Davison BH, Pingali SV, et al. Ectopic production of 3,4-dihydroxybenzoate in planta affects cellulose structure and organization. Biomacromol. 2024;25(6):3542–53. · DOI
- Ilavsky J, Jemian PR. Irena: Tool suite for modeling and analysis of small-angle scattering. J Appl Crystallogr. 2009;42(2):347–53. · DOI
- Beaucage G. Approximations leading to a unified exponential/power-law approach to small-angle scattering. J Appl Crystallogr. 1995;28(6):717–28. · DOI · Paper page
- Mark J, Lee C, Bianconi P. Hybrid organic-inorganic composites. Washington, DC: American Chemical Society; 1995.
- Yee A, Chang X, Pineda-Lucena A, Wu B, Semesi A, Le B, et al. An NMR approach to structural proteomics. Proc Natl Acad Sci U S A. 2002;99(4):1825–30. · DOI
- Rossi P, Swapna G, Huang Y, Aramini J, Anklin C, Conover K, et al. A microscale protein NMR sample screening pipeline. J Biomol NMR. 2010;46(1):11–22. · DOI
- Castillo R, Mizuguchi K, Dhanaraj V, Albert A, Blundell T, Murzin A. A six-stranded double-psi β barrel is shared by several protein superfamilies. Structure. 1999;7(2):227–36. · DOI
- Wu R, Smith CA, Buchko GW, Blaby IK, Paez-Espino D, Kyrpides NC, et al. Structural characterization of a soil viral auxiliary metabolic gene product–a functional chitosanase. Nat Commun. 2022;13(1):5485. · DOI
- Holm L. DALI and the persistence of protein shape. Protein Sci. 2020;29(1):128–40. · DOI
- Juettner N, Schmelz S, Bogen J, Happel D, Fessner W, Pfeifer F, et al. Illuminating structure and acyl donor sites of a physiological transglutaminase substrate from Streptomyces mobaraensis. Protein Sci. 2018;27(5):910–22. · DOI
- Moynie L, Schnell R, McMahon S, Sandalova T, Boulkerou W, Schmidberger J, et al. The AEROPATH project targeting Pseudomonas aeruginosa: crystallographic studies for assessment of potential targets in early-stage drug discovery. Acta Crystallogr Sect F Struct Biol Cryst Commun. 2013;69(1):25–34. · DOI
- Offermann LR, Giangrieco I, Perdue ML, Zuzzi S, Santoro M, Tamburrini M, et al. Elusive structural, functional, and immunological features of Act d 5, the Green Kiwifruit Kiwellin. J Agric Food Chem. 2015;63(29):6567–76. · DOI
- Ciardiello M, Giangrieco I, Tuppo L, Tamburrini M, Buccheri M, Palazzo P, et al. Influence of the natural ripening stage, cold storage, and ethylene treatment on the protein and IgE-binding profiles of green and gold kiwi fruit extracts. J Agric Food Chem. 2009;57(4):1565–71. · DOI
- Sarafeddinov A, Arif A, Peters A, Fuchsbauer H. A novel transglutaminase substrate from Streptomyces mobaraensis inhibiting papain-like cysteine proteases. J Microbiol Biotechnol. 2011;21(6):617–26. · DOI
- Bhardwaj G, Mulligan V, Bahl C, Gilmore J, Harvey P, Cheneval O, et al. Accurate de novo design of hyperstable constrained peptides. Nature. 2016;538(7625):329–35. · DOI
- Chen P, Li Y, Nishiyama Y, Pingali SV, O’Neill HM, Zhang Q, et al. Small-angle neutron scattering shows nanoscale PMMA distribution in transparent wood biocomposites. Nano Lett. 2021;21(7):2883–90. · DOI
- Penttilä PA, Altgen M, Carl N, van der Linden P, Morfin I, Österberg M, et al. Moisture-related changes in the nanostructure of woods studied with x-ray and neutron scattering. Cellulose. 2020;27(1):71–87. · DOI
- Saxe F, Eder M, Benecke G, Aichmayer B, Fratzl P, Burgert I, et al. Measuring the distribution of cellulose microfibril angles in primary cell walls by small-angle x-ray scattering. Plant Methods. 2014;10(1):25. · DOI
- Fernandes AN, Thomas LH, Altaner CM, Callow P, Forsyth VT, Apperley DC, et al. Nanostructure of cellulose microfibrils in spruce wood. Proc Natl Acad Sci U S A. 2011;108(47):E1195–203. · DOI
- Thomas L, Martel A, Grillo I, Jarvis M. Hemicellulose binding and the spacing of cellulose microfibrils in spruce wood. Cellulose. 2020;27(8):4249–54. · DOI
- Nishiyama Y, Langan P, O’Neill H, Pingali S, Harton S. Structural coarsening of aspen wood by hydrothermal pretreatment monitored by small- and wide-angle scattering of x-rays and neutrons on oriented specimens. Cellulose. 2014;21(2):1015–24. · DOI
- Dupree R, Simmons TJ, Mortimer JC, Patel D, Iuga D, Brown SP, et al. Probing the molecular architecture of Arabidopsis thaliana secondary cell walls using two- and three-dimensional 13C solid state nuclear magnetic resonance. Biochem. 2015;54(14):2335–45. · DOI
- Shatalov A, Evtuguin D, Neto C. (2-O-α-d-Galactopyranosyl-4-O-methyl-α-d-glucurono)-d-xylan from Eucalyptus globulus Labill. Carbohydr Res. 1999;320(1–2):93–9. · DOI
- Terrett O, Dupree P. Covalent interactions between lignin and hemicelluloses in plant secondary cell walls. Curr Opin Biotechnol. 2019;56:97–104. · DOI
- Martínez-Abad A, Jiménez-Quero A, Wohlert J, Vilaplana F. Influence of the molecular motifs of mannan and xylan populations on their recalcitrance and organization in spruce softwoods. Green Chem. 2020;22(12):3956–70. · DOI
- Lyczakowski JJ, Bourdon M, Terrett OM, Helariutta Y, Wightman R, Dupree P. Structural imaging of native cryo-preserved secondary cell walls reveals the presence of macrofibrils and their formation requires normal cellulose, lignin and xylan biosynthesis. Front Plant Sci. 2019;10:1398. · DOI
- Beaucage G. Small-angle scattering from polymeric mass fractals of arbitrary mass-fractal dimension. J Appl Crystallogr. 1996;29(2):134–46. · DOI
Metadata
- Authors
- Dahiya, D., Péter-Szabó, Z., Senanayake, M., Pingali, S. V., Leite, W. C., Byrnes, J., Buchko, G. W., Sivan, P., Vilaplana, F., Master, E. R., & O’Neill, H.
- Affiliations
- Aalto University (FI)
- KTH Royal Institute of Technology (SE)
- Oak Ridge National Laboratory (US)
- Brookhaven National Laboratory (US)
- Pacific Northwest National Laboratory (US)
- Wallenberg Wood Science Center (SE)
- University of Toronto (CA)
- Corresponding author
- Master, Emma R.
- O’Neill, Hugh
- ORCID
- Venue
- Biotechnology for Biofuels and Bioproducts
- Published
- 2025-02-28
- Volume
- 18
- Issue
- 1
- Pages
- 27-27
- ISSN
- 2731-3654 (ISSN-L)
- PMC
- PMC11869483
- OpenAlex
- W4408066007
- Cited by
- 8
- References
- 2
- Citations by year
- 2026: 4 · 2025: 4
- FWCI
- 1.95
- Type
- journal article
- Language
- en
- Open access
- gold
- doi.org
- Licence
- Locations
- Biotechnology for Biofuels and Bioproducts (publishedVersion, cc-by-nc-nd)
- Research Square (acceptedVersion, cc-by)
- PubMed Central (publishedVersion, cc-by-nc-nd)
- PubMed (publishedVersion)
- Aaltodoc (Aalto University) (acceptedVersion, other-oa)
- PubMed Central (submittedVersion, cc-by)
- DOAJ (DOAJ: Directory of Open Access Journals) (submittedVersion)
- OSTI OAI (U.S. Department of Energy Office of Scientific and Technical Information) (submittedVersion)
- Funders
- Horizon 2020 Framework Programme (964764)
- Office of Science (FICUS -60859)
- Center for Structural Molecular Biology, USA (FWP ERKP291)
- Genomic Science Program, USA (FWP ERKP752)
- Biological and Environmental Research (KP1605010, DE-AC05-76RL01830)
- National Institute of General Medical Sciences (P30GM133893)
- National Institutes of Health (S10 OD012331)
- Topics
- Physical Sciences › Engineering › Biomedical Engineering › Biofuel production and bioconversion
- Physical Sciences › Materials Science › Biomaterials › Advanced Cellulose Research Studies
- Life Sciences › Agricultural and Biological Sciences › Plant Science › Polysaccharides and Plant Cell Walls
- Keywords
- holocellulose, eucalyptus wood, spruce wood, protein structure, disulfide bonds
About these checks
Registry, retraction, Cites and statistics results are computed, not judged, with one exception: a printed reference that no index lists is read once by a model before it counts as a citation error. Claims are extracted by a model and kept only when their quote appears verbatim in the text; each cited source is then checked, with a model’s help, for whether it says what the claim relies on. Those verdicts can be wrong — read the claim’s quote and the cited source before relying on one.
Statistics and arithmetic are recomputed, not judged.
Confidence bands are shown only for fields calibrated on our annotated test set. None is calibrated yet, so no band is shown.
What counts as a claim ›How we measure confidence ›How we check this ›
Are you an author, or do you see a problem with this page? Request a review
