

The DOI matches its Crossref record; 77 of the 77 references it cites were found in a registry or an index.
Exposure to the gut microbiota drives distinct methylome and transcriptome changes in intestinal epithelial cells during postnatal development
Open accessAbstract
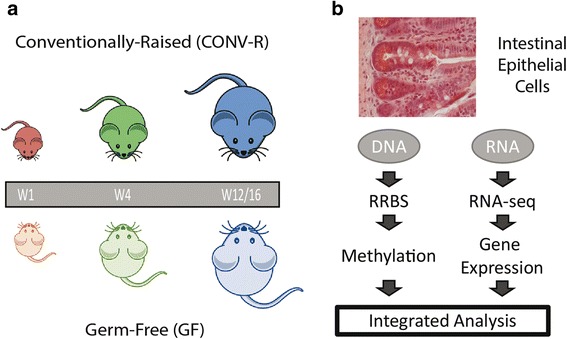
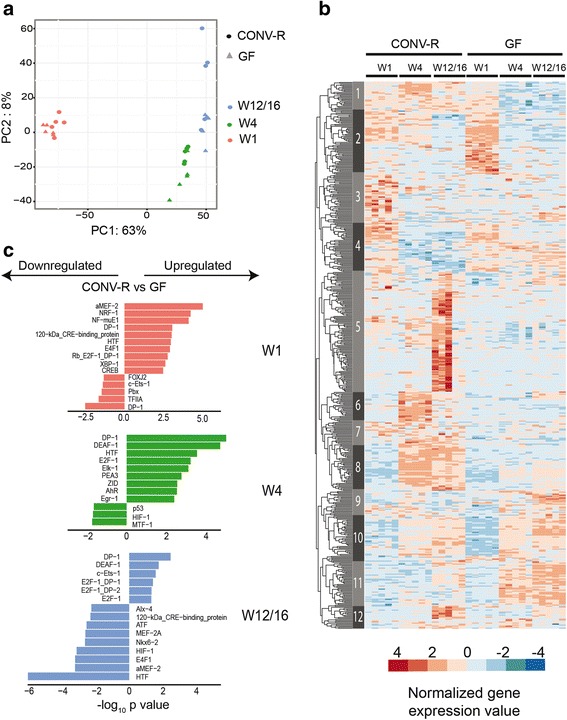
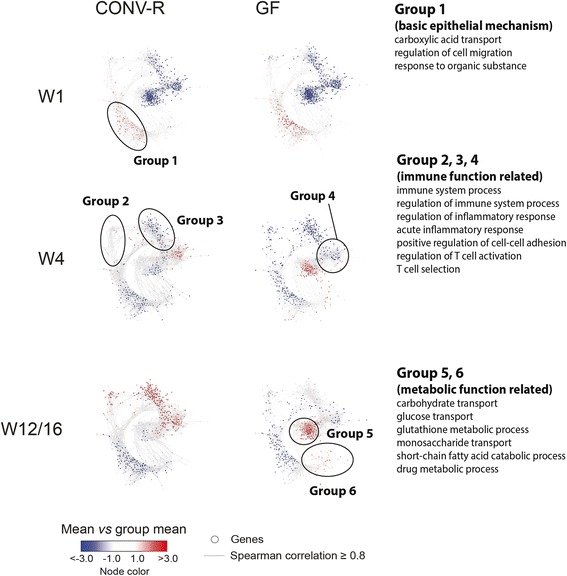
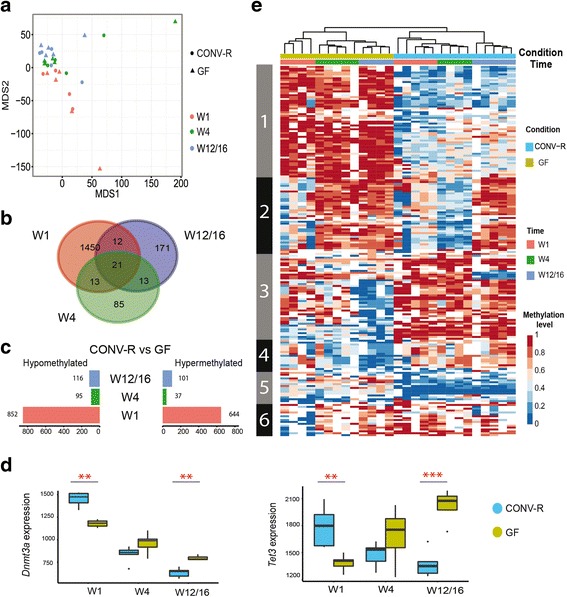
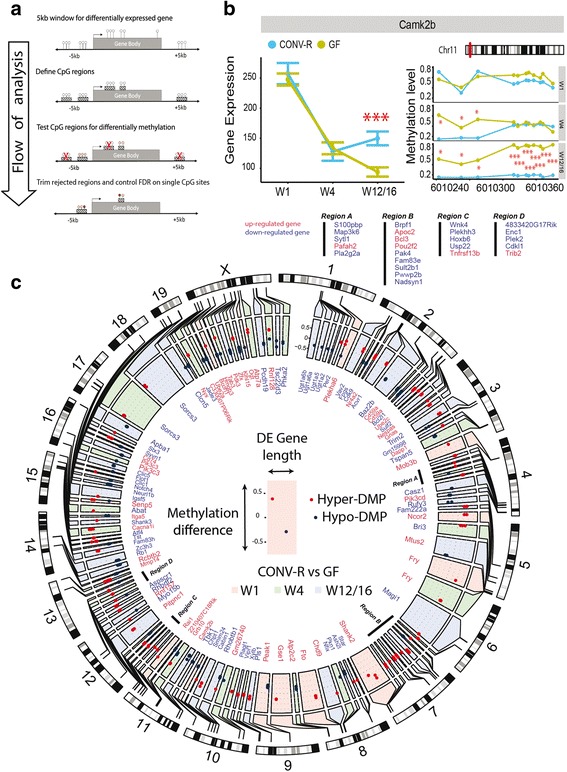
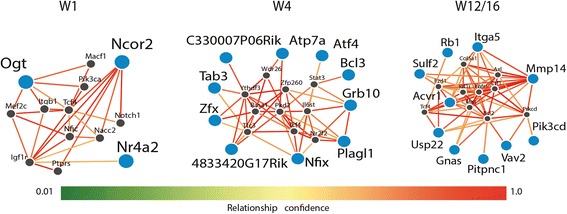
Background: The interplay of epigenetic processes and the intestinal microbiota may play an important role in intestinal development and homeostasis. Previous studies have established that the microbiota regulates a large proportion of the intestinal epithelial transcriptome in the adult host, but microbial effects on DNA methylation and gene expression during early postnatal development are still poorly understood. Here, we sought to investigate the microbial effects on DNA methylation and the transcriptome of intestinal epithelial cells (IECs) during postnatal development. Methods: We collected IECs from the small intestine of each of five 1-, 4- and 12 to 16-week-old mice representing the infant, juvenile, and adult states, raised either in the presence or absence of a microbiota. The DNA methylation profile was determined using reduced representation bisulfite sequencing (RRBS) and the epithelial transcriptome by RNA sequencing using paired samples from each individual mouse to analyze the link between microbiota, gene expression, and DNA methylation. Results: We found that microbiota-dependent and -independent processes act together to shape the postnatal development of the transcriptome and DNA methylation signatures of IECs. The bacterial effect on the transcriptome increased over time, whereas most microbiota-dependent DNA methylation differences were detected already early after birth. Microbiota-responsive transcripts could be attributed to stage-specific cellular programs during postnatal development and regulated gene sets involved primarily immune pathways and metabolic processes. Integrated analysis of the methylome and transcriptome data identified 126 genomic loci at which coupled differential DNA methylation and RNA transcription were associated with the presence of intestinal microbiota. We validated a subset of differentially expressed and methylated genes in an independent mouse cohort, indicating the existence of microbiota-dependent “functional” methylation sites which may impact on long-term gene expression signatures in IECs. Conclusions: Our study represents the first genome-wide analysis of microbiota-mediated effects on maturation of DNA methylation signatures and the transcriptional program of IECs after birth. It indicates that the gut microbiota dynamically modulates large portions of the epithelial transcriptome during postnatal development, but targets only a subset of microbially responsive genes through their DNA methylation status.
Overview
The claims and statistics of this paper haven’t been checked yet.
Run the check — free, no account needed. It reads the open-access text and checks the sources it cites.
Integrity signals
Registry
Cites
Statistics
Figures
Verification
Claims the paper makes
The claims and statistics of this paper haven’t been checked yet.
Run the check — free, no account needed. It reads the open-access text and checks the sources it cites.
Claims other papers make about this one
Each is checked against this paper’s own text: does it say what the citing paper says it does?
The source backs part of the claim, not all of it — or backs it for a different population, condition or comparison.
In the citing paper
“Due to the lack of commensal microbes, GF animals have impaired immune systems, dysregulated hormone signaling, altered metabolism, and differences in neurotransmission from conventional counterparts (Kawase et al., 2017;Neufeld et al., 2011;Pan et al., 2018;Sudo et al., 2004;Weger et al., 2019).”
From The Microbiota-Gut-Brain Axis (2019) · cites this paper as Pan et al., 2018
Experimental — accuracy not yet measured
Self-check
Percentages, sums and reported differences re-computed from the paper’s own numbers.
The self-check needs the paper’s full text.
Citations
Cites
Moderated estimation of fold change and dispersion for RNA-seq data with DESeq2
Love, M. I., Huber, W., & Anders, S. (2014) · Genome Biology · doi:10.1186/s13059-014-0550-8 · Cited by 95,106
Fast gapped-read alignment with Bowtie 2
Langmead, B., & Salzberg, S. L. (2012) · Nature Methods · doi:10.1038/nmeth.1923 · Cited by 56,400
HTSeq—a Python framework to work with high-throughput sequencing data
Anders, S., Pyl, P. T., & Huber, W. (2015) · Bioinformatics · doi:10.1093/bioinformatics/btu638 · Cited by 21,464
Kim, D., Pertea, G., Trapnell, C., Pimentel, H., Kelley, R., & Salzberg, S. L. (2013) · Genome Biology · doi:10.1186/gb-2013-14-4-r36 · Cited by 12,668
Okano, M., Bell, D. W., Haber, D. A., & Li, E. (1999) · Cell · doi:10.1016/s0092-8674(00)81656-6 · Cited by 6,143
Functions of DNA methylation: islands, start sites, gene bodies and beyond
Jones, P. A. (2012) · Nature Reviews Genetics · doi:10.1038/nrg3230 · Cited by 6,061
Diversity, stability and resilience of the human gut microbiota
Lozupone, C. A., Stombaugh, J. I., Gordon, J. I., Jansson, J. K., & Knight, R. (2012) · Nature · doi:10.1038/nature11550 · Cited by 5,533
Bismark: a flexible aligner and methylation caller for Bisulfite-Seq applications
Krueger, F., & Andrews, S. (2011) · Bioinformatics · doi:10.1093/bioinformatics/btr167 · Cited by 5,324
Metabolites produced by commensal bacteria promote peripheral regulatory T-cell generation
Arpaia, N., Campbell, C., Fan, X., Dikiy, S., van der Veeken, J., deRoos, P., Liu, H., Cross, J. R., Pfeffer, K., Coffer, P. J., et al. (2013) · Nature · doi:10.1038/nature12726 · Cited by 4,838
circlize implements and enhances circular visualization in R
Gu, Z., Gu, L., Eils, R., Schlesner, M., & Brors, B. (2014) · Bioinformatics · doi:10.1093/bioinformatics/btu393 · Cited by 4,290
Research works printed but not linked: 1
- Legendre P, Legendre L. Numerical ecology. 3rd ed. Cambridge: Elsevier; 2012.
Cited by
Sorted by citations
Cryan, J. F., O'Riordan, K. J., Cowan, C. S. M., Sandhu, K. V., Bastiaanssen, T. F. S., Boehme, M., Codagnone, M. G., Cussotto, S., Fulling, C., Golubeva, A. V., et al. (2019) · Physiological Reviews · doi:10.1152/physrev.00018.2018 · Cited by 5,286
The gut microbiome: Relationships with disease and opportunities for therapy
Durack, J., & Lynch, S. V. (2018) · The Journal of Experimental Medicine · doi:10.1084/jem.20180448 · Cited by 979
The Human Microbiome and Child Growth – First 1000 Days and Beyond
Robertson, R. C., Manges, A. R., Finlay, B. B., & Prendergast, A. J. (2019) · Trends in Microbiology · doi:10.1016/j.tim.2018.09.008 · Cited by 793
Short chain fatty acids: Microbial metabolites for gut-brain axis signalling
O’Riordan, K. J., Collins, M., Moloney, G. M., Knox, E. G., Aburto, M. R., Fülling, C., Morley, S. J., Clarke, G. A., Schellekens, H., & Cryan, J. F. (2022) · Molecular and Cellular Endocrinology · doi:10.1016/j.mce.2022.111572 · Cited by 788
The interaction among gut microbes, the intestinal barrier and short chain fatty acids
Ma, J., Piao, X., Mahfuz, S. U., Long, S., & Wang, J. (2021) · Animal nutrition · doi:10.1016/j.aninu.2021.09.012 · Cited by 432
Metadata
- Authors
- Pan, W.-H., Sommer, F., Falk-Paulsen, M., Ulas, T., Best, L., Fazio, A., Kachroo, P., Luzius, A., Jentzsch, M., Rehman, A., Müller, F., Lengauer, T., Walter, J., Künzel, S., Baines, J. F., Schreiber, S., Franke, A., Schultze, J. L., Bäckhed, F., & Rosenstiel, P.
- Affiliations
- Christian-Albrechts-Universität zu Kiel (DE)
- University of Bonn (DE)
- Max Planck Institute for Informatics (DE)
- Saarland University (DE)
- University of Copenhagen (DK)
- Corresponding author
- Rosenstiel, Philip
- ORCID
- Venue
- Genome Medicine
- Published
- 2018-04-13
- Volume
- 10
- Issue
- 1
- Pages
- 27-27
- ISSN
- 1756-994X (ISSN-L)
- PMC
- PMC5899322
- OpenAlex
- W2802827720
- Cited by
- 157
- References
- 77
- Citations by year
- 2026: 11 · 2025: 15 · 2024: 16 · 2023: 24 · 2022: 21 · 2021: 20 · 2020: 29 · 2019: 15 · 2018: 6
- FWCI
- 6.23
- Type
- journal article
- Language
- en
- Open access
- gold
- doi.org
- Locations
- Genome Medicine (publishedVersion, cc-by)
- Europe PMC (PubMed Central) (publishedVersion, other-oa)
- PubMed Central (publishedVersion, cc-by)
- PubMed (publishedVersion)
- Research at the University of Copenhagen (University of Copenhagen) (publishedVersion, other-oa)
- DOAJ (DOAJ: Directory of Open Access Journals) (submittedVersion, cc-by-sa)
- Max Planck Digital Library (submittedVersion, other-oa)
- DZNE Pub (submittedVersion, other-oa)
- MPG.PuRe (Max Planck Society) (submittedVersion, other-oa)
- Funders
- Deutsche Forschungsgemeinschaft (RTG 1743/1, CRC877 B9, ExC 306 Inflammation at Interfaces, ExC 1023 ImmunoSensation, CRC1182 C2)
- BMBF (DEEP IHEC network grant (TP5.2 and 2.3))
- Topics
- Life Sciences › Biochemistry, Genetics and Molecular Biology › Molecular Biology › Gut microbiota and health
- Life Sciences › Biochemistry, Genetics and Molecular Biology › Molecular Biology › Epigenetics and DNA Methylation
- Health Sciences › Medicine › Gastroenterology › Digestive system and related health
- Keywords
- gut microbiota, DNA methylation, intestinal epithelial cells, postnatal development, transcriptome, immune pathways, metabolism, intestinal development
- MeSH terms
- Gastrointestinal Microbiome, Animals, Epithelial Cells, Female, Intestines, Mice, Inbred C57BL, RNA, Transcription, Genetic, Gene Expression Regulation, Developmental, DNA Methylation, Growth and Development, Genetic Loci, Transcriptome
About these checks
Registry, retraction, Cites and statistics results are computed, not judged, with one exception: a printed reference that no index lists is read once by a model before it counts as a citation error. Claims are extracted by a model and kept only when their quote appears verbatim in the text; each cited source is then checked, with a model’s help, for whether it says what the claim relies on. Those verdicts can be wrong — read the claim’s quote and the cited source before relying on one.
Statistics and arithmetic are recomputed, not judged.
Confidence bands are shown only for fields calibrated on our annotated test set. None is calibrated yet, so no band is shown.
What counts as a claim ›How we measure confidence ›How we check this ›
Are you an author, or do you see a problem with this page? Request a review
