

The DOI matches its Crossref record; 156 of the 156 references it cites were found in a registry or an index.
DeepGAMI: deep biologically guided auxiliary learning for multimodal integration and imputation to improve genotype-phenotype prediction
Open accessPublished version of a preprint
Abstract
Background: Genotypes are strongly associated with disease phenotypes, particularly in brain disorders. However, the molecular and cellular mechanisms behind this association remain elusive. With emerging multimodal data for these mechanisms, machine learning methods can be applied for phenotype prediction at different scales, but due to the black-box nature of machine learning, integrating these modalities and interpreting biological mechanisms can be challenging. Additionally, the partial availability of these multimodal data presents a challenge in developing these predictive models. Method: To address these challenges, we developed DeepGAMI, an interpretable neural network model to improve genotype–phenotype prediction from multimodal data. DeepGAMI leverages functional genomic information, such as eQTLs and gene regulation, to guide neural network connections. Additionally, it includes an auxiliary learning layer for cross-modal imputation allowing the imputation of latent features of missing modalities and thus predicting phenotypes from a single modality. Finally, DeepGAMI uses integrated gradient to prioritize multimodal features for various phenotypes. Results: We applied DeepGAMI to several multimodal datasets including genotype and bulk and cell-type gene expression data in brain diseases, and gene expression and electrophysiology data of mouse neuronal cells. Using cross-validation and independent validation, DeepGAMI outperformed existing methods for classifying disease types, and cellular and clinical phenotypes, even using single modalities (e.g., AUC score of 0.79 for Schizophrenia and 0.73 for cognitive impairment in Alzheimer’s disease). Conclusion: We demonstrated that DeepGAMI improves phenotype prediction and prioritizes phenotypic features and networks in multiple multimodal datasets in complex brains and brain diseases. Also, it prioritized disease-associated variants, genes, and regulatory networks linked to different phenotypes, providing novel insights into the interpretation of gene regulatory mechanisms. DeepGAMI is open-source and available for general use.
Overview
The claims and statistics of this paper haven’t been checked yet.
Free: it reads the open-access text and checks the first 5 claims that cite a source we can check. Create a free account to check every claim.
Integrity signals
Registry
Cites
Statistics
Figures


Verification
Claims the paper makes
The claims and statistics of this paper haven’t been checked yet.
Free: it reads the open-access text and checks the first 5 claims that cite a source we can check. Create a free account to check every claim.
Claims other papers make about this one
Each is checked against this paper’s own text: does it say what the citing paper says it does?
In the citing paper
“Illustrative examples can be found in the study by Wan et al. (2013) and Chandrashekar et al. (2023), where a model trained with complete data is used to imputation for incomplete data.”
From A review of multimodal deep learning methods for genomic-enabled prediction in plant breeding (2024) · cites this paper as Chandrashekar et al. (2023)
Self-check
Percentages, sums and reported differences re-computed from the paper’s own numbers.
The self-check needs the paper’s full text.
Citations
Cites
Adam: A Method for Stochastic Optimization
Kingma, D. P., & Ba, J. (2014) · arXiv · doi:10.48550/arxiv.1412.6980 · Cited by 98,946
Scikit-learn: Machine Learning in Python
Pedregosa, F., Varoquaux, G., Gramfort, A., Michel, V., Thirion, B., Grisel, O., Blondel, M., Müller, A., Nothman, J., Louppe, G., et al. (2012) · arXiv · doi:10.48550/arxiv.1201.0490 · Cited by 71,016 · cited 1×
“Next, we applied StandardScaler() function from scikit-learn [87] for the two modalities separately which scales the data such that they have zero mean and unit variance.”
MethodPLINK: a tool set for whole-genome association and population-based linkage analyses.
Purcell, S., Neale, B., Todd-Brown, K., Thomas, L., Ferreira, M. A. R., Bender, D., Maller, J., Sklar, P., de Bakker, P. I. W., Daly, M. J., et al. (2007) · The American Journal of Human Genetics · doi:10.1086/519795 · Cited by 34,089 · cited 1×
“Thus, we calculated PRS for SCZ (binary trait) using three different methods: PLINK [140], LDpred2 [141], and PRSice [142] on our data.”
MethodSMOTE synthetic minority over-sampling technique
Chawla, N. V., Bowyer, K. W., Hall, L. O., & Kegelmeyer, W. P. (2002) · Journal of Artificial Intelligence Research · doi:10.1613/jair.953 · Cited by 32,865 · cited 1×
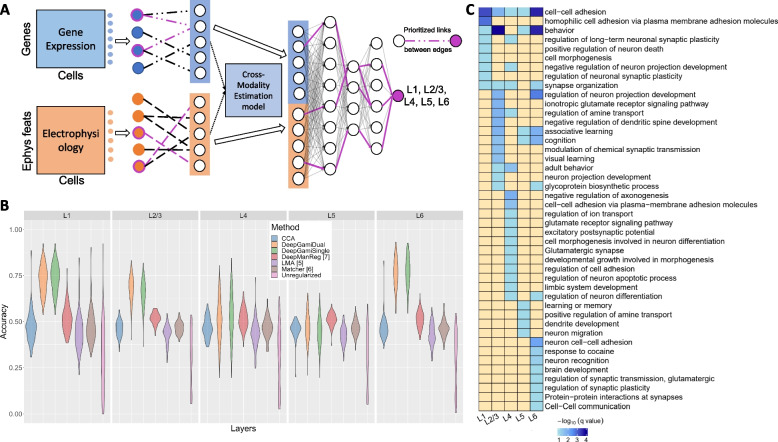
“…imbalance in the number of cells for each layer (L1: 262 cells; L2/3: 1097 cells; L4: 385 cells; L5: 1176 cells; L6: 734 cells), we applied SMOTE [121] oversampling technique on the training set to have a balanced number of cells for each layer in the training label and ended up with 941 cells…”
MethodMetascape provides a biologist-oriented resource for the analysis of systems-level datasets
Zhou, Y., Zhou, B., Pache, L., Chang, M., Khodabakhshi, A. H., Tanaseichuk, O., Benner, C., & Chanda, S. K. (2019) · Nature Communications · doi:10.1038/s41467-019-09234-6 · Cited by 14,611 · cited 2×
“We then perform enrichment analysis on these genes using Metascape [86].”
BackgroundMethodProceedings of the 24th international conference on Machine learning
(2007) · doi:10.1145/1273496 · Cited by 11,630
Finding the missing heritability of complex diseases
Manolio, T. A., Collins, F. S., Cox, N. J., Goldstein, D. B., Hindorff, L. A., Hunter, D. J., McCarthy, M. I., Ramos, E. M., Cardon, L. R., Chakravarti, A., et al. (2009) · Nature · doi:10.1038/nature08494 · Cited by 8,336
Biological insights from 108 schizophrenia-associated genetic loci
Schizophrenia Working Group of the Psychiatric Genomics Consortium (2014) · Nature · doi:10.1038/nature13595 · Cited by 7,577 · cited 1×
“Many genome-wide association studies (GWAS) determine the association of genetic variants with many heritable diseases [3, 4], including neurodegenerative and psychiatric diseases like Alzheimer’s disease (AD) [5–8] and schizophrenia (SCZ) [9, 10].”
BackgroundA systematic analysis of performance measures for classification tasks
Sokolova, M., & Lapalme, G. (2009) · Information Processing & Management · doi:10.1016/j.ipm.2009.03.002 · Cited by 7,515 · cited 1×
“Also, AUC works best in the binary classification setting and has inconsistencies in the multi-class problem [104, 105].”
BackgroundGenetic effects on gene expression across human tissues
GTEx Consortium (2017) · Nature · doi:10.1038/nature24277 · Cited by 4,036 · cited 3×
“We extracted 146,763 eQTLs from GTEx consortium [88] for the human brain frontal cortex (BA9), and used GRNs from the PsychENCODE consortium.”
Method
Research works printed but not linked: 5
- Sutton RS et al. Horde: a scalable real-time architecture for learning knowledge from unsupervised sensorimotor interaction. In: The 10th international conference on autonomous agents and multiagent systems-volume 2. 2011. p. 761–768.
- Lin X, Baweja H, Kantor G, Held D. Adaptive auxiliary task weighting for reinforcement learning. In: Proceedings of the 33rd Annual Conference on Neural Information Processing Systems (NIPS2019), Vancouver, BC, Canada; 2019.
- Paszke A, Gross S, Massa F, Lerer A, Bradbury J, Chanan G, Killeen T, Lin Z, Gimelshein N, Antiga L, Desmaison A. Pytorch: An imperative style, high-performance deep learning library. Adv Neural Inf Process Sys. 2019;32.
- Sundararajan M, Taly A, Yan Q. Axiomatic attribution for deep networks. In: Proceedings of the 34th International Conference on Machine Learning, Sydney, Australia. 2017;70:3319–28.
- Wang C, Mahadevan S. Alignment without correspondence. In: In Proceedings of the 21st International Joint Conferences on Artificial Intelligence. 2009.
Cited by
Practical AI application in psychiatry: historical review and future directions
Sun, J., Lu, T., Shao, X., Han, Y., Xia, Y., Zheng, Y., Wang, Y., Li, X., Ravindran, A. V., Fan, L., et al. (2025) · Molecular Psychiatry · doi:10.1038/s41380-025-03072-3 · Cited by 98
“DeepGAMI outperformed the Polygenic Risk Score for schizophrenia (AUC = 0.61) with dual (AUC = 0.895) and single (AUC = 0.867) models, indicating that its hidden layers effectively capture covariate effects [48].”
InfluentialTMO-Net: an explainable pretrained multi-omics model for multi-task learning in oncology
Wang, F.-A., Zhuang, Z., Gao, F., He, R., Zhang, S., Wang, L., Liu, J., & Li, Y. (2024) · Genome Biology · doi:10.1186/s13059-024-03293-9 · Cited by 51
A review of multimodal deep learning methods for genomic-enabled prediction in plant breeding
Montesinos-López, O. A., Chavira-Flores, M., Kiasmiantini, Crespo-Herrera, L., Saint Piere, C., Li, H., Fritsche-Neto, R., Al-Nowibet, K., Montesinos-López, A., & Crossa, J. (2024) · GENETICS · doi:10.1093/genetics/iyae161 · Cited by 47
Lee, H., Kim, W., Kwon, N., Kim, C., Kim, S., & An, J. (2025) · Genomics & Informatics · doi:10.1186/s44342-025-00040-9 · Cited by 21
“…integrated eQTLs and gene regulatory networks from PsychENCODE, ROSMAP, and GTEx, revealing novel genotype–phenotype relationships in brain diseases such as schizophrenia and AD while demonstrating the power of machine learning approaches in understanding complex neurological conditions [58].”
Multi‐Omics‐Augmented GWAS for Crop Improvement: From Mechanisms to Breeding
Mangi, N., Zhao, Q., Li, M., Li, C., Yan, L. E., Kong, L., Qin, A., Zhou, Y., Liu, H., Zhang, Y.-P., et al. (2025) · Modern Agriculture · doi:10.1002/moda.70032 · Cited by 13
Metadata
- Authors
- Chandrashekar, P. B., Alatkar, S., Wang, J., Hoffman, G. E., He, C., Jin, T., Khullar, S., Bendl, J., Fullard, J. F., Roussos, P., & Wang, D.
- Affiliations
- University of Wisconsin–Madison (US)
- University of Pittsburgh (US)
- Icahn School of Medicine at Mount Sinai (US)
- Nathan Kline Institute for Psychiatric Research (US)
- Corresponding author
- Wang, Daifeng
- ORCID
- Venue
- Genome Medicine
- Published
- 2023-10-31
- Volume
- 15
- Issue
- 1
- Pages
- 88-88
- ISSN
- 1756-994X (ISSN-L)
- PMC
- PMC10617196
- OpenAlex
- W4388035454
- Cited by
- 37
- References
- 150
- Citations by year
- 2026: 8 · 2025: 14 · 2024: 13 · 2023: 1
- FWCI
- 5.98
- Type
- journal article
- Language
- en
- Open access
- gold
- doi.org
- Licence
- cc-by
- creativecommons.org/licenses/by/4.0 (tdm)
- creativecommons.org/licenses/by/4.0 (vor)
- Locations
- Genome Medicine (publishedVersion, cc-by)
- bioRxiv (Cold Spring Harbor Laboratory) (acceptedVersion)
- PubMed Central (publishedVersion, cc-by)
- PubMed (publishedVersion)
- DOAJ (DOAJ: Directory of Open Access Journals) (submittedVersion, cc-by-sa)
- Funders
- National Institute on Aging (R01AG067025)
- National Institute of Mental Health (RF1MH128695)
- National Science Foundation (2144475)
- Topics
- Life Sciences › Biochemistry, Genetics and Molecular Biology › Genetics › Genetic Associations and Epidemiology
- Life Sciences › Biochemistry, Genetics and Molecular Biology › Molecular Biology › Bioinformatics and Genomic Networks
- Physical Sciences › Computer Science › Artificial Intelligence › Machine Learning in Healthcare
- Keywords
- genotype-phenotype prediction, multimodal data integration, auxiliary learning, interpretable neural networks, expression quantitative trait loci, gene expression regulation, integrated gradients, brain disorders, schizophrenia, Alzheimer's disease, cognitive impairment, electrophysiology, disease-associated variants, regulatory networks
- MeSH terms
- Machine Learning, Alzheimer Disease, Animals, Genotype, Phenotype, Neural Networks, Computer, Mice
About these checks
Registry, retraction, Cites and statistics results are computed, not judged, with one exception: a printed reference that no index lists is read once by a model before it counts as a citation error. Claims are extracted by a model and kept only when their quote appears verbatim in the text; each cited source is then checked, with a model’s help, for whether it says what the claim relies on. Those verdicts can be wrong — read the claim’s quote and the cited source before relying on one.
Statistics and arithmetic are recomputed, not judged.
Confidence bands are shown only for fields calibrated on our annotated test set. None is calibrated yet, so no band is shown.
What counts as a claim ›How we measure confidence ›How we check this ›
Are you an author, or do you see a problem with this page? Request a review
How to cite
Cite CoChat for the checks on this page, and the paper for its own findings.
- This page
- CoChat. (2026). Citation check: DeepGAMI: deep biologically guided auxiliary learning for multimodal integration and imputation to improve genotype-phenotype prediction. https://app.cochat.ai/papers/10.1186/s13073-023-01248-6
- The paper
- Chandrashekar, P. B., Alatkar, S., Wang, J., Hoffman, G. E., He, C., Jin, T., Khullar, S., Bendl, J., Fullard, J. F., Roussos, P., & Wang, D. (2023). DeepGAMI: deep biologically guided auxiliary learning for multimodal integration and imputation to improve genotype-phenotype prediction. Genome Medicine. https://doi.org/10.1186/s13073-023-01248-6
Data sources
Bibliographic data: Semantic Scholar, OpenAlex, Crossref.
Contains information from the Semantic Scholar Academic Graph Datasets, made available under the ODC Attribution License (ODC-BY 1.0).
Semantic Scholar’s data is described in: Kinney, R., et al. (2023). The Semantic Scholar Open Data Platform. arXiv:2301.10140.
