

The DOI matches its Crossref record; 52 of the 52 references it cites were found in a registry or an index.
A distinct gut microbiota composition in patients with ankylosing spondylitis is associated with increased levels of fecal calprotectin
Open accessAbstract
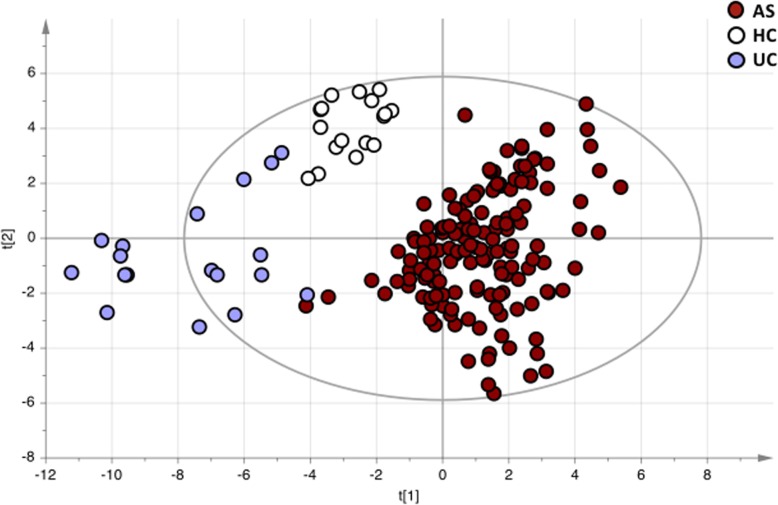
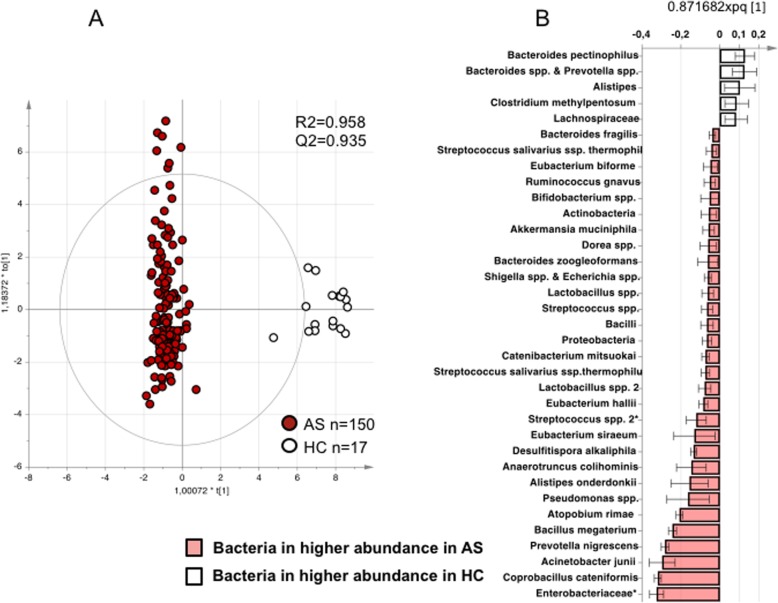
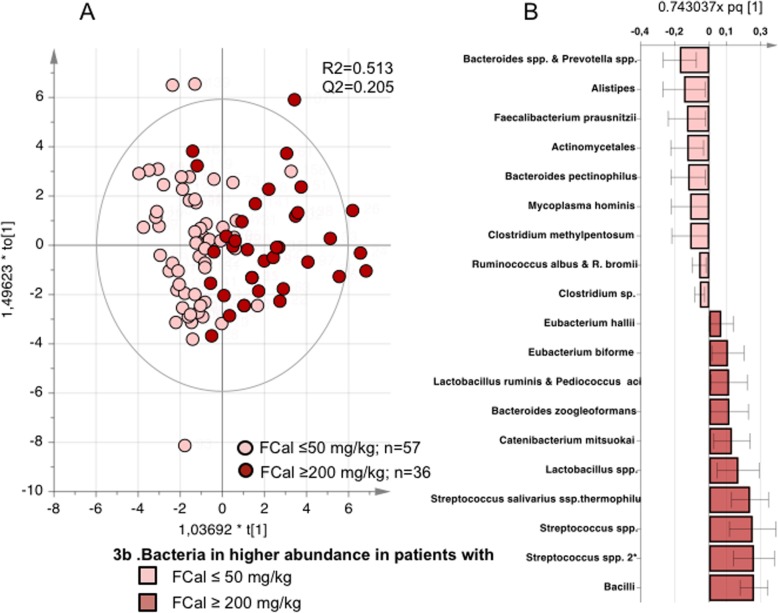
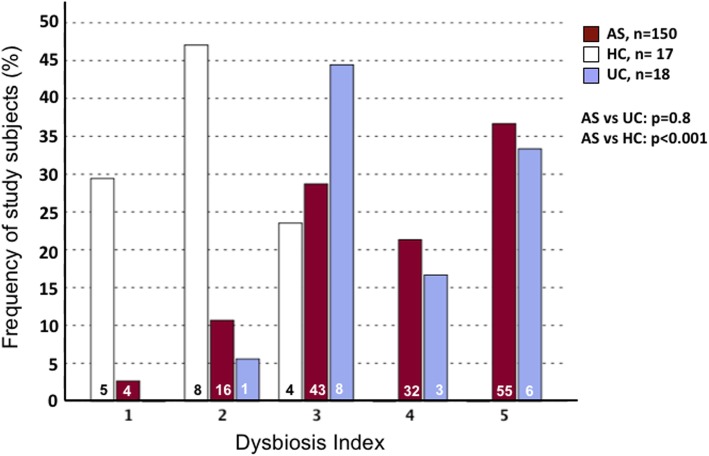
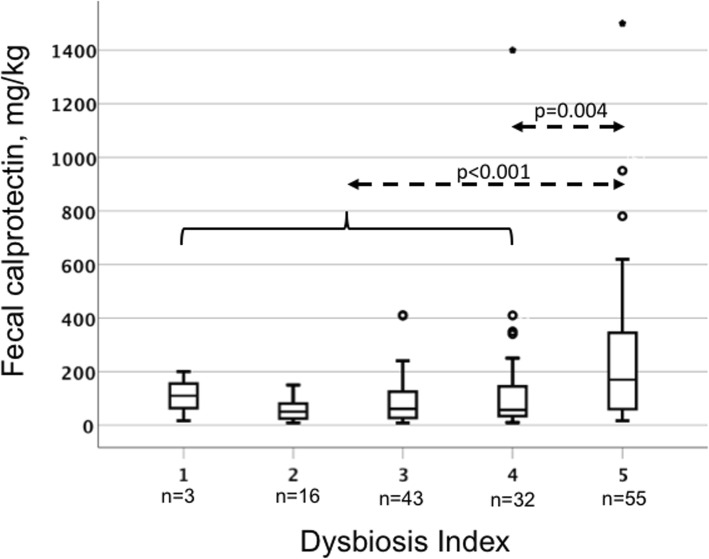
BACKGROUND: Ankylosing spondylitis (AS) shares many characteristics with inflammatory bowel disease (IBD). Intestinal microbiota most likely plays an important role in the development of IBDs and may also be involved in the pathogenesis of AS. We aimed to define and compare the fecal microbiota composition in patients with AS, ulcerative colitis (UC), and healthy controls (HC) and to determine relationships between fecal microbiota, fecal calprotectin, and disease-related variables in AS. METHODS: Fecal microbiota composition was assessed with GA-map™ Dysbiosis Test (Genetic Analysis, Oslo, Norway), which also reports the degree of deviation of the microbiota composition compared with a healthy control population, a Dysbiosis Index (DI) score 1-5. The AS patients were assessed with questionnaires, back mobility tests, fecal calprotectin, erythrocyte sedimentation rate (ESR), and C-reactive protein (CRP). RESULTS: Totally, 150 patients with AS (55% men, median age 55.5 years, median BASDAI 3.2), 18 patients with UC (56% men, median age 30.5 years), and 17 HC (65% men, median age 22 years) were included. Principal component analysis showed highly separate clustering of fecal microbiota from the patients with AS, UC, and HC. Compared with HC, fecal microbiota in AS was characterized by a higher abundance of Proteobacteria, Enterobacteriaceae, Bacilli, Streptococcus species, and Actinobacteria, but lower abundance of Bacteroides and Lachnospiraceae. Further, fecal microbiota composition differed between patients with normal (≤ 50 mg/kg, n = 57) and increased (≥ 200 mg/kg, n = 36) fecal calprotectin. Patients with increased fecal calprotectin had lower abundance of bacteria with anti-inflammatory properties such as Faecalibacterium prausnitzii and Clostridium and higher abundance of the genus Streptococcus. No association was found between the fecal microbiota composition and HLAB27 status, disease activity, function, or medication. Dysbiosis (defined as DI ≥ 3) was found in 87% of AS patients. CONCLUSIONS: Patients with AS have a distinct fecal microbiota signature, which is linked to fecal calprotectin levels, a marker of intestinal inflammation, but not to other clinical parameters. These findings suggest a local interplay between intestinal microbiota and gut inflammation in AS. TRIAL REGISTRATION: ClinicalTrials.gov, NCT00858819. Registered March 9, 2009.
Overview
The claims and statistics of this paper haven’t been checked yet.
Run the check — free, no account needed. It reads the open-access text and checks the sources it cites.
Integrity signals
Registry
Cites
Statistics
Figures
Verification
Claims the paper makes
The claims and statistics of this paper haven’t been checked yet.
Run the check — free, no account needed. It reads the open-access text and checks the sources it cites.
Claims other papers make about this one
Each is checked against this paper’s own text: does it say what the citing paper says it does?
In the citing paper
“On the contrary, in the presence of gut dysbiosis and disorders (IBS, Chrohn’s diseases, etc.), the levels of calprotectin usually are high and several times higher than the values of the healthy elderly at the end of our study [29].”
Self-check
Percentages, sums and reported differences re-computed from the paper’s own numbers.
The self-check needs the paper’s full text.
Citations
Cites
Evaluation of Diagnostic Criteria for Ankylosing Spondylitis
van der Linden, S., Valkenburg, H. A., & Cats, A. (1984) · Arthritis & Rheumatism · doi:10.1002/art.1780270401 · Cited by 5,707
Sokol, H., Pigneur, B., Watterlot, L., Lakhdari, O., Bermúdez-Humarán, L. G., Gratadoux, J.-J., Blugeon, S., Bridonneau, C., Furet, J.-P., Corthier, G., et al. (2008) · Proceedings of the National Academy of Sciences · doi:10.1073/pnas.0804812105 · Cited by 4,413
The Treatment-Naive Microbiome in New-Onset Crohn’s Disease
Gevers, D., Kugathasan, S., Denson, L. A., Vázquez-Baeza, Y., Van Treuren, W., Ren, B., Schwager, E., Knights, D., Song, S. J., Yassour, M., et al. (2014) · Cell Host & Microbe · doi:10.1016/j.chom.2014.02.005 · Cited by 3,220
Satsangi, J., Silverberg, M. S., Vermeire, S., & Colombel, J.-F. (2006) · Gut · doi:10.1136/gut.2005.082909 · Cited by 3,173
Coated Oral 5-Aminosalicylic Acid Therapy for Mildly to Moderately Active Ulcerative Colitis
Schroeder, K. W., Tremaine, W. J., & Ilstrup, D. M. (1987) · New England Journal of Medicine · doi:10.1056/nejm198712243172603 · Cited by 3,037
The Microbiome in Inflammatory Bowel Disease: Current Status and the Future Ahead
Kostic, A. D., Xavier, R. J., & Gevers, D. (2014) · Gastroenterology · doi:10.1053/j.gastro.2014.02.009 · Cited by 1,789
Sieper, J., Rudwaleit, M., Baraliakos, X., Brandt, J., Braun, J., Burgos‐Vargas, R., Dougados, M., Hermann, K., Landewé, R., Maksymowych, W. P., et al. (2009) · Annals of the Rheumatic Diseases · doi:10.1136/ard.2008.104018 · Cited by 1,654
Darfeuille-Michaud, A., Boudeau, J., Bulois, P., Neut, C., Glasser, A.-L., Barnich, N., Bringer, M.-A., Swidsinski, A., Beaugerie, L., & Colombel, J.-F. (2004) · Gastroenterology · doi:10.1053/j.gastro.2004.04.061 · Cited by 1,566
Gut microbiota in the pathogenesis of inflammatory bowel disease
Nishida, A., Inoüe, R., Inatomi, O., Bamba, S., Naito, Y., & Andoh, A. (2017) · Clinical Journal of Gastroenterology · doi:10.1007/s12328-017-0813-5 · Cited by 1,440
Proteobacteria: A Common Factor in Human Diseases
Rizzatti, G., Lopetuso, L. R., Gibiino, G., Binda, C., & Gasbarrini, A. (2017) · BioMed Research International · doi:10.1155/2017/9351507 · Cited by 1,308
Research works printed but not linked: 1
- Eriksson LK-WN, Trygg J, Wikström C. Multi- and megavariate data analysis: part I: basic principles and applications. Umeå: Umetrics Inc; 2006.
Cited by
Sorted by citations
Ankylosing spondylitis: an autoimmune or autoinflammatory disease?
Mauro, D., Thomas, R., Guggino, G., Lories, R. J. U., Brown, M. A., & Ciccia, F. (2021) · Nature Reviews Rheumatology · doi:10.1038/s41584-021-00625-y · Cited by 371
Gut Microbiota: A Novel Therapeutic Target for Parkinson’s Disease
Zhu, M., Liu, X., Ye, Y., Yan, X., Cheng, Y., Zhao, L., Chen, F., & Ling, Z. (2022) · Frontiers in Immunology · doi:10.3389/fimmu.2022.937555 · Cited by 177
Ankylosing spondylitis risk factors: a systematic literature review
Hwang, M. C., Ridley, L. K., & Reveille, J. D. (2021) · Clinical Rheumatology · doi:10.1007/s10067-021-05679-7 · Cited by 164
Yang, M., Wan, X., Zheng, H., Xu, K., Xie, J., Yu, H., Wang, J., & Xu, P. (2023) · Nutrients · doi:10.3390/nu15041057 · Cited by 125
Gut microbiome studies in CKD: opportunities, pitfalls and therapeutic potential
Krukowski, H., Valkenburg, S., Madella, A. M., Garssen, J., van Bergenhenegouwen, J., Overbeek, S. A., Huys, G. R. B., Raes, J., & Glorieux, G. (2022) · Nature Reviews Nephrology · doi:10.1038/s41581-022-00647-z · Cited by 127
Zádori, Z., Király, K. P., Al‐Khrasani, M., & Gyires, K. (2022) · Pharmacology & Therapeutics · doi:10.1016/j.pharmthera.2022.108327 · Cited by 92
Underwood, M. A., Mukhopadhyay, S., Lakshminrusimha, S., & Bevins, C. L. (2020) · Journal of Perinatology · doi:10.1038/s41372-020-00829-2 · Cited by 89
Rademacher, J., Poddubnyy, D., & Pleyer, U. (2020) · Therapeutic Advances in Musculoskeletal Disease · doi:10.1177/1759720x20951733 · Cited by 80
Role of the microbiome and its metabolites in ankylosing spondylitis
Song, Z., Yuan, D., & Zhang, S. (2022) · Frontiers in Immunology · doi:10.3389/fimmu.2022.1010572 · Cited by 72
Alberts, R., de Vries, E. M. G., Goode, E. C., Jiang, X., Sampaziotis, F., Rombouts, K., Böttcher, K., Folseraas, T., Weismüller, T. J., Mason, A. L., et al. (2017) · Gut · doi:10.1136/gutjnl-2016-313598 · Cited by 58
T cell Repertoire Profiling and the Mechanism by which HLA-B27 Causes Ankylosing Spondylitis
Garrido‐Mesa, J., & Brown, M. A. (2022) · Current Rheumatology Reports · doi:10.1007/s11926-022-01090-6 · Cited by 54
Gut microbiota changes in patients with spondyloarthritis: A systematic review
Wang, L., Wang, Y., Zhang, P., Song, C., Pan, F., Li, G., Peng, L., Yang, Y., Wei, Z., & Huang, F. (2021) · Seminars in Arthritis and Rheumatism · doi:10.1016/j.semarthrit.2021.11.002 · Cited by 47
Characteristics of the intestinal microbiome in ankylosing spondylitis
Cardoneanu, A., Cozma, S. R., Rezuș, C., Petrariu, F. D., Burlui, A., & Rezuş, E. (2021) · Experimental and Therapeutic Medicine · doi:10.3892/etm.2021.10108 · Cited by 45
De Giani, A., Sandionigi, A., Zampolli, J., Michelotti, A., Tursi, F., Labra, M., & Di Gennaro, P. (2022) · Microorganisms · doi:10.3390/microorganisms10061256 · Cited by 46
Spondyloarthritis with inflammatory bowel disease: the latest on biologic and targeted therapies
Cozzi, G., Scagnellato, L., Lorenzin, M., Savarino, E. V., Zingone, F., Ometto, F., Favero, M., Doria, A., Vavricka, S. R., & Ramonda, R. (2023) · Nature Reviews Rheumatology · doi:10.1038/s41584-023-00984-8 · Cited by 43
Kupczyk, D., Bilski, R., Szeleszczuk, Ł., Mądra-Gackowska, K., & Studzińska, R. (2025) · Nutrients · doi:10.3390/nu17091603 · Cited by 57
Sternes, P. R., Brett, L., Phipps, J., Ciccia, F., Kenna, T., de Guzman, E., Zimmermann, K., Morrison, M., Holtmann, G., Klingberg, E., et al. (2022) · Arthritis Research & Therapy · doi:10.1186/s13075-022-02853-3 · Cited by 39
Self-citationExploring the role of gut microbiome in autoimmune diseases: A comprehensive review
Wang, H., Cai, Y., Wu, W. ‐., Zhang, M., Dai, Y., & Wang, Q. (2024) · Autoimmunity Reviews · doi:10.1016/j.autrev.2024.103654 · Cited by 42
Brereton, N. J. B., Pitre, F. E., & González, E. (2021) · Computational and Structural Biotechnology Journal · doi:10.1016/j.csbj.2021.03.040 · Cited by 35
Gut Microbiome and Its Interaction with Immune System in Spondyloarthritis
So, J., & Tam, L. (2020) · Microorganisms · doi:10.3390/microorganisms8111727 · Cited by 33
Ricciuto, A., Sherman, P. M., & Laxer, R. M. (2020) · Clinical Immunology · doi:10.1016/j.clim.2020.108415 · Cited by 33
Similarities and Differences Between Juvenile and Adult Spondyloarthropathies
Fisher, C., Ciurtin, C., Leandro, M. J., Sen, D., & Wedderburn, L. R. (2021) · Frontiers in Medicine · doi:10.3389/fmed.2021.681621 · Cited by 31
The Emerging World of Microbiome in Autoimmune Disorders: Opportunities and Challenges
Mangalam, A. K., Yadav, M., & Yadav, R. (2021) · Indian Journal of Rheumatology · doi:10.4103/injr.injr_210_20 · Cited by 29
Liao, H., Tsai, C., Lai, C., Hsieh, S., Sun, Y.-S., Li, K., Shen, C., Wu, C.-H., Lu, C., Kuo, Y., et al. (2022) · Frontiers in Cell and Developmental Biology · doi:10.3389/fcell.2021.748063 · Cited by 29
Sagard, J., Olofsson, T., Mogård, E., Marsal, J., Andréasson, K., Geijer, M., Kristensen, L. E., Lindqvist, E., & Wallman, J. K. (2022) · Arthritis Research & Therapy · doi:10.1186/s13075-022-02733-w · Cited by 26
Vallier, M., Ségurens, B., Larsonneur, E., Meyer, V., Ferreira, S., Caloustian, C., Deleuze, J., Dougados, M., Chamaillard, M., & Miceli-Richard, C. (2023) · RMD Open · doi:10.1136/rmdopen-2022-002794 · Cited by 22
Sandionigi, A., Giani, A. D., Tursi, F., Michelotti, A., Cestone, E., Giardina, S., Zampolli, J., & Gennaro, P. D. (2022) · BioMed Research International · doi:10.1155/2022/3860896 · Cited by 24
Calprotectin in Parkinsonian disease: Anticipation and dedication
Al-Kuraishy, H. M., Al-Gareeb, A. I., Zaidalkilani, A. T., Alexiou, A. T., Papadakis, M., Bahaa, M. M., AL-Faraga, A., & Batiha, G. E. (2023) · Ageing Research Reviews · doi:10.1016/j.arr.2023.102143 · Cited by 23
‘All disease begins in the gut’—the role of the intestinal microbiome in ankylosing spondylitis
Harkins, P., Burke, E. P., Swales, C. E., & Silman, A. J. (2021) · Rheumatology Advances in Practice · doi:10.1093/rap/rkab063 · Cited by 20
Zhang, H., Wei, Y., Jia, H., Chen, D.-L., Tang, X., Wang, J., Chen, M., & Guo, Y. (2022) · Frontiers in Cellular and Infection Microbiology · doi:10.3389/fcimb.2022.1035366 · Cited by 22
Intestinal Microbial Metabolites in Ankylosing Spondylitis
Scalise, G., Ciancio, A., Mauro, D., & Ciccia, F. (2021) · Journal of Clinical Medicine · doi:10.3390/jcm10153354 · Cited by 25
Stoll, M. L., DeQuattro, K., Li, Z., Sawhney, H., Weiss, P. F., Nigrovic, P. A., Wright, T. B., Schikler, K. N., Edelheit, B. S., Morrow, C. D., et al. (2022) · Children · doi:10.3390/children9040569 · Cited by 19
Axial spondyloarthritis patients have altered mucosal IgA response to oral and fecal microbiota
Gill, T., Stauffer, P., Asquith, M. J., Laderas, T., Martin, T. M., Davin, S., Schleisman, M., Ramirez, C., Ogle, K., Lindquist, I. E., et al. (2022) · Frontiers in Immunology · doi:10.3389/fimmu.2022.965634 · Cited by 18
Microbial-derived antigens and metabolites in spondyloarthritis
Yang, K. L., Lejeune, A., Chang, G. A., Scher, J. U., & Koralov, S. B. (2021) · Seminars in Immunopathology · doi:10.1007/s00281-021-00844-1 · Cited by 19
Lyu, X., Chen, J., Gao, X., & Yang, J. (2022) · Frontiers in Cellular and Infection Microbiology · doi:10.3389/fcimb.2022.973563 · Cited by 16
Contribution of mycobiota to the pathogenesis of spondyloarthritis
Berthelot, J., Darrieutort‐Laffite, C., Trang, C., Maugars, Y., & Goff, B. L. (2021) · Joint Bone Spine · doi:10.1016/j.jbspin.2021.105245 · Cited by 16
Exploring the Pathogenesis of Spondylarthritis beyond HLA-B27: A Descriptive Review
Nagit, R.-E., Rezuş, E., & Cianga, P. (2024) · International Journal of Molecular Sciences · doi:10.3390/ijms25116081 · Cited by 15
The gut barrier and chronic diseases
Santilli, A., Stefanopoulos, S., & Cresci, G. A. M. (2022) · Current Opinion in Clinical Nutrition & Metabolic Care · doi:10.1097/mco.0000000000000820 · Cited by 15
Marquez-Ortíz, R. A., Leon, M., Abril, D., Escobar-Pérez, J. A., Flórez-Sarmiento, C., Parra-Izquierdo, V., Chalem, P., & Romero‐Sánchez, C. (2023) · Scientific Reports · doi:10.1038/s41598-023-33597-y · Cited by 14
Lejon, K., Hellman, U., Do, L., Kumar, A., & Forsblad‐d’Elia, H. (2022) · Scandinavian Journal of Immunology · doi:10.1111/sji.13190 · Cited by 13
Self-citationGoosen, C., Proost, S., Baumgartner, J., Mallick, K., Tito, R. Y., Barnabas, S. L., Cotton, M. F., Zimmermann, M. B., Raes, J., & Blaauw, R. (2023) · Journal of Human Nutrition and Dietetics · doi:10.1111/jhn.13171 · Cited by 14
The role of the gut and intestinal dysbiosis in the pathogenesis of spondyloarthritis
Mauro, D., Cai, B., Ciancio, A., Forte, G., Gandolfo, S., Thomas, R., Bergot, A., & Ciccia, F. (2025) · Joint Bone Spine · doi:10.1016/j.jbspin.2025.105923 · Cited by 16
Feng, H.-Y., Chan, C., Chu, Y.-C., Qu, X.-M., Wang, Y., & Wei, J. C. (2022) · Postgraduate Medicine · doi:10.1080/00325481.2022.2041338 · Cited by 13
Akiyama, M., Alshehri, W., Suzuki, K., Shimanuki, K., Saito, K., & Kaneko, Y. (2025) · Autoimmunity Reviews · doi:10.1016/j.autrev.2025.103853 · Cited by 13
Hulander, E., Sandström, T. Z., Rehnman, J. B., Law, L., Söderberg, S., & Forsblad‐d’Elia, H. (2023) · Arthritis Research & Therapy · doi:10.1186/s13075-023-03126-3 · Cited by 11
Self-citationTang, J., Mo, S., Fan, L., Fu, S., & Liu, X. (2024) · Frontiers in Immunology · doi:10.3389/fimmu.2024.1284466 · Cited by 11
Du, X., Li, H., Zhao, H., Cui, S., Sun, X., & Tan, X. (2024) · PLoS ONE · doi:10.1371/journal.pone.0306792 · Cited by 10
Ng, B. C. K., & Lassere, M. N. (2024) · Seminars in Arthritis and Rheumatism · doi:10.1016/j.semarthrit.2024.152574 · Cited by 11
Qu, Y., Park, S. H., & Dallas, D. C. (2023) · Nutrients · doi:10.3390/nu15194174 · Cited by 10
[Characteristics of intestinal flora in patients with primary Sjögren syndrome].
Wang, X., Wang, J., Guo, W., Zhou, Y., Sun, C., Li, Z., Chen, L., & Pan, X. (2020) · PubMed Central · doi:10.12122/j.issn.1673-4254.2020.07.06 · Cited by 9
Characteristics of the gastrointestinal microbiota in paired live kidney donors and recipients
Chan, S., Morrison, M., Hawley, C. M., Campbell, S. B., Francis, R. S., Isbel, N. M., Pascoe, E. M., & Johnson, D. W. (2021) · Nephrology · doi:10.1111/nep.13853 · Cited by 9
González‐Chávez, S. A., Salas‐Leiva, J. S., Salas-Leiva, D. E., López-Loeza, S. M., Sausameda-García, J., Orrantia‐Borunda, E., Burgos‐Vargas, R., Alvarado-Jáquez, M. F., Torres-Quintana, M., Cuevas-Martínez, R., et al. (2023) · PLoS ONE · doi:10.1371/journal.pone.0281265 · Cited by 9
Dysbiosis in Inflammatory Bowel Disease and Spondyloarthritis: Still a Long Way to Go?
Bragazzi, M. C., Pianigiani, F., Venere, R., & Ridola, L. (2024) · Journal of Clinical Medicine · doi:10.3390/jcm13082237 · Cited by 6
Erçalık, C., Başkaya, M. Ç., Özdem, S., & Bütün, B. (2021) · Arab Journal of Gastroenterology · doi:10.1016/j.ajg.2021.05.020 · Cited by 6
Cmtm4 deficiency exacerbates colitis by inducing gut dysbiosis and S100a8/9 expression
Qiao, M., Ning, J., Lu, J., Zhang, J., Zu, M., Zhang, J., Han, X., Zheng, H., Gong, Y., Hao, X., et al. (2024) · Journal of genetics and genomics/Journal of Genetics and Genomics · doi:10.1016/j.jgg.2024.03.009 · Cited by 6
The gut microbiota in spondyloarthritis: an update
Rodríguez, V. R., Essex, M., & Poddubnyy, D. (2025) · Current Opinion in Rheumatology · doi:10.1097/bor.0000000000001079 · Cited by 5
Koszewicz, M. A., Mulak, A., Dziadkowiak, E., & Budrewicz, S. P. (2021) · Frontiers in Human Neuroscience · doi:10.3389/fnhum.2021.733070 · Cited by 5
Sima, S., Jeffries, T. C., Sial, A. W., Sharma, S., Lande, R. D. L., Chopra, N., Kohan, S., Khong, P., & Diwan, A. D. (2025) · European Spine Journal · doi:10.1007/s00586-025-09046-x · Cited by 5
Wang, X., Sun, C., Yang, X., Xu, G., Pei, L., Tang, L., Xu, S., & Xie, C. (2025) · Clinical Rheumatology · doi:10.1007/s10067-025-07467-z · Cited by 4
Parkinson’s disease beyond the brain: implications for treatments
Naeini, S. M., Lopez, M. D., Fraser, P. E., & Tandon, A. (2025) · Frontiers in Aging Neuroscience · doi:10.3389/fnagi.2025.1600782 · Cited by 4
Morin, M., Hellgren, K. E., Lindström, U., & Frisell, T. (2023) · RMD Open · doi:10.1136/rmdopen-2023-003438 · Cited by 4
Differential gut microbiome in spondyloarthritis patients associated to Blastocystis colonization
Nieto‐Clavijo, C., Morales, L., Marquez-Ortíz, R. A., Romero‐Sánchez, C., Ramos-Casallas, A., Escobar-Pérez, J. A., Bautista‐Molano, W., Bello-Gualtero, J. M., & Chaparro‐Olaya, J. (2023) · Scientific Reports · doi:10.1038/s41598-023-39055-z · Cited by 4
Qu, Y., Lyu, R., Wang, D., Dai, Y., Turcan, A., Yu, S., Xie, J., Roach, J. M., Butler, C. A., Yap, P., et al. (2025) · bioRxiv (Cold Spring Harbor Laboratory) · doi:10.1101/2025.02.17.638709 · Cited by 4
Discovery of fecal microbial signatures in patients with ankylosing spondylitis
You, Y., Zhang, W., Cai, M., Guo, Q., Wang, J., Cai, Y., & Lin, J. (2023) · Archives of Rheumatology · doi:10.46497/archrheumatol.2023.9124 · Cited by 3
Zhao, S., Qu, Y., Huang, H., Xie, P., Cai, X., Peng, Q., Peng, J., Zhang, W., Zhou, H., Yan, H., et al. (2025) · Beneficial Microbes · doi:10.1163/18762891-bja00058 · Cited by 3
Stebbings, S. M., & Roberts, R. L. (2021) · EMJ Rheumatology · doi:10.33590/emjrheumatol/21-00025 · Cited by 3
Bu, S., Kar, W., Tucker, R. M., & Comstock, S. S. (2022) · Life · doi:10.3390/life12111849 · Cited by 3
Ahmed, S., Mahapatra, S., Mishra, R., Murmu, K. C., Padhan, P., Prasad, P., & Misra, R. (2024) · Lara D. Veeken · doi:10.1093/rheumatology/keae165 · Cited by 3
Hellman, U., Lejon, K., Do, L., Geijer, M., Baraliakos, X., Witte, T., & Forsblad‐d’Elia, H. (2024) · Modern Rheumatology · doi:10.1093/mr/roae039 · Cited by 3
Self-citationUnzueta-Medina, J. A., González‐Chávez, S. A., Salas‐Leiva, J. S., Silva-Sánchez, S. E., & Pacheco‐Tena, C. (2024) · Ocular Immunology and Inflammation · doi:10.1080/09273948.2024.2346818 · Cited by 3
Gill, T. (2025) · Rheumatic Disease Clinics of North America · doi:10.1016/j.rdc.2025.01.006 · Cited by 2
Inflammatory Arthritis and the Environment: Causes and Consequences of Spondyloarthritis
Benucci, M., Russo, E., Gobbi, F. L., Manfredi, M., & Infantino, M. G. (2025) · Journal of Personalized Medicine · doi:10.3390/jpm15060237 · Cited by 5
Zhang, T., Chen, S., Zhang, C., Chen, R., Zhou, P., Li, Z.-C., He, Q., Fu, X., Wen, W., Zhang, C.-P., et al. (2025) · Human Immunology · doi:10.1016/j.humimm.2025.111616 · Cited by 2
Affinity between gut microbiota and ankylosing spondylitis: insight from causal analysis
Li, Z., Pei, J., Ruan, J., Cui, H., Li, S., & Jiang, T. (2026) · FEMS Microbiology Letters · doi:10.1093/femsle/fnag016 · Cited by 2
Gut microbiota and ankylosing spondylitis: mechanisms, functional pathways, and research trends
Liu, Z., Li, N., Zhang, H., & Hao, D. (2026) · Frontiers in Microbiology · doi:10.3389/fmicb.2026.1828220 · Cited by 2
Relationship between Gut Microbiota and Bone Health
Lü, H., You, K., Yang, L., Shen, J., Liu, B., Guo, Y., Chen, T., & Li, G. (2022) · Mini-Reviews in Medicinal Chemistry · doi:10.2174/1389557522666220304230920 · Cited by 2
Hulander, E., Hallström, M., Feldthusen, C., Klingberg, E., Rehnman, J. B., Geijer, M., Sandström, T. Z., Söderberg, S., Deminger, A., & Forsblad‐d’Elia, H. (2025) · Scandinavian Journal of Rheumatology · doi:10.1080/03009742.2025.2503062 · Cited by 2
Self-citationAhmed, S., Mishra, R., Mahapatra, S., Murmu, K. C., Padhan, P., Prasad, P., & Misra, R. (2023) · SSRN Electronic Journal · doi:10.2139/ssrn.4455358 · Cited by 2
Hazra, N., Sengupta, S., Burman, D., Banerjee, J. S., & Bhattacharya, M. (2024) · Advances in Biomarker Sciences and Technology · doi:10.1016/j.abst.2024.12.002 · Cited by 1
Exhaustion‐Resistant CD8 + T Cells in Ankylosing Spondylitis: A Proposed Three‐Axis Model
Zhang, X., Lu, J., Lin, X., & Zhou, L. (2025) · Immunology · doi:10.1111/imm.70044 · Cited by 2
Guleria, S., Umam, F., Lawrence, A., & Aggarwal, A. (2025) · Clinical Rheumatology · doi:10.1007/s10067-025-07889-9 · Cited by 1
Vižlin, A., Claesson, H., Björkman, Y. A., Gillstedt, M., Klingberg, E., Micu, E., & Osmančević, A. (2026) · JEADV Clinical Practice · doi:10.1002/jvc2.70258 · Cited by 1
Self-citationZhang, Y., Ping, X., Wang, C., Zhou, X., Huang, Y., Li, K., & Lv, J. (2026) · Frontiers in Pharmacology · doi:10.3389/fphar.2026.1719219 · Cited by 1
Sima, S., Jeffries, T., Sial, A. W., Sharma, S., Chopra, N., Zhang, F., Hold, G. L., Li, W., Tu, J., Chen, V., et al. (2026) · JOR Spine · doi:10.1002/jsp2.70174 · Cited by 1
The role of microbiome in uveitis
Amin, H., & Shoughy, S. S. (2023) · Exploration of Medicine · doi:10.37349/emed.2023.00190 · Cited by 1
Characteristics of the Gut Microbiota in Rheumatic Diseases and Promising Therapeutic Strategies
Zhang, S., & Yang, X. (2022) · Journal of Biomedical Research & Environmental Sciences · doi:10.37871/jbres1627
Is Faecal Calprotectin Important in Detecting Silent Gut Inflammation in Seronegative Arthropathies?
Magro, F., & Estevinho, M. M. (2020) · Journal of Crohn s and Colitis · doi:10.1093/ecco-jcc/jjaa011 · Cited by 1
Lejon, K., Hellman, U., Do, L., Kumar, A., & Forsblad‐d’Elia, H. (2021) · Research Square · doi:10.21203/rs.3.rs-144140/v1
Self-citationContribution du mycobiote à la pathogénie des spondyloarthrites
Berthelot, J., Darrieutort‐Laffite, C., Trang, C., Maugars, Y., & Goff, B. L. (2022) · Revue du Rhumatisme · doi:10.1016/j.rhum.2022.03.007
Zhao, M., & Kronenberg, M. (2023) · Arthritis & Rheumatology · doi:10.1002/art.42660
Xu, J., Li, H., Fu, C., Wang, H., Liu, Z., Lin, W., & Chen, D. (2024) · Research Square · doi:10.21203/rs.3.rs-4371276/v1
Mikrobielle und genetische Faktoren in der Pathogenese der Spondyloarthritis
Rademacher, J., Poddubnyy, D., & Rodríguez, V. R. (2024) · Zeitschrift für Rheumatologie · doi:10.1007/s00393-024-01593-w
Sternes, P. R., Brett, L., Phipps, J., Ciccia, F., Kenna, T., de Guzman, E., Zimmermann, K., Morrison, M., Holtmann, G., Klingberg, E., et al. (2022) · Figshare · doi:10.6084/m9.figshare.20250472
Self-citationHulander, E., Zverkova-Sandström, T., Rehnman, J. B., Law, L., Söderberg, S., & Forsblad‐d’Elia, H. (2023) · Figshare · doi:10.6084/m9.figshare.23902911
Self-citationThe Role of Neutrophil, Monocyte and Macrophage Calprotectin and S100A12 in the Fibrotic Process
Regino-Zamarripa, N. E., Burciaga, A. S., Bocanegra-Mondragón, M., Cruz‐Lagunas, A., Camarena, Á., Jiménez-Álvarez, L. A., Ramı́rez, R., Ramírez-Martínez, G., & Zúñiga, J. (2026) · Biomolecules · doi:10.3390/biom16040553
Ankylosing spondylitis and the gut microbiome: future research hotspots and trends
Yin, X., Peng, H., Li, Y., Song, Y., Yao, N., Shen, Z., Chen, H., Huang, L., Li, P., He, Z., et al. (2026) · Frontiers in Immunology · doi:10.3389/fimmu.2026.1784757
Posta, E., Gyarmati, E., Majoros, L., Fekete, I., Várkonyi, I. Z., Zöld, É., & Barta, Z. (2026) · Nutrients · doi:10.3390/nu18122032
Dönmez, E., Okur, D. Ş., Özsoy, A. U., Şenol, H., & Yüksel, S. (2026) · Frontiers in Medicine · doi:10.3389/fmed.2026.1877706
Towards standardized gut microbiota diagnostics: normobiosis beyond geographical borders
Hiseni, P., Furu, K., Pedersen, V. W., Øverland, L., Kirubakaran, G. T., & Casèn, C. (2026) · Gut Microbes · doi:10.1080/19490976.2026.2701485
Diab, H., Yeo, L.-F., Salomaa, V. V., Havulinna, A. S., Lahti, L., Pärnänen, K. M. M., Knight, R. D., Palmu, J., & Niiranen, T. (2026) · Lara D. Veeken · doi:10.1093/rheumatology/keag371
Metadata
- Authors
- Klingberg, E., Magnusson, M. K., Strid, H., Deminger, A., Ståhl, A., Sundin, J., Simrén, M., Carlsten, H., Öhman, L., & Forsblad-d’Elia, H.
- Affiliations
- Sahlgrenska University Hospital (SE)
- University of Gothenburg (SE)
- Södra Älvsborg Hospital (SE)
- University of North Carolina at Chapel Hill (US)
- Corresponding author
- Klingberg, Eva
- ORCID
- Venue
- Arthritis Research & Therapy
- Published
- 2019-11-27
- Volume
- 21
- Issue
- 1
- Pages
- 248-248
- ISSN
- 1478-6354 (ISSN-L)
- 1478-6362
- PMC
- PMC6880506
- OpenAlex
- W2990319014
- Cited by
- 101
- References
- 52
- Citations by year
- 2026: 12 · 2025: 15 · 2024: 13 · 2023: 16 · 2022: 22 · 2021: 16 · 2020: 6
- FWCI
- 3.64
- Type
- journal article
- Language
- en
- Open access
- gold
- doi.org
- Locations
- Arthritis Research & Therapy (publishedVersion, cc-by)
- PubMed Central (publishedVersion, cc-by)
- PubMed (publishedVersion)
- DiVA at Umeå University (Umeå University) (submittedVersion, other-oa)
- DOAJ (DOAJ: Directory of Open Access Journals) (submittedVersion, cc-by-sa)
- Funders
- Swedish state under the agreement between the Swedish Government and the county councils, the ALF-agreement (ALFGBG-64220)
- The Swedish state under the agreement between the Swedish Government and the county councils, the ALF-agreement (ALFGBG-825511)
- Västra Götalandsregionen (VGFOUREG-383071)
- Rune och Ulla Amlövs Stiftelse för Neurologisk och Reumatologisk Forskning (.)
- Reumatikerdistriktet i Göteborg (.)
- Göteborgs Läkaresällskap (.)
- COMBINE (.)
- Stiftelsen Reuma Forskningsfond Margareta (.)
- Svenska Läkaresällskapet (SLS-409021)
- Topics
- Life Sciences › Biochemistry, Genetics and Molecular Biology › Molecular Biology › Gut microbiota and health
- Health Sciences › Medicine › Rheumatology › Spondyloarthritis Studies and Treatments
- Health Sciences › Medicine › Gastroenterology › Inflammatory Bowel Disease
- Keywords
- ankylosing spondylitis, gut microbiota, fecal calprotectin, dysbiosis, ulcerative colitis, inflammatory bowel disease, Proteobacteria, Enterobacteriaceae, Streptococcus, Faecalibacterium prausnitzii, Clostridium, Lachnospiraceae, Bacteroides, HLA-B27
- MeSH terms
- Gastrointestinal Microbiome, Adult, Bacteria, C-Reactive Protein, Colitis, Ulcerative, Feces, Female, Humans, Male, Middle Aged, Population Dynamics, Surveys and Questionnaires, Spondylitis, Ankylosing, Leukocyte L1 Antigen Complex, Young Adult, Dysbiosis
About these checks
Registry, retraction, Cites and statistics results are computed, not judged, with one exception: a printed reference that no index lists is read once by a model before it counts as a citation error. Claims are extracted by a model and kept only when their quote appears verbatim in the text; each cited source is then checked, with a model’s help, for whether it says what the claim relies on. Those verdicts can be wrong — read the claim’s quote and the cited source before relying on one.
Statistics and arithmetic are recomputed, not judged.
Confidence bands are shown only for fields calibrated on our annotated test set. None is calibrated yet, so no band is shown.
What counts as a claim ›How we measure confidence ›How we check this ›
Are you an author, or do you see a problem with this page? Request a review
