

The DOI matches its Crossref record; 30 of the 30 references it cites were found in a registry or an index.
Deep-learning based multi-modal models for brain age, cognition and amyloid pathology prediction
Open accessAbstract
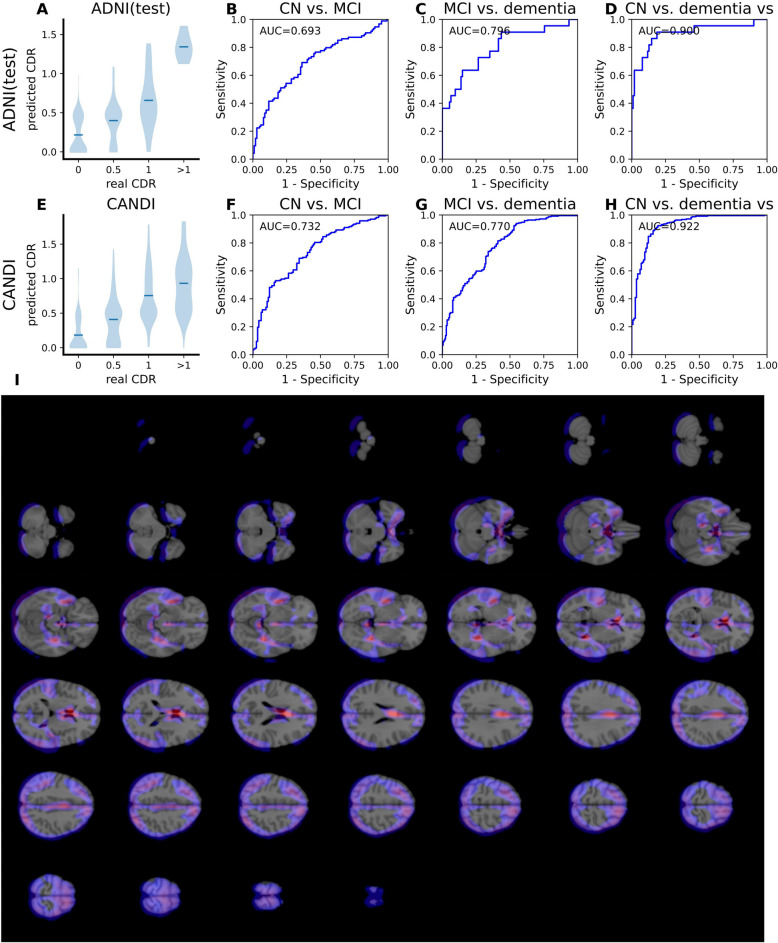
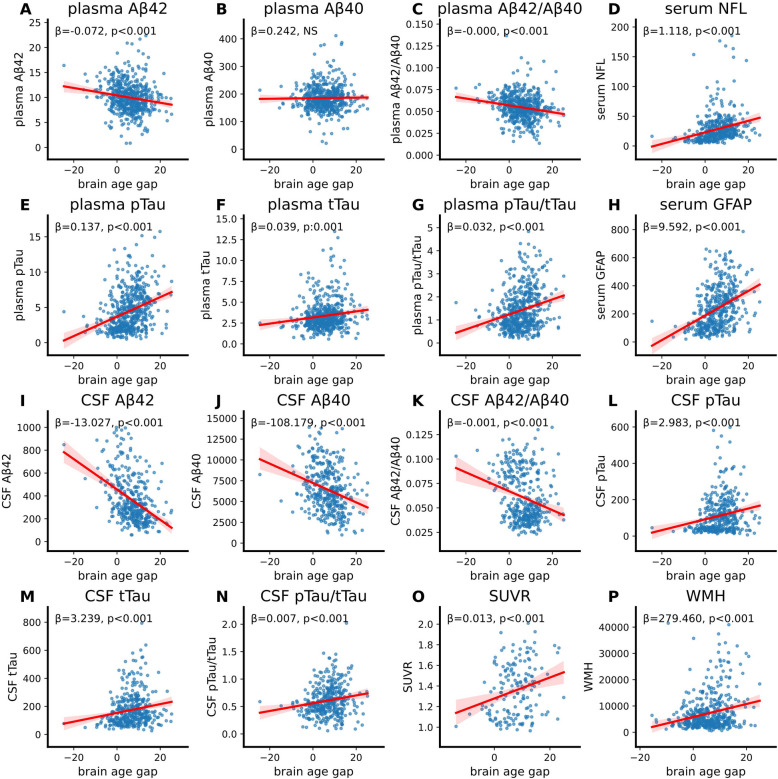
BACKGROUND: Magnetic resonance imaging (MRI), combined with artificial intelligence techniques, has improved our understanding of brain structural change and enabled the estimation of brain age. Neurodegenerative disorders, such as Alzheimer's disease (AD), have been linked to accelerated brain aging. In this study, we aimed to develop a deep-learning framework that processes and integrates MRI images to more accurately predict brain age, cognitive function, and amyloid pathology. METHODS: In this study, we aimed to develop a deep-learning framework that processes and integrates MRI images to more accurately predict brain age, cognitive function, and amyloid pathology.We collected over 10,000 T1-weighted MRI scans from more than 7,000 individuals across six cohorts. We designed a multi-modal deep-learning framework that employs 3D convolutional neural networks to analyze MRI and additional neural networks to evaluate demographic data. Our initial model focused on predicting brain age, serving as a foundational model from which we developed separate models for cognition function and amyloid plaque prediction through transfer learning. RESULTS: The brain age prediction model achieved the mean absolute error (MAE) for cognitive normal population in the ADNI (test) datasets of 3.302 years. The gap between predicted brain age and chronological age significantly increases while cognition declines. The cognition prediction model exhibited a root mean square error (RMSE) of 0.334 for the Clinical Dementia Rating (CDR) regression task, achieving an area under the curve (AUC) of approximately 0.95 in identifying ing dementia patients. Dementia related brain regions, such as the medial temporal lobe, were identified by our model. Finally, amyloid plaque prediction model was trained to predict amyloid plaque, and achieved an AUC about 0.8 for dementia patients. CONCLUSIONS: These findings indicate that the present predictive models can identify subtle changes in brain structure, enabling precise estimates of brain age, cognitive status, and amyloid pathology. Such models could facilitate the use of MRI as a non-invasive diagnostic tool for neurodegenerative diseases, including AD.
Overview
The claims and statistics of this paper haven’t been checked yet.
Free: it reads the open-access text and checks the first 5 claims that cite a source we can check. Create a free account to check every claim.
Integrity signals
Registry
Cites
Statistics
Figures



Verification
Claims the paper makes
The claims and statistics of this paper haven’t been checked yet.
Free: it reads the open-access text and checks the first 5 claims that cite a source we can check. Create a free account to check every claim.
Self-check
Percentages, sums and reported differences re-computed from the paper’s own numbers.
The self-check needs the paper’s full text.
Citations
Cites
Deep Residual Learning for Image Recognition
He, K., Zhang, X., Ren, S., & Sun, J. (2016) · 2016 IEEE Conference on Computer Vision and Pattern Recognition (CVPR) · doi:10.1109/cvpr.2016.90 · Cited by 235,474 · cited 1×
“Given the substantial computational requirements and parameter burden associated with linear projections for each patch, we implemented a 3D CNN with residual connection to extract the corresponding feature vector [18].”
Vaswani, A., Shazeer, N., Parmar, N., Uszkoreit, J., Jones, L., Gomez, A. N., Kaiser, L., & Polosukhin, I. (2017) · arXiv · doi:10.48550/arxiv.1706.03762 · Cited by 120,404 · cited 1×
“The transformer module is adept automatically ignoring any missing data and utilizing the available information for predictions, thereby more samples for training can enhance the generalization of the model [19].”
ImageNet classification with deep convolutional neural networks
Krizhevsky, A., Sutskever, I., & Hinton, G. E. (2017) · Communications of the ACM · doi:10.1145/3065386 · Cited by 112,155 · cited 1×
“Convolutional Neural Networks (CNN) is one of the most widely utilized deep learning algorithms in the field of computer vision [9].”
Gradient-based learning applied to document recognition
Lecun, Y., Bottou, L., Bengio, Y., & Haffner, P. (1998) · Proceedings of the IEEE · doi:10.1109/5.726791 · Cited by 58,805 · cited 1×
“The GradCAM algorithm was used to indicate which parts of the image have significant influence on the model’s predictions decision [23].”
An Image is Worth 16x16 Words: Transformers for Image Recognition at Scale
Dosovitskiy, A., Beyer, L., Kolesnikov, A., Weissenborn, D., Zhai, X., Unterthiner, T., Dehghani, M., Minderer, M., Heigold, G., Gelly, S., et al. (2020) · arXiv · doi:10.48550/arxiv.2010.11929 · Cited by 47,472 · cited 1×
“The raw T1-weighted MRI images were transformed into 3D images of size 192 × 192x192, which are subsequently segmented into patches measuring 6 × 6x6, each with dimensions of 32 × 32x32 [17].”
Reducing the dimensionality of data with neural networks
Hinton, G. E., & Salakhutdinov, R. R. (2006) · Science · doi:10.1126/science.1127647 · Cited by 20,928
Alzheimer's disease: the amyloid cascade hypothesis
Hardy, J. A., & Higgins, G. A. (1992) · Science · doi:10.1126/science.1566067 · Cited by 7,484 · cited 1×
“For instance, in individuals with Alzheimer’s disease (AD), the presence of amyloid-β (Aβ) and tau pathology could accelerate brain aging and result in accelerated brain atrophy and cognitive impairment in the elder [3-5].”
Terry, R. D., Masliah, E., Salmon, D. P., Butters, N., DeTeresa, R., Hill, R., Hansen, L. A., & Katzman, R. (1991) · Annals of Neurology · doi:10.1002/ana.410300410 · Cited by 4,397 · cited 1×
“Concurrently, age-related risk factors and diseases, such as neurodegenerative disorders, can inflict abnormal damage on the brain, contributing to atypical aging patterns [2].”
Alzheimer Disease: An Update on Pathobiology and Treatment Strategies
Long, J. M., & Holtzman, D. M. (2019) · Cell · doi:10.1016/j.cell.2019.09.001 · Cited by 3,204
Revised criteria for diagnosis and staging of Alzheimer's disease: Alzheimer's Association Workgroup
Jack, C. R., Andrews, J. S., Beach, T. G., Buracchio, T., Dunn, B., Graf, A., Hansson, O., Ho, C., Jagust, W., McDade, E., et al. (2024) · Alzheimer's & Dementia · doi:10.1002/alz.13859 · Cited by 2,803 · cited 1×
“For instance, in individuals with Alzheimer’s disease (AD), the presence of amyloid-β (Aβ) and tau pathology could accelerate brain aging and result in accelerated brain atrophy and cognitive impairment in the elder [3-5].”
Research works printed but not linked: 2
- Lee J, Burkett BJ, Min H-K, Senjem ML, Lundt ES, Botha H, et al. Deep learning-based brain age prediction in normal aging and dementia. Nature Aging. 2022;2:412–24. · DOI · Paper page
- Bashyam VM, Erus G, Doshi J, Habes M, Nasrallah IM, Truelove-Hill M, et al. MRI signatures of brain age and disease over the lifespan based on a deep brain network and 14 468 individuals worldwide. Brain. 2020;143:2312–24. · DOI · Paper page
Cited by
Li, X., Yang, F., Zhang, Y., Yang, Z., Chen, R., Zhou, M., & Yang, L. (2025) · Briefings in Bioinformatics · doi:10.1093/bib/bbaf284 · Cited by 7
AI-driven insights into protein misfolding and innate immunity in neurodegenerative diseases
Deng, H. X., Cao, J. L., Yao, W., Jiang, S. J., Fang, Q. Q., Zhu, B. Y., & Jiang, Y. J. (2026) · Frontiers in Immunology · doi:10.3389/fimmu.2026.1814357 · Cited by 2
“The use of multimodal models, such as deep learning-based approaches, for predicting brain age, cognition, and amyloid pathology (243) provides an important methodological extension for our AI diagnostic systems based on proteomics.”
Wang, Y., Miao, M., Wang, Q., Yin, Y., Zhao, H., Zhao, S., Yang, H., & WANG, X. (2026) · Drugs & Aging · doi:10.1007/s40266-026-01288-8 · Cited by 1
Self-citationADD-Net-MRI: An Explainable Deep Learning Approach for Early Alzheimer’s Detection
Mahesh Kumar, M., Harshitha, T., Kumar, D. B., Praveen, A., Poojitha, G., & Jaswanth, K. (2026) · International Conference on Knowledge Engineering and Communication Systems (ICKECS) · doi:10.1109/ickecs70176.2026.11527841 · Cited by 1
Mabasha, S., Gupta, S., & Babu, K. K. (2026) · International Journal of Computers and Applications · doi:10.1080/1206212x.2026.2690510 · Cited by 1
“At the same time, Wang et al. [22] presented the prediction of brain age, cognitive state, and amyloid load all in one go by employing the Transformer architecture in conjunction with MRI representations as well as clinical and genetic data in a multi-modal framework.”
Influential
Metadata
- Authors
- Wang, C., Zhang, W., Ni, M., Wang, Q., Liu, C., Dai, L., Zhang, M., Shen, Y., & Gao, F.
- Affiliations
- University of Science and Technology of China (CN)
- Corresponding author
- Shen, Yong
- Gao, Feng
- Venue
- Alzheimer's Research & Therapy
- Published
- 2025-05-31
- Volume
- 17
- Issue
- 1
- Pages
- 126-126
- ISSN
- 1758-9193 (ISSN-L)
- PMC
- PMC12125894
- OpenAlex
- W4410921897
- Cited by
- 11
- References
- 30
- Citations by year
- 2026: 10 · 2025: 1
- FWCI
- 7.40
- Type
- journal article
- Language
- en
- Open access
- gold
- doi.org
- Licence
- cc-by-nc-nd
- creativecommons.org/licenses/by-nc-nd/4.0 (tdm)
- creativecommons.org/licenses/by-nc-nd/4.0 (vor)
- Locations
- Alzheimer s Research & Therapy (publishedVersion, cc-by-nc-nd)
- PubMed Central (publishedVersion, cc-by-nc-nd)
- PubMed (publishedVersion)
- DOAJ (DOAJ: Directory of Open Access Journals) (submittedVersion, cc-by-sa)
- Funders
- Chinese Academy of Sciences (XDB 39000000, 32121002)
- University of Science and Technology of China
- Topics
- Health Sciences › Medicine › Psychiatry and Mental health › Dementia and Cognitive Impairment Research
- Life Sciences › Neuroscience › Cognitive Neuroscience › Functional Brain Connectivity Studies
- Health Sciences › Medicine › Radiology, Nuclear Medicine and Imaging › Advanced MRI Techniques and Applications
- Keywords
- brain age prediction, cognitive function prediction, Alzheimer's disease, accelerated brain aging, T1-weighted imaging, multimodal deep learning, 3D convolutional neural networks, transfer learning, dementia detection, Clinical Dementia Rating, medial temporal lobe, neurodegenerative disease diagnosis
- MeSH terms
- Deep Learning, Aged, Aged, 80 and over, Aging, Alzheimer Disease, Brain, Cognition, Female, Humans, Magnetic Resonance Imaging, Male, Middle Aged, Neural Networks, Computer, Plaque, Amyloid
About these checks
Registry, retraction, Cites and statistics results are computed, not judged, with one exception: a printed reference that no index lists is read once by a model before it counts as a citation error. Claims are extracted by a model and kept only when their quote appears verbatim in the text; each cited source is then checked, with a model’s help, for whether it says what the claim relies on. Those verdicts can be wrong — read the claim’s quote and the cited source before relying on one.
Statistics and arithmetic are recomputed, not judged.
Confidence bands are shown only for fields calibrated on our annotated test set. None is calibrated yet, so no band is shown.
What counts as a claim ›How we measure confidence ›How we check this ›
Are you an author, or do you see a problem with this page? Request a review
How to cite
Cite CoChat for the checks on this page, and the paper for its own findings.
- This page
- CoChat. (2026). Citation check: Deep-learning based multi-modal models for brain age, cognition and amyloid pathology prediction. https://app.cochat.ai/papers/10.1186/s13195-025-01773-z
- The paper
- Wang, C., Zhang, W., Ni, M., Wang, Q., Liu, C., Dai, L., Zhang, M., Shen, Y., & Gao, F. (2025). Deep-learning based multi-modal models for brain age, cognition and amyloid pathology prediction. Alzheimer's Research & Therapy. https://doi.org/10.1186/s13195-025-01773-z
Data sources
Bibliographic data: Semantic Scholar, OpenAlex, Crossref.
Contains information from the Semantic Scholar Academic Graph Datasets, made available under the ODC Attribution License (ODC-BY 1.0).
Semantic Scholar’s data is described in: Kinney, R., et al. (2023). The Semantic Scholar Open Data Platform. arXiv:2301.10140.
