

The DOI matches its Crossref record; 64 of the 64 references it cites were found in a registry or an index.
Mesenchymal stem cells and extracellular matrix scaffold promote muscle regeneration by synergistically regulating macrophage polarization toward the M2 phenotype
Open accessAbstract
BACKGROUND: Skeletal muscle plays an important role in the body's physiology but there are still no effective treatments for volumetric muscle loss (VML) resulting from severe traumatic injury or tumor excision. Recent studies show that a tissue engineering strategy using a compound containing mesenchymal stem cells (MSCs) and decellularized extracellular matrix (ECM) scaffold generates significant regenerative effects on VML injury, but the underlying mechanisms are not fully understood. METHODS: The characteristics of human umbilical cord MSCs, including multiplication capacity and multidifferentiation ability, were determined. We constructed a compound containing MSCs and decellularized ECM scaffold which was used for tissue regeneration in a VML model. RESULTS: We found that MSCs and decellularized ECM scaffold generated synergistic effects on promoting skeletal muscle tissue regeneration. Interestingly, both MSCs and decellularized ECM scaffold could promote macrophage polarization toward the M2 phenotype and suppress macrophage polarization toward the M1 phenotype, which is widely regarded as an important promoting factor in tissue regeneration. More importantly, MSCs and decellularized ECM scaffold generate synergistic promoting effects on macrophage polarization toward the M2 phenotype, not just an additive effect. CONCLUSIONS: Our findings uncover a previously unknown mechanism that MSCs and decellularized ECM scaffold promote tissue regeneration via collaboratively regulating macrophage polarization.
Overview
The claims and statistics of this paper haven’t been checked yet.
Run the check — free, no account needed. It reads the open-access text and checks the sources it cites.
Integrity signals
Registry
Cites
Statistics
Figures
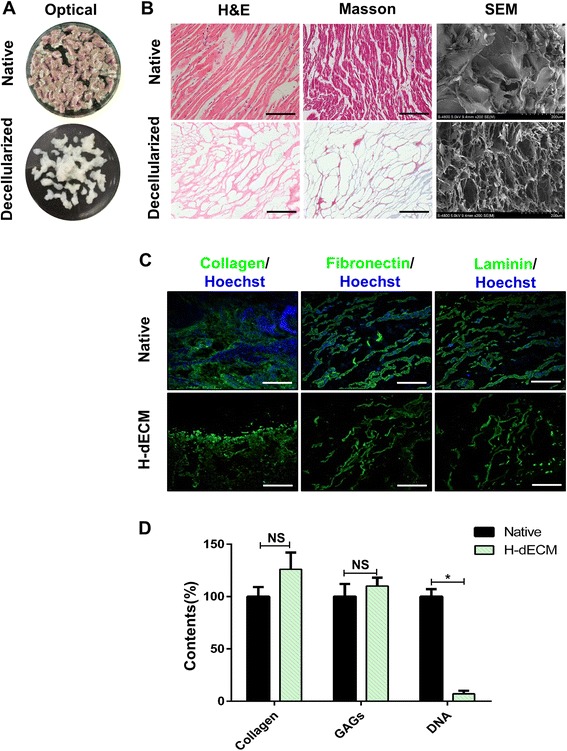
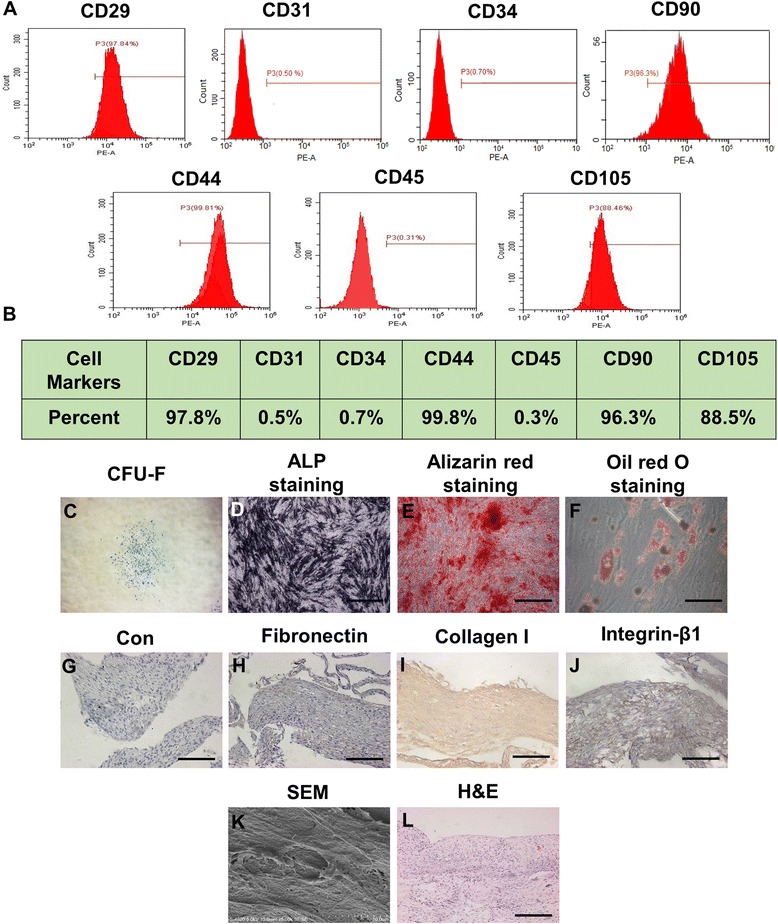
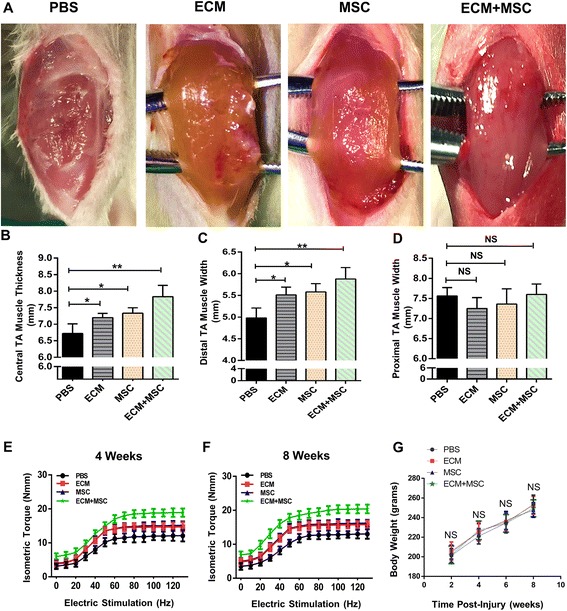
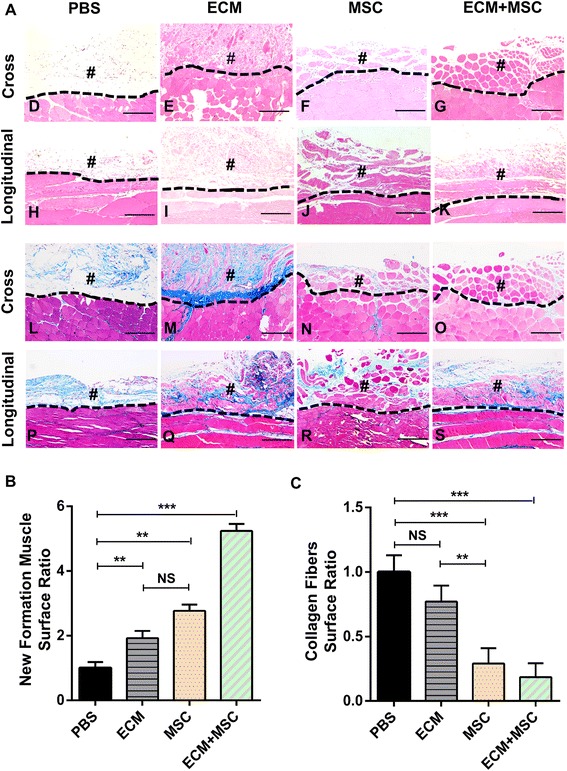
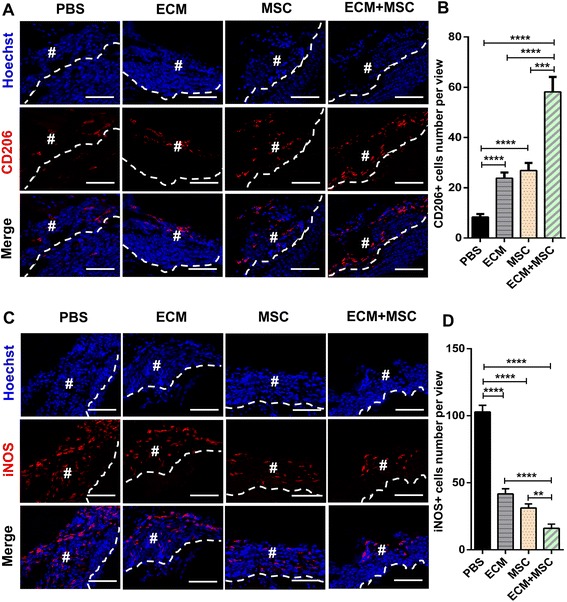
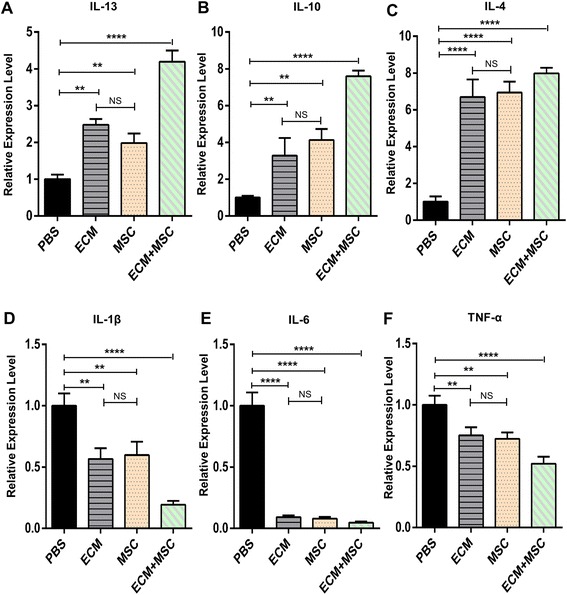
Verification
Claims the paper makes
The claims and statistics of this paper haven’t been checked yet.
Run the check — free, no account needed. It reads the open-access text and checks the sources it cites.
Claims other papers make about this one
Each is checked against this paper’s own text: does it say what the citing paper says it does?
The source backs part of the claim, not all of it — or backs it for a different population, condition or comparison.
In the citing paper
“Several physical factors of ECMs have been evidenced to influence macrophages polarization and determine the outcomes of wound healing and tissue remodeling, including stiffness, topography and so on [[27], [28], [29]].”
From Substrate stiffness modulates bone marrow-derived macrophage polarization through NF-κB signaling pathway (2020) · cites this paper as [29]
Experimental — accuracy not yet measured
Self-check
Percentages, sums and reported differences re-computed from the paper’s own numbers.
The self-check needs the paper’s full text.
Citations
Cites
Macrophage plasticity and polarization: in vivo veritas
Sica, A., & Mantovani, A. (2012) · Journal of Clinical Investigation · doi:10.1172/jci59643 · Cited by 6,335
The extracellular matrix at a glance
Frantz, C., Stewart, K. M., & Weaver, V. M. (2010) · Journal of Cell Science · doi:10.1242/jcs.023820 · Cited by 4,334
An overview of tissue and whole organ decellularization processes
Crapo, P. M., Gilbert, T. W., & Badylak, S. F. (2011) · Biomaterials · doi:10.1016/j.biomaterials.2011.01.057 · Cited by 3,591
Extracellular matrix structure
Theocharis, A. D., Skandalis, S. S., Gialeli, C., & Karamanos, N. K. (2016) · Advanced Drug Delivery Reviews · doi:10.1016/j.addr.2015.11.001 · Cited by 2,598
Human Mesenchymal Stem Cells Differentiate to a Cardiomyocyte Phenotype in the Adult Murine Heart
Toma, C., Pittenger, M. F., Cahill, K. S., Byrne, B. J., & Kessler, P. (2002) · Circulation · doi:10.1161/hc0102.101442 · Cited by 2,234
Regulatory interactions between muscle and the immune system during muscle regeneration
Tidball, J. G., & Villalta, S. A. (2010) · American Journal of Physiology-Regulatory, Integrative and Comparative Physiology · doi:10.1152/ajpregu.00735.2009 · Cited by 1,105
Multipotent mesenchymal stromal cells and the innate immune system
Blanc, K. L., & Mougiakakos, D. (2012) · Nature reviews. Immunology · doi:10.1038/nri3209 · Cited by 1,042
Macrophages in skin injury and repair
Delavary, B. M., van der Veer, W. M., van Egmond, M., Niessen, F. B., & Beelen, R. H. J. (2011) · Immunobiology · doi:10.1016/j.imbio.2011.01.001 · Cited by 838
HucMSC-Exosome Mediated-Wnt4 Signaling Is Required for Cutaneous Wound Healing
Zhang, B., Wang, M., Gong, A., Zhang, X., Wu, X., Zhu, Y., Shi, H., Wu, L., Zhu, W., Qian, H., et al. (2014) · Stem Cells · doi:10.1002/stem.1771 · Cited by 818
Self-citationZhang, J., Guan, J., Niu, X., Hu, G., Guo, S., Li, Q., Xie, Z., Zhang, C., & Wang, Y. (2015) · Journal of Translational Medicine · doi:10.1186/s12967-015-0417-0 · Cited by 804
Cited by
Sorted by citations
Items 101–111 of 111
Wu, Y., Xu, J., Sun, X.-H., Jiang, H., Zhou, H., Liu, Q., Cong, X., Wu, Y., & Lin, Z. (2024) · Research Square · doi:10.21203/rs.3.rs-4352075/v1 · Cited by 1
Liu, M., Wang, X., Zhou, H., Yang, X., Chen, G., Yang, P., & Song, A. (2025) · Cell Biology International · doi:10.1002/cbin.70104 · Cited by 1
He, D., Liu, F., Cui, S., Jiang, N., Yu, H., Zhou, Y., Liu, Y., & Kou, X. (2020) · Figshare · doi:10.6084/m9.figshare.11984853
He, D., Liu, F., Cui, S., Jiang, N., Yu, H., Zhou, Y., Liu, Y., & Kou, X. (2020) · Figshare · doi:10.6084/m9.figshare.11984865
He, D., Liu, F., Cui, S., Jiang, N., Yu, H., Zhou, Y., Liu, Y., & Kou, X. (2020) · Figshare · doi:10.6084/m9.figshare.11984880
He, D., Liu, F., Cui, S., Jiang, N., Yu, H., Zhou, Y., Liu, Y., & Kou, X. (2020) · Figshare · doi:10.6084/m9.figshare.11984871
He, D., Liu, F., Cui, S., Jiang, N., Yu, H., Zhou, Y., Liu, Y., & Kou, X. (2020) · Figshare · doi:10.6084/m9.figshare.11984859
Lai, S., Xia, X., & Mu, Y. (2026) · Journal of Translational Medicine · doi:10.1186/s12967-026-08613-0
Abraham, M., Kori, I., Anusha, P. V., Fathima, I., Idris, M. M., & Goel, S. (2026) · Journal of Tissue Engineering · doi:10.1177/20417314261473533
Scaffold integration: extracellular matrices and cellular interfaces
Purohit, S. D., Fahmy, M. J., Mobin, A., Hashem, Z., & Corridon, P. R. (2026) · Elsevier eBooks · doi:10.1016/b978-0-443-33455-9.00011-0
Zăvoi, A., Ablassmaier, T. A., Pop, B., Muresan, S. M. C., Negoescu, A. G., Lucaci, F. D., Purdoiu, R. C., Feraru, A., Magyari, K., Bel, L. V., et al. (2026) · Veterinary Research Communications · doi:10.1007/s11259-026-11557-x
Metadata
- Authors
- Qiu, X., Liu, S., Zhang, H., Zhu, B., Su, Y., Zheng, C., Tian, R., Wang, M., Kuang, H., Zhao, X., & Jin, Y.
- Affiliations
- Air Force Medical University (CN)
- Chinese People's Liberation Army (CN)
- Corresponding author
- Zhao, Xinyi
- Jin, Yan
- Venue
- Stem Cell Research & Therapy
- Published
- 2018-04-03
- Volume
- 9
- Issue
- 1
- Pages
- 88-88
- ISSN
- 1757-6512 (ISSN-L)
- PMC
- PMC5883419
- OpenAlex
- W2800380986
- Cited by
- 111
- References
- 64
- Citations by year
- 2026: 5 · 2025: 12 · 2024: 13 · 2023: 7 · 2022: 17 · 2021: 17 · 2020: 21 · 2019: 13 · 2018: 6
- FWCI
- 14.81
- Type
- journal article
- Language
- en
- Open access
- gold
- doi.org
- Licence
- Locations
- Stem Cell Research & Therapy (publishedVersion, cc-by)
- PubMed Central (publishedVersion, cc-by)
- PubMed (publishedVersion)
- DOAJ (DOAJ: Directory of Open Access Journals) (submittedVersion, cc-by-sa)
- Funders
- National Natural Science Foundation of China (31670995, 81470679)
- National Key Research and Development Program of China (2016YFC1101400, 2016TFC1102903)
- Topics
- Health Sciences › Medicine › Surgery › Tissue Engineering and Regenerative Medicine
- Life Sciences › Biochemistry, Genetics and Molecular Biology › Cell Biology › Mesenchymal stem cell research
- Life Sciences › Biochemistry, Genetics and Molecular Biology › Molecular Biology › Muscle Physiology and Disorders
- Keywords
- mesenchymal stem cells, skeletal muscle regeneration, volumetric muscle loss, macrophage polarization, M2 macrophages, M1 macrophages, human umbilical cord mesenchymal stem cells, synergistic effect, tissue engineering, traumatic muscle injury
- MeSH terms
- Animals, Cell Differentiation, Cells, Cultured, Extracellular Matrix, Humans, Macrophages, Regeneration, Rats, Sprague-Dawley, Muscle, Skeletal, Mesenchymal Stem Cell Transplantation, Rats, Mesenchymal Stem Cells
About these checks
Registry, retraction, Cites and statistics results are computed, not judged, with one exception: a printed reference that no index lists is read once by a model before it counts as a citation error. Claims are extracted by a model and kept only when their quote appears verbatim in the text; each cited source is then checked, with a model’s help, for whether it says what the claim relies on. Those verdicts can be wrong — read the claim’s quote and the cited source before relying on one.
Statistics and arithmetic are recomputed, not judged.
Confidence bands are shown only for fields calibrated on our annotated test set. None is calibrated yet, so no band is shown.
What counts as a claim ›How we measure confidence ›How we check this ›
Are you an author, or do you see a problem with this page? Request a review
