

The DOI matches its Crossref record; 24 of the 25 references it cites were found in a registry or an index.
Deriving accurate microbiota profiles from human samples with low bacterial content through post-sequencing processing of Illumina MiSeq data
Open accessAbstract
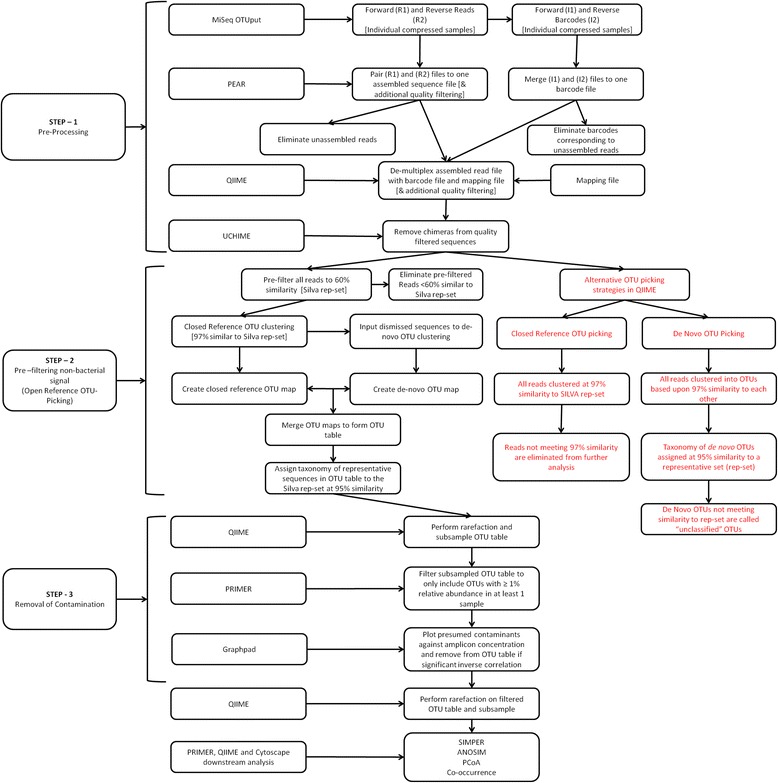
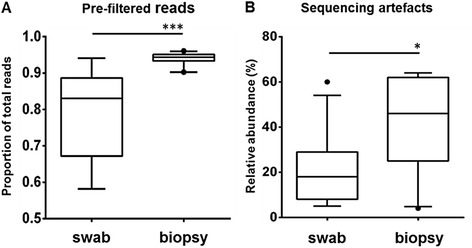
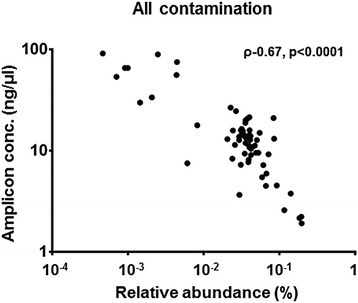
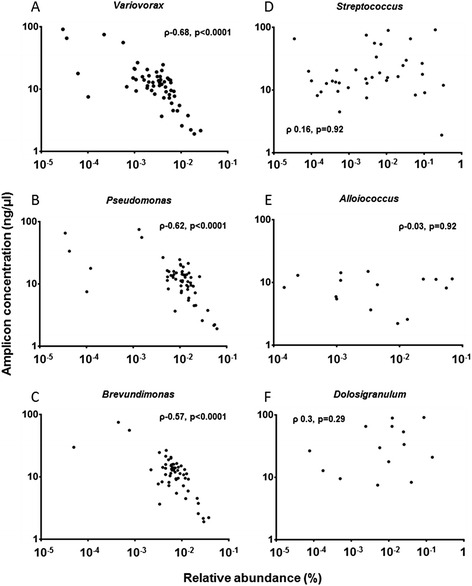
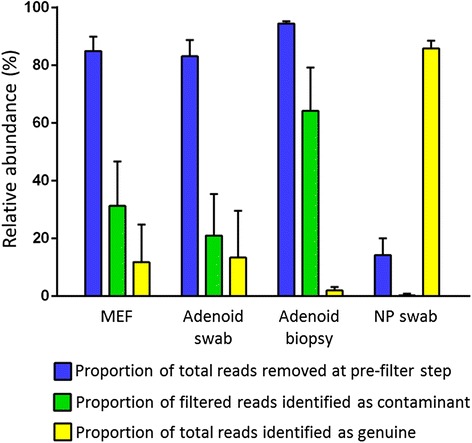
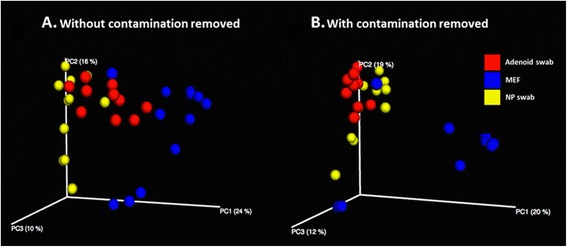
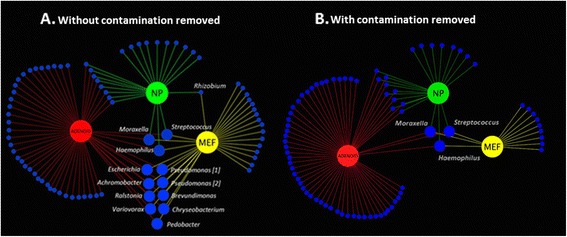
BACKGROUND: The rapid expansion of 16S rRNA gene sequencing in challenging clinical contexts has resulted in a growing body of literature of variable quality. To a large extent, this is due to a failure to address spurious signal that is characteristic of samples with low levels of bacteria and high levels of non-bacterial DNA. We have developed a workflow based on the paired-end read Illumina MiSeq-based approach, which enables significant improvement in data quality, post-sequencing. We demonstrate the efficacy of this methodology through its application to paediatric upper-respiratory samples from several anatomical sites. RESULTS: A workflow for processing sequence data was developed based on commonly available tools. Data generated from different sample types showed a marked variation in levels of non-bacterial signal and 'contaminant' bacterial reads. Significant differences in the ability of reference databases to accurately assign identity to operational taxonomic units (OTU) were observed. Three OTU-picking strategies were trialled as follows: de novo, open-reference and closed-reference, with open-reference performing substantially better. Relative abundance of OTUs identified as potential reagent contamination showed a strong inverse correlation with amplicon concentration allowing their objective removal. The removal of the spurious signal showed the greatest improvement in sample types typically containing low levels of bacteria and high levels of human DNA. A substantial impact of pre-filtering data and spurious signal removal was demonstrated by principal coordinate and co-occurrence analysis. For example, analysis of taxon co-occurrence in adenoid swab and middle ear fluid samples indicated that failure to remove the spurious signal resulted in the inclusion of six out of eleven bacterial genera that accounted for 80% of similarity between the sample types. CONCLUSIONS: The application of the presented workflow to a set of challenging clinical samples demonstrates its utility in removing the spurious signal from the dataset, allowing clinical insight to be derived from what would otherwise be highly misleading output. While other approaches could potentially achieve similar improvements, the methodology employed here represents an accessible means to exclude the signal from contamination and other artefacts.
Overview
The claims and statistics of this paper haven’t been checked yet.
Run the check — free, no account needed. It reads the open-access text and checks the sources it cites.
Integrity signals
Registry
Cites
Statistics
Figures
Verification
Claims the paper makes
The claims and statistics of this paper haven’t been checked yet.
Run the check — free, no account needed. It reads the open-access text and checks the sources it cites.
Claims other papers make about this one
Each is checked against this paper’s own text: does it say what the citing paper says it does?
In the citing paper
“Additional putative external contamination was identified on the basis that sequences from contaminants generally have frequencies that are inversely correlated with sample analyte concentration16,38.”
From RETRACTED ARTICLE: Microbiome analyses of blood and tissues suggest cancer diagnostic approach (2020) · cites this paper as [38]
In the citing paper
“As an additional quality control step, all OTUs were tested for correlations between the proportional abundance of the OTU and the post-PCR amplicon concentration of a sample using the method developed by Jervis-Brady et al. [90] as implemented in the contam_test program for R (https://github.com/eclarke/eclectic).”
From Population structure of human gut bacteria in a diverse cohort from rural Tanzania and Botswana (2019) · cites this paper as [90]
Self-check
Percentages, sums and reported differences re-computed from the paper’s own numbers.
The self-check needs the paper’s full text.
Citations
Cites
Cytoscape: A software Environment for integrated models of biomolecular interaction networks
Shannon, P., Markiel, A., Ozier, O., Baliga, N. S., Wang, J. T., Ramage, D., Amin, N., Schwikowski, B., & Ideker, T. (2003) · Genome Research · doi:10.1101/gr.1239303 · Cited by 51,888 · cited 1×
“2 [26] was used to create a co-occurrence model.”
MethodQIIME allows analysis of high-throughput community sequencing data
Caporaso, J. G., Kuczynski, J., Stombaugh, J., Bittinger, K., Bushman, F. D., Costello, E. K., Fierer, N., Peña, A. G., Goodrich, J. K., Gordon, J. I., et al. (2010) · Nature Methods · doi:10.1038/nmeth.f.303 · Cited by 34,887 · cited 12×
“Keywords: 16S rRNA, Respiratory, MiSeq, Contamination, Pair-end reads, QIIME, Otitis media * Correspondence: jakejervisbardy@hotmail.com †Equal contributors 1Menzies School of Health Research, Child Health Division, Charles Darwin University, Darwin, NT, Australia 2School of Medicine, Flinders University, Bedford Park…”
MethodInfluentialThe SILVA ribosomal RNA gene database project: improved data processing and web-based tools
Quast, C., Pruesse, E., Yilmaz, P., Gerken, J., Schweer, T., Yarza, P., Peplies, J., & Glöckner, F. O. (2012) · Nucleic Acids Research · doi:10.1093/nar/gks1219 · Cited by 33,055 · cited 2×
“8) [9] and SILVA (v111) [10], to assign identities to OTUs generated from a multi-template control comprised of known species at defined relative abundance.”
BackgroundMethodSearch and clustering orders of magnitude faster than BLAST
Edgar, R. C. (2010) · Bioinformatics · doi:10.1093/bioinformatics/btq461 · Cited by 21,098
Schloss, P. D., Westcott, S. L., Ryabin, T., Hall, J. R., Hartmann, M., Hollister, E. B., Lesniewski, R. A., Oakley, B. B., Parks, D. H., Robinson, C. J., et al. (2009) · Applied and Environmental Microbiology · doi:10.1128/aem.01541-09 · Cited by 19,549
UCHIME improves sensitivity and speed of chimera detection
Edgar, R. C., Haas, B. J., Clemente, J. C., Quince, C., & Knight, R. (2011) · Bioinformatics · doi:10.1093/bioinformatics/btr381 · Cited by 15,114
McDonald, D. T., Price, M. N., Goodrich, J. K., Nawrocki, E. P., DeSantis, T. Z., Probst, A. J., Andersen, G. L., Knight, R. D., & Hugenholtz, P. (2011) · The ISME Journal · doi:10.1038/ismej.2011.139 · Cited by 5,144 · cited 1×
“8) [9] and SILVA (v111) [10], to assign identities to OTUs generated from a multi-template control comprised of known species at defined relative abundance.”
BackgroundKraken: ultrafast metagenomic sequence classification using exact alignments
Wood, D. E., & Salzberg, S. L. (2014) · Genome Biology · doi:10.1186/gb-2014-15-3-r46 · Cited by 4,521 · cited 7×
“We note there are a variety of stand-alone methods available to eliminate this type of non-bacterial signal, such as DeconSeq [12], Kraken [11] and FastQ Screen (Babraham Bioinformatics, Babraham Institute, UK).”
MethodInfluentialPEAR: a fast and accurate Illumina Paired-End reAd mergeR
Zhang, J., Kobert, K., Flouri, T., & Stamatakis, A. (2014) · Bioinformatics · doi:10.1093/bioinformatics/btt593 · Cited by 4,497 · cited 2×
“5 [18] was used to pair the forward and reverse reads of sequences in each sample and discard all sequences less than 450 bp and/or with a Phred score <33.”
MethodReagent and laboratory contamination can critically impact sequence-based microbiome analyses
Salter, S. J., Cox, M. J., Turek, E. M., Calus, S. T., Cookson, W. O., Moffatt, M. F., Turner, P., Parkhill, J., Loman, N. J., & Walker, A. W. (2014) · BMC Biology · doi:10.1186/s12915-014-0087-z · Cited by 3,463 · cited 5×
“Such a spurious signal can substantially distort community profiles from samples with low bacterial load [4-6].”
BackgroundInfluential
Research works printed but not linked: 2
- The National Center for Biotechnology Information Sequence Read Archive. http://www.ncbi.nlm.nih.gov/sra/ (accessed 011014)
- The National Center for Biotechnology Information Basic Local Alignment Search Tool. http://blast.ncbi.nlm.nih.gov/Blast.cgi (accessed 011014)
Cited by
Sorted by citations
Davis, N. M., Proctor, D. M., Holmes, S. P., Relman, D. A., & Callahan, B. J. (2018) · Microbiome · doi:10.1186/s40168-018-0605-2 · Cited by 3,493
Contamination in Low Microbial Biomass Microbiome Studies: Issues and Recommendations
Eisenhofer, R., Minich, J. J., Marotz, C., Cooper, A., Knight, R., & Weyrich, L. S. (2019) · Trends in Microbiology · doi:10.1016/j.tim.2018.11.003 · Cited by 1,146
RETRACTED ARTICLE: Microbiome analyses of blood and tissues suggest cancer diagnostic approach
Poore, G. D., Kopylova, E., Zhu, Q., Carpenter, C., Fraraccio, S., Wandro, S., Kosciolek, T., Janssen, S., Metcalf, J., Song, S. J., et al. (2020) · Nature · doi:10.1038/s41586-020-2095-1 · Cited by 989
RetractedTumor-resident intracellular microbiota promotes metastatic colonization in breast cancer
Fu, A., Yao, B., Dong, T., Chen, Y., Yao, J., Liu, Y., Li, H., Bai, H., Liu, X., Zhang, Y., et al. (2022) · Cell · doi:10.1016/j.cell.2022.02.027 · Cited by 981
Human placenta has no microbiome but can contain potential pathogens
de Goffau, M. C., Lager, S., Sovio, U., Gaccioli, F., Cook, E., Peacock, S. J., Parkhill, J., Charnock-Jones, D. S., & Smith, G. C. S. (2019) · Nature · doi:10.1038/s41586-019-1451-5 · Cited by 691
Metadata
- Authors
- Jervis-Bardy, J., Leong, L. E. X., Marri, S., Smith, R. J., Choo, J. M., Smith-Vaughan, H. C., Nosworthy, E., Morris, P. S., O’Leary, S., Rogers, G. B., & Marsh, R. L.
- Affiliations
- Flinders University (AU)
- South Australian Health and Medical Research Institute (AU)
- Charles Darwin University (AU)
- The University of Melbourne (AU)
- Corresponding author
- Jervis-Bardy, Jake
- ORCID
- Venue
- Microbiome
- Published
- 2015-05-05
- Volume
- 3
- Issue
- 1
- Pages
- 19-19
- ISSN
- 2049-2618 (ISSN-L)
- PMC
- PMC4428251
- OpenAlex
- W2063276097
- Cited by
- 192
- References
- 25
- Citations by year
- 2026: 3 · 2025: 6 · 2024: 10 · 2023: 20 · 2022: 14 · 2021: 23 · 2020: 25 · 2019: 27 · 2018: 23 · 2017: 20 · 2016: 18 · 2015: 3
- FWCI
- 9.27
- Type
- journal article
- Language
- en
- Open access
- gold
- doi.org
- Locations
- Microbiome (publishedVersion, cc-by)
- Europe PMC (PubMed Central) (publishedVersion, cc-by)
- PubMed Central (publishedVersion, cc-by)
- PubMed (publishedVersion)
- Minerva Access (University of Melbourne) (submittedVersion, cc-by)
- Adelaide Research & Scholarship (AR&S) (University of Adelaide) (submittedVersion, cc-by)
- Griffith Research Online (submittedVersion, cc-by)
- Funders
- Medical Research Council
- National Health and Medical Research Council (1007641)
- Topics
- Life Sciences › Biochemistry, Genetics and Molecular Biology › Molecular Biology › Genomics and Phylogenetic Studies
- Life Sciences › Biochemistry, Genetics and Molecular Biology › Molecular Biology › Gut microbiota and health
- Physical Sciences › Environmental Science › Ecology › Microbial Community Ecology and Physiology
- Keywords
- 16S rRNA gene sequencing, microbiota profiling, reagent contamination, operational taxonomic units, paired-end reads, middle ear fluid, reference database
About these checks
Registry, retraction, Cites and statistics results are computed, not judged, with one exception: a printed reference that no index lists is read once by a model before it counts as a citation error. Claims are extracted by a model and kept only when their quote appears verbatim in the text; each cited source is then checked, with a model’s help, for whether it says what the claim relies on. Those verdicts can be wrong — read the claim’s quote and the cited source before relying on one.
Statistics and arithmetic are recomputed, not judged.
Confidence bands are shown only for fields calibrated on our annotated test set. None is calibrated yet, so no band is shown.
What counts as a claim ›How we measure confidence ›How we check this ›
Are you an author, or do you see a problem with this page? Request a review
