

The DOI matches its Crossref record; 32 of the 32 references it cites were found in a registry or an index; none of the 31 sources its claims cite is checked for support yet.
Uncovering the trimethylamine-producing bacteria of the human gut microbiota
Open accessAbstract
BACKGROUND: Trimethylamine (TMA), produced by the gut microbiota from dietary quaternary amines (mainly choline and carnitine), is associated with atherosclerosis and severe cardiovascular disease. Currently, little information on the composition of TMA producers in the gut is available due to their low abundance and the requirement of specific functional-based detection methods as many taxa show disparate abilities to produce that compound. RESULTS: In order to examine the TMA-forming potential of microbial communities, we established databases for the key genes of the main TMA-synthesis pathways, encoding choline TMA-lyase (cutC) and carnitine oxygenase (cntA), using a multi-level screening approach on 67,134 genomes revealing 1107 and 6738 candidates to exhibit cutC and cntA, respectively. Gene-targeted assays enumerating the TMA-producing community by quantitative PCR and characterizing its composition via Illumina sequencing were developed and applied on human fecal samples (n = 50) where all samples contained potential TMA producers (cutC was detected in all individuals, whereas only 26% harbored cntA) constituting, however, only a minor part of the total community (below 1% in most samples). Obtained cutC amplicons were associated with various taxa, in particular with Clostridium XIVa strains and Eubacterium sp. strain AB3007, though a bulk of sequences displayed low nucleotide identities to references (average 86% ± 7%) indicating that key human TMA producers are yet to be isolated. Co-occurrence analysis revealed specific groups governing the community structure of cutC-exhibiting taxa across samples. CntA amplicons displayed high identities (~99%) to Gammaproteobacteria-derived references, primarily from Escherichia coli. Metagenomic analysis of samples provided by the Human Microbiome Project (n = 154) confirmed the abundance patterns as well as overall taxonomic compositions obtained with our assays, though at much lower resolution, whereas 16S ribosomal RNA gene sequence analysis could not adequately uncover the TMA-producing potential. CONCLUSIONS: In this study, we developed a diagnostic framework that enabled the quantification and comprehensive characterization of the TMA-producing potential in human fecal samples. The key players were identified, and together with predictions on their environmental niches using functional genomics on most closely related reference strains, we provide crucial information for the development of specific treatment strategies to restrain TMA producers and limit their proliferation.
Overview
AI snapshot
Written from the paper’s full text.
TL;DR
The paper builds databases and gene-targeted qPCR/sequencing assays for the gut microbial trimethylamine (TMA)-synthesis genes cutC and cntA, then applies them to human fecal samples. It finds that potential TMA producers are common but low-abundance, with cutC dominated by diverse Clostridium XIVa-related sequences and cntA mostly Escherichia coli-like Gammaproteobacteria.
Key findings
- Screening 67,134 PATRIC genomes yielded final databases of 1114 cutC candidate genes (454 unique proteins) and 6772 cntA candidate genes (491 unique proteins); the abstract reports 1107 cutC and 6738 cntA candidates.
- In 50 human fecal samples, cutC was detected in all individuals at an average of 0.16% ± 0.15% of total bacteria, while cntA was quantified in 13 samples (26%) at 0.03–2.17%, with only three samples ≥0.5%.
- cutC amplicons were diverse and often only distantly related to references (average 86% ± 7% nucleotide identity), mainly resembling Clostridium XIVa strains and Eubacterium sp. strain AB3007; cntA amplicons were highly similar to references (99.5% ± 0.5%), primarily Escherichia coli/Gammaproteobacteria.
- In 154 Human Microbiome Project metagenomes, 71% harbored cutC/D at an average 0.11% of bacteria and 27% were positive for cntA/B; 16S rRNA gene analysis did not adequately uncover TMA-producing potential.
Methods
- Databases for cutC and cntA were built using a multi-level HMM screening approach on 67,134 PATRIC genomes, incorporating conserved amino acid sites, phylogenetic distance, and synteny with cutD or cntB.
- Gene-targeted qPCR and Illumina MiSeq amplicon sequencing assays were developed and applied to 50 human fecal samples, with primer coverage estimated at 93% of unique cutC genes and 96% of unique cntA genes; quantification limit was 5 × 10³ genome copies per reaction.
- Analyses included 16S rRNA gene profiling, metagenomic screening of 154 HMP samples and reanalysis of 12 atherosclerosis patients versus 13 controls, co-occurrence/ordination of cutC communities, and functional genomic comparisons of Clostridium XIVa strains.
Limitations
- The paper states that only TMA-producing potential was measured, not gene expression or actual TMA production; volunteer metadata varied substantially and hindered identification of specific host factors governing the community.
- The paper states that metagenomic depth was insufficient for assembly of low-abundance targets, and the atherosclerosis reanalysis had low sample size and non-significant differences despite about twofold higher median cutC/cntA abundances in patients.
- The paper notes primer coverage gaps (some Betaproteobacteria for cntA; some Streptococcus for cutC) and unspecific cntA amplification requiring per-sample quality control; evident from the text, the study is cross-sectional and does not directly link gene abundance to TMA/TMAO serum concentrations.
Model-written summary. Check it against the paper before relying on it.
Integrity signals
Registry
Cites
Statistics
Figures
Verification
Claims the paper makes
61 Own result · 28 Not checked yet · 26 Own method · 18 Own interpretation · 2 No basis given
A result the paper reports from its own data — it cites no other source for it, so there is none to check. The quote shows it is in the paper.
In the paper
“In particular, a separation between samples containing either cluster a or b was detected.”
§ Uncovering the trimethylamine-producing bacteria of the human gut microbiota > Results > Gene-targeted assays to investigate the TMA-producing community
plaincorrelational- Asserted: passes — The authors put it forward as true.
- Checkable: passes — It can be checked against evidence.
- Load-bearing: unclear — It is unclear whether the paper’s conclusions depend on it.
- Based: passes — The paper gives a reason why it holds.
- Rests on an assumption: The TMA-producing communities in fecal samples are representative of the colonic TMA-producing communities in humans.
A result the paper reports from its own data — it cites no other source for it, so there is none to check. The quote shows it is in the paper.
In the paper
“Gene-abundance results did not significantly correlate with any subject parameters presented in Additional file 5.”
§ Uncovering the trimethylamine-producing bacteria of the human gut microbiota > Results > Gene-targeted assays to investigate the TMA-producing community
plainn = 50- Asserted: passes — The authors put it forward as true.
- Checkable: passes — It can be checked against evidence.
- Load-bearing: unclear — It is unclear whether the paper’s conclusions depend on it.
- Based: passes — The paper gives a reason why it holds.
- Rests on an assumption: The TMA-producing communities in fecal samples are representative of the colonic TMA-producing communities in humans.
In the paper
“Importantly, a recent report based on a genome-screening approach suggesting that numerous taxa contain both cntA/B and yeaW/X is misleading [11] as the database developed in this study unequivocally shows that the vast amount of genomes exhibits a single copy of this gene group.”
§ Uncovering the trimethylamine-producing bacteria of the human gut microbiota > Discussion
What the sources say
- Not checked yetcites [11] Falony G, Vieira-Silva S, Raes J. Microbiology meets big data: the case of gut microbiota-derived trimethylamine. Annu Rev Microbiol. 2015;69:305–21. source
boosted- Asserted: passes — The authors put it forward as true.
- Checkable: passes — It can be checked against evidence.
- Load-bearing: passes — The paper’s conclusions depend on it.
- Based: passes — The paper gives a reason why it holds.
A result the paper reports from its own data — it cites no other source for it, so there is none to check. The quote shows it is in the paper.
In the paper
“As shown by amplicon sequencing, the majority of reads indicating the presence of cutC/D were similar to genes of Clostridium XIVa or Eubacterium sp. strain AB3007.”
§ Uncovering the trimethylamine-producing bacteria of the human gut microbiota > Results > Screening of metagenomes for TMA-producing catabolic genes
plain- Asserted: passes — The authors put it forward as true.
- Checkable: passes — It can be checked against evidence.
- Load-bearing: passes — The paper’s conclusions depend on it.
- Based: passes — The paper gives a reason why it holds.
A result the paper reports from its own data — it cites no other source for it, so there is none to check. The quote shows it is in the paper.
In the paper
“Target genes were detected in all samples”
§ Uncovering the trimethylamine-producing bacteria of the human gut microbiota > Discussion
plain- Asserted: passes — The authors put it forward as true.
- Checkable: passes — It can be checked against evidence.
- Load-bearing: passes — The paper’s conclusions depend on it.
- Based: passes — The paper gives a reason why it holds.
In the paper
“All sequences (with one exception) display a conserved “bridging” glutamate instead of aspartate (E205D), which was previously suggested as a signature for that enzyme [7].”
§ Uncovering the trimethylamine-producing bacteria of the human gut microbiota > Results > Establishing databases for cutC and cntA
What the sources say
- Not checked yetcites [7] Zhu Y, Jameson E, Crosatti M, Schäfer H, Rajakumar K, Bugg TDH, et al. Carnitine metabolism to trimethylamine by an unusual Rieske-type oxygenase from human microbiota. Proc Natl Acad Sci U S A. 2014;111:4268–73. source
plain- Asserted: passes — The authors put it forward as true.
- Checkable: passes — It can be checked against evidence.
- Load-bearing: unclear — It is unclear whether the paper’s conclusions depend on it.
- Based: passes — The paper gives a reason why it holds.
A result the paper reports from its own data — it cites no other source for it, so there is none to check. The quote shows it is in the paper.
In the paper
“Detailed analysis applying high clustering identity cutoffs (99 and 98% nucleotide similarity) revealed high diversities of the cutC gene with several thousand distinct sequence types that are shared between a few samples (<10%; Additional file 6A).”
§ Uncovering the trimethylamine-producing bacteria of the human gut microbiota > Results > Gene-targeted assays to investigate the TMA-producing community
plain- Asserted: passes — The authors put it forward as true.
- Checkable: passes — It can be checked against evidence.
- Load-bearing: unclear — It is unclear whether the paper’s conclusions depend on it.
- Based: passes — The paper gives a reason why it holds.
- Rests on an assumption: The TMA-producing communities in fecal samples are representative of the colonic TMA-producing communities in humans.
A result the paper reports from its own data — it cites no other source for it, so there is none to check. The quote shows it is in the paper.
In the paper
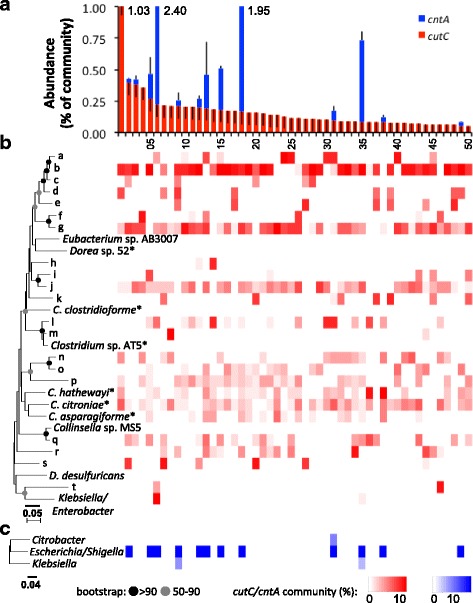
“Although we detected competition patterns between related taxa, in particular between clusters a and b where either taxon dominated in specific samples (Fig. 2)”
§ Uncovering the trimethylamine-producing bacteria of the human gut microbiota > Discussion
plaincorrelational- Asserted: passes — The authors put it forward as true.
- Checkable: passes — It can be checked against evidence.
- Load-bearing: unclear — It is unclear whether the paper’s conclusions depend on it.
- Based: passes — The paper gives a reason why it holds.
A result the paper reports from its own data — it cites no other source for it, so there is none to check. The quote shows it is in the paper.
In the paper
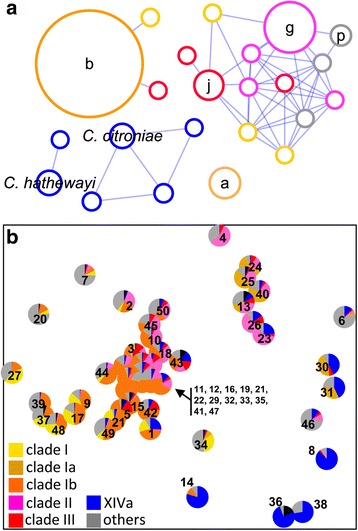
“Co-occurrence analysis of cutC amplicons based on the clustering results presented in Fig. 2b revealed several distinct network groups that were largely directed by the phylogenetic relatedness of clusters (Fig. 3a).”
§ Uncovering the trimethylamine-producing bacteria of the human gut microbiota > Results > Gene-targeted assays to investigate the TMA-producing community
plaincorrelational- Asserted: passes — The authors put it forward as true.
- Checkable: passes — It can be checked against evidence.
- Load-bearing: unclear — It is unclear whether the paper’s conclusions depend on it.
- Based: passes — The paper gives a reason why it holds.
- Rests on an assumption: The TMA-producing communities in fecal samples are representative of the colonic TMA-producing communities in humans.
A result the paper reports from its own data — it cites no other source for it, so there is none to check. The quote shows it is in the paper.
In the paper
“A few communities additionally contained cntA amplicons similar to those previously detected in Citrobacter and Klebsiella.”
§ Uncovering the trimethylamine-producing bacteria of the human gut microbiota > Results > Gene-targeted assays to investigate the TMA-producing community
plain- Asserted: passes — The authors put it forward as true.
- Checkable: passes — It can be checked against evidence.
- Load-bearing: unclear — It is unclear whether the paper’s conclusions depend on it.
- Based: passes — The paper gives a reason why it holds.
- Rests on an assumption: The TMA-producing communities in fecal samples are representative of the colonic TMA-producing communities in humans.
- The quote only partly states this claim. 3
- It may state two separate claims as one. 53
- Probably not a substantial claim. 23
A result the paper reports from its own data — it cites no other source for it, so there is none to check. The quote shows it is in the paper.
In the paper
“Putative cntA genes were identified in 6738 genomes (491 dereplicated protein sequences)”
§ Uncovering the trimethylamine-producing bacteria of the human gut microbiota > Results > Establishing databases for cutC and cntA
hedged- Asserted: passes — The authors put it forward as true.
- Checkable: passes — It can be checked against evidence.
- Load-bearing: passes — The paper’s conclusions depend on it.
- Based: passes — The paper gives a reason why it holds.
The quote only partly states this claim.
A result the paper reports from its own data — it cites no other source for it, so there is none to check. The quote shows it is in the paper.
In the paper
“Putative cutC genes were detected in a total of 1107 genomes (454 dereplicated protein sequences)”
§ Uncovering the trimethylamine-producing bacteria of the human gut microbiota > Results > Establishing databases for cutC and cntA
hedged- Asserted: passes — The authors put it forward as true.
- Checkable: passes — It can be checked against evidence.
- Load-bearing: passes — The paper’s conclusions depend on it.
- Based: passes — The paper gives a reason why it holds.
The quote only partly states this claim.
A result the paper reports from its own data — it cites no other source for it, so there is none to check. The quote shows it is in the paper.
In the paper
“Putative cutC genes were detected in a total of 1107 genomes (454 dereplicated protein sequences) that belong to Proteobacteria (in particular Gamma- and Deltaproteobacteria) and Firmicutes (mainly Clostridia and some Bacilli), as well as a few Actinobacteria”
§ Uncovering the trimethylamine-producing bacteria of the human gut microbiota > Results > Establishing databases for cutC and cntA
hedgedcorrelational- Asserted: passes — The authors put it forward as true.
- Checkable: passes — It can be checked against evidence.
- Load-bearing: passes — The paper’s conclusions depend on it.
- Based: passes — The paper gives a reason why it holds.
It may state two separate claims as one.
A result the paper reports from its own data — it cites no other source for it, so there is none to check. The quote shows it is in the paper.
In the paper
“Overall, strains are predicted to contain 101 ± 79 glycoside hydrolases (GHs), 41 ± 13 glycosyltransferases (GTs), 25 ± 17 carbohydrate-binding modules (CBMs), 26 ± 13 carbohydrate esterases (CEs), and 4 ± 4 polysaccharide lyases (PLs).”
§ Uncovering the trimethylamine-producing bacteria of the human gut microbiota > Results > Genomic analyses of Clostridium XIVa strains
plain- Asserted: passes — The authors put it forward as true.
- Checkable: passes — It can be checked against evidence.
- Load-bearing: unclear — It is unclear whether the paper’s conclusions depend on it.
- Based: passes — The paper gives a reason why it holds.
It may state two separate claims as one.
A result the paper reports from its own data — it cites no other source for it, so there is none to check. The quote shows it is in the paper.
In the paper
“At higher cutoffs (99 and 98% identity), several thousand clusters were detected and richness drastically declined with decreasing identity cutoffs. For example, only 55 and 14 total clusters were detected at 95 and 90% cutoff values, respectively.”
§ Uncovering the trimethylamine-producing bacteria of the human gut microbiota > Results > Gene-targeted assays to investigate the TMA-producing community
plaindirect- Asserted: passes — The authors put it forward as true.
- Checkable: passes — It can be checked against evidence.
- Load-bearing: unclear — It is unclear whether the paper’s conclusions depend on it.
- Based: passes — The paper gives a reason why it holds.
It may state two separate claims as one.
- Rests on an assumption: The TMA-producing communities in fecal samples are representative of the colonic TMA-producing communities in humans.
A result the paper reports from its own data — it cites no other source for it, so there is none to check. The quote shows it is in the paper.
In the paper
“In contrast, all cntA sequences obtained were similar to those previously observed in Gammaproteobacteria, in particular from Escherichia/Shigella (Fig. 2c); closest match analysis revealed 98.1% being closely related to sequences from E. coli (data not shown).”
§ Uncovering the trimethylamine-producing bacteria of the human gut microbiota > Results > Gene-targeted assays to investigate the TMA-producing community
plain- Asserted: passes — The authors put it forward as true.
- Checkable: passes — It can be checked against evidence.
- Load-bearing: passes — The paper’s conclusions depend on it.
- Based: passes — The paper gives a reason why it holds.
It may state two separate claims as one.
- Rests on an assumption: The TMA-producing communities in fecal samples are representative of the colonic TMA-producing communities in humans.
A result the paper reports from its own data — it cites no other source for it, so there is none to check. The quote shows it is in the paper.
In the paper
“Screening of contigs provided by the Human Microbiome Project (HMP) for cutC/D sequences yielded similar results. Only two samples contained contigs with decent sequence stretches indicating the presence of cutC/D, and those were nearly identical (>99% identity) to Clostridium sp. AT5 sequences (data not shown).”
§ Uncovering the trimethylamine-producing bacteria of the human gut microbiota > Results > Screening of metagenomes for TMA-producing catabolic genes
plainn = 2- Asserted: passes — The authors put it forward as true.
- Checkable: passes — It can be checked against evidence.
- Load-bearing: passes — The paper’s conclusions depend on it.
- Based: passes — The paper gives a reason why it holds.
It may state two separate claims as one.
A result the paper reports from its own data — it cites no other source for it, so there is none to check. The quote shows it is in the paper.
In the paper
“On average, 76 ± 18 clusters per sample (90% nucleotide identity) were observed, where the majority was similar to genes previously observed in Firmicutes, in particular to those of Clostridium XIVa strains and Eubacterium sp. strain AB3007 (Fig. 2b).”
§ Uncovering the trimethylamine-producing bacteria of the human gut microbiota > Results > Gene-targeted assays to investigate the TMA-producing community
plain- Asserted: passes — The authors put it forward as true.
- Checkable: passes — It can be checked against evidence.
- Load-bearing: passes — The paper’s conclusions depend on it.
- Based: passes — The paper gives a reason why it holds.
It may state two separate claims as one.
- Rests on an assumption: The TMA-producing communities in fecal samples are representative of the colonic TMA-producing communities in humans.
A result the paper reports from its own data — it cites no other source for it, so there is none to check. The quote shows it is in the paper.
In the paper
“CntA was quantified in 13 samples displaying large abundance differences ranging from 0.03 to 2.17% of bacteria possessing cntA, with only three samples displaying an abundance ≥0.5%.”
§ Uncovering the trimethylamine-producing bacteria of the human gut microbiota > Results > Gene-targeted assays to investigate the TMA-producing community
plainn = 13- Asserted: passes — The authors put it forward as true.
- Checkable: passes — It can be checked against evidence.
- Load-bearing: unclear — It is unclear whether the paper’s conclusions depend on it.
- Based: passes — The paper gives a reason why it holds.
It may state two separate claims as one.
- Rests on an assumption: The TMA-producing communities in fecal samples are representative of the colonic TMA-producing communities in humans.
A result the paper reports from its own data — it cites no other source for it, so there is none to check. The quote shows it is in the paper.
In the paper
“All revealed candidates contain a single copy of cutC, except for seven genomes that display double entries.”
§ Uncovering the trimethylamine-producing bacteria of the human gut microbiota > Results > Establishing databases for cutC and cntA
plain- Asserted: passes — The authors put it forward as true.
- Checkable: passes — It can be checked against evidence.
- Load-bearing: unclear — It is unclear whether the paper’s conclusions depend on it.
- Based: passes — The paper gives a reason why it holds.
It may state two separate claims as one.
A result the paper reports from its own data — it cites no other source for it, so there is none to check. The quote shows it is in the paper.
In the paper
“However, a major part of sequences, especially those of clusters a–k (Fig. 2b), were only distantly related to reference sequences and formed separate clades on the tree. Consequently, overall nucleotide similarity of cutC amplicons to reference sequences was low (86% ± 7%).”
§ Uncovering the trimethylamine-producing bacteria of the human gut microbiota > Results > Gene-targeted assays to investigate the TMA-producing community
plain- Asserted: passes — The authors put it forward as true.
- Checkable: passes — It can be checked against evidence.
- Load-bearing: passes — The paper’s conclusions depend on it.
- Based: passes — The paper gives a reason why it holds.
It may state two separate claims as one.
- Rests on an assumption: The TMA-producing communities in fecal samples are representative of the colonic TMA-producing communities in humans.
A result the paper reports from its own data — it cites no other source for it, so there is none to check. The quote shows it is in the paper.
In the paper
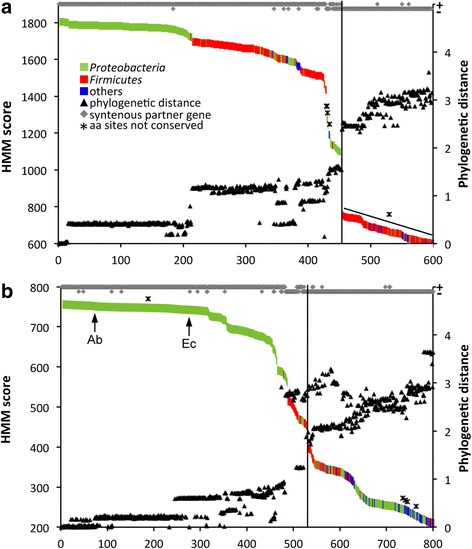
“Putative cntA genes were identified in 6738 genomes (491 dereplicated protein sequences) where the majority was observed in Proteobacteria, especially Gammaproteobacteria (mostly derived from Escherichia and Acinetobacter), and some entries belonging to Betaproteobacteria and Epsilonproteobacteria (Fig. 1b, Additional file 1B, Additional file 2B). Two sequences were obtained from Enterococcus sp.”
§ Uncovering the trimethylamine-producing bacteria of the human gut microbiota > Results > Establishing databases for cutC and cntA
hedged- Asserted: passes — The authors put it forward as true.
- Checkable: passes — It can be checked against evidence.
- Load-bearing: passes — The paper’s conclusions depend on it.
- Based: passes — The paper gives a reason why it holds.
It may state two separate claims as one.
A result the paper reports from its own data — it cites no other source for it, so there is none to check. The quote shows it is in the paper.
In the paper
“Results of global feature analysis based on FIGfams largely reflected 16S rRNA gene phylogeny where cutC-containing strains span the entire dendrogram and are dominated by three separate groups (Additional file 10A).”
§ Uncovering the trimethylamine-producing bacteria of the human gut microbiota > Results > Genomic analyses of Clostridium XIVa strains
plaincorrelational- Asserted: passes — The authors put it forward as true.
- Checkable: passes — It can be checked against evidence.
- Load-bearing: unclear — It is unclear whether the paper’s conclusions depend on it.
- Based: passes — The paper gives a reason why it holds.
It may state two separate claims as one.
A result the paper reports from its own data — it cites no other source for it, so there is none to check. The quote shows it is in the paper.
In the paper
“Of those, a few clusters (nine and one, respectively) were observed in >90% of all samples comprising the majority of obtained sequences (Additional file 6B).”
§ Uncovering the trimethylamine-producing bacteria of the human gut microbiota > Results > Gene-targeted assays to investigate the TMA-producing community
plain- Asserted: passes — The authors put it forward as true.
- Checkable: passes — It can be checked against evidence.
- Load-bearing: unclear — It is unclear whether the paper’s conclusions depend on it.
- Based: passes — The paper gives a reason why it holds.
It may state two separate claims as one. The quote only partly states this claim.
- Rests on an assumption: The TMA-producing communities in fecal samples are representative of the colonic TMA-producing communities in humans.
A result the paper reports from its own data — it cites no other source for it, so there is none to check. The quote shows it is in the paper.
In the paper
“Overall, the identity of amplicons to reference sequences was high (99.5% ± 0.5%), and with 3 ± 2 clusters (90% nucleotide identity) detected per sample, the gene diversity was much lower compared to that observed for cutC.”
§ Uncovering the trimethylamine-producing bacteria of the human gut microbiota > Results > Gene-targeted assays to investigate the TMA-producing community
plain- Asserted: passes — The authors put it forward as true.
- Checkable: passes — It can be checked against evidence.
- Load-bearing: unclear — It is unclear whether the paper’s conclusions depend on it.
- Based: passes — The paper gives a reason why it holds.
It may state two separate claims as one.
- Rests on an assumption: The TMA-producing communities in fecal samples are representative of the colonic TMA-producing communities in humans.
In the paper
“Our results indicated increased abundances of bacteria exhibiting the potential to produce TMA (by about a factor of 2) in the patient group where the abundances of key genes of both pathways were elevated (median values of 0.39 and 0.11% (patient group) versus 0.22 and 0% (controls) for cutC and cntA, respectively, as a percentage of bacteria calculated to exhibit the genes) (Additional file 8).”
§ Uncovering the trimethylamine-producing bacteria of the human gut microbiota > Results > Screening of metagenomes for TMA-producing catabolic genes
What the sources say
- Not checked yetcites [12] Karlsson FH, Fåk F, Nookaew I, Tremaroli V, Fagerberg B, Petranovic D, et al. Symptomatic atherosclerosis is associated with an altered gut metagenome. Nat Commun. 2012;3:1245. source
hedgedcorrelationaln = 12- Asserted: passes — The authors put it forward as true.
- Checkable: passes — It can be checked against evidence.
- Load-bearing: passes — The paper’s conclusions depend on it.
- Based: passes — The paper gives a reason why it holds.
It may state two separate claims as one.
None of the sources cited for this claim have been checked yet.
In the paper
“The established databases present a comprehensive update of previous cutC [9] and cntA [7] gene sequence collections adding a multitude of new gene sequences.”
§ Uncovering the trimethylamine-producing bacteria of the human gut microbiota > Discussion
What the sources say
- Not checked yetcites [9] Campo AM, Bodea S, Hamer H. Characterization and detection of a widely distributed gene cluster that predicts anaerobic choline utilization by human gut bacteria. MBio. 2015;6:e00042–15.
- Not checked yetcites [7] Zhu Y, Jameson E, Crosatti M, Schäfer H, Rajakumar K, Bugg TDH, et al. Carnitine metabolism to trimethylamine by an unusual Rieske-type oxygenase from human microbiota. Proc Natl Acad Sci U S A. 2014;111:4268–73. source
plain- Asserted: passes — The authors put it forward as true.
- Checkable: passes — It can be checked against evidence.
- Load-bearing: passes — The paper’s conclusions depend on it.
- Based: passes — The paper gives a reason why it holds.
It may state two separate claims as one.
A result the paper reports from its own data — it cites no other source for it, so there is none to check. The quote shows it is in the paper.
In the paper
“Samples enriched in other clusters linked to clade I form another group on the plot, whereas a few distant samples displayed high abundances of clusters tightly related with Clostridium XIVa strains.”
§ Uncovering the trimethylamine-producing bacteria of the human gut microbiota > Results > Gene-targeted assays to investigate the TMA-producing community
plaincorrelational- Asserted: passes — The authors put it forward as true.
- Checkable: passes — It can be checked against evidence.
- Load-bearing: unclear — It is unclear whether the paper’s conclusions depend on it.
- Based: passes — The paper gives a reason why it holds.
It may state two separate claims as one.
- Rests on an assumption: The TMA-producing communities in fecal samples are representative of the colonic TMA-producing communities in humans.
A result the paper reports from its own data — it cites no other source for it, so there is none to check. The quote shows it is in the paper.
In the paper
“Nevertheless, some sequences comprised in our databases are not expected to be amplified, as the cntA forward primer does not match a few Betaproteobacteria, and in the case of cutC, a few sequences observed in Streptococcus show ≥2 mismatches with the reverse primer.”
§ Uncovering the trimethylamine-producing bacteria of the human gut microbiota > Discussion
plain- Asserted: passes — The authors put it forward as true.
- Checkable: passes — It can be checked against evidence.
- Load-bearing: unclear — It is unclear whether the paper’s conclusions depend on it.
- Based: passes — The paper gives a reason why it holds.
It may state two separate claims as one.
A result the paper reports from its own data — it cites no other source for it, so there is none to check. The quote shows it is in the paper.
In the paper
“However, most sequence reads displayed an identity of only 92.3% ± 7.1% and 96% ± 6.4% for cutC and cutD, respectively.”
§ Uncovering the trimethylamine-producing bacteria of the human gut microbiota > Results > Screening of metagenomes for TMA-producing catabolic genes
plainn = 154- Asserted: passes — The authors put it forward as true.
- Checkable: passes — It can be checked against evidence.
- Load-bearing: passes — The paper’s conclusions depend on it.
- Based: passes — The paper gives a reason why it holds.
It may state two separate claims as one.
A result the paper reports from its own data — it cites no other source for it, so there is none to check. The quote shows it is in the paper.
In the paper
“C. phytofermentans, Clostridium sp. AT5, and Dorea sp. 5-2 are clustering apart displaying ~55% functional similarity with members of the three main groups, while Eubacterium sp. strain AB3007, together with three additional strains, forms the outgroup sharing less than half of FIGfams with other strains.”
§ Uncovering the trimethylamine-producing bacteria of the human gut microbiota > Results > Genomic analyses of Clostridium XIVa strains
plain- Asserted: passes — The authors put it forward as true.
- Checkable: passes — It can be checked against evidence.
- Load-bearing: unclear — It is unclear whether the paper’s conclusions depend on it.
- Based: passes — The paper gives a reason why it holds.
It may state two separate claims as one.
A result the paper reports from its own data — it cites no other source for it, so there is none to check. The quote shows it is in the paper.
In the paper
“For cutC/D, the majority of contigs from those samples were gene fragments and only four assembled sequences (two for each gene) with a length >50% of median reference gene lengths were obtained (from two distinct samples).”
§ Uncovering the trimethylamine-producing bacteria of the human gut microbiota > Results > Screening of metagenomes for TMA-producing catabolic genes
plainn = 2- Asserted: passes — The authors put it forward as true.
- Checkable: passes — It can be checked against evidence.
- Load-bearing: unclear — It is unclear whether the paper’s conclusions depend on it.
- Based: passes — The paper gives a reason why it holds.
It may state two separate claims as one.
A result the paper reports from its own data — it cites no other source for it, so there is none to check. The quote shows it is in the paper.
In the paper
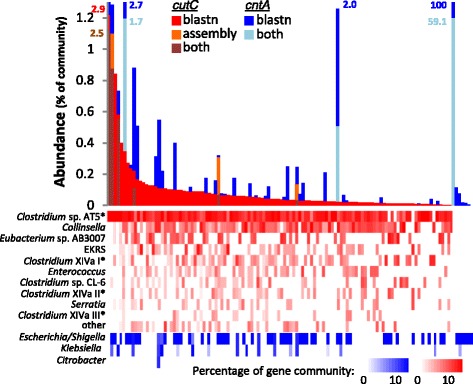
“Application of a gene-targeted assembly method yielded sequences for cutC/D and cntA/B in only six and three samples, respectively, though at similar abundances as through our BLAST search (Fig. 4).”
§ Uncovering the trimethylamine-producing bacteria of the human gut microbiota > Results > Screening of metagenomes for TMA-producing catabolic genes
plainn = 6- Asserted: passes — The authors put it forward as true.
- Checkable: passes — It can be checked against evidence.
- Load-bearing: unclear — It is unclear whether the paper’s conclusions depend on it.
- Based: passes — The paper gives a reason why it holds.
It may state two separate claims as one.
A result the paper reports from its own data — it cites no other source for it, so there is none to check. The quote shows it is in the paper.
In the paper
“Even at the low identity cutoffs of 90%, the vast amount of clusters was only detected in a minority of samples with many being sample specific.”
§ Uncovering the trimethylamine-producing bacteria of the human gut microbiota > Results > Gene-targeted assays to investigate the TMA-producing community
plain- Asserted: passes — The authors put it forward as true.
- Checkable: passes — It can be checked against evidence.
- Load-bearing: passes — The paper’s conclusions depend on it.
- Based: passes — The paper gives a reason why it holds.
It may state two separate claims as one.
- Rests on an assumption: The TMA-producing communities in fecal samples are representative of the colonic TMA-producing communities in humans.
A result the paper reports from its own data — it cites no other source for it, so there is none to check. The quote shows it is in the paper.
In the paper
“At a cutoff level of 95% 1310 distinct sequence types could be differentiated. Only a few of them (41) were detected in the majority of samples; however, they comprised the bulk of obtained sequences (≥67%).”
§ Uncovering the trimethylamine-producing bacteria of the human gut microbiota > Results > Gene-targeted assays to investigate the TMA-producing community
plain- Asserted: passes — The authors put it forward as true.
- Checkable: passes — It can be checked against evidence.
- Load-bearing: passes — The paper’s conclusions depend on it.
- Based: passes — The paper gives a reason why it holds.
It may state two separate claims as one.
- Rests on an assumption: The TMA-producing communities in fecal samples are representative of the colonic TMA-producing communities in humans.
A result the paper reports from its own data — it cites no other source for it, so there is none to check. The quote shows it is in the paper.
In the paper
“CutC was enumerated in all samples, and an average abundance of 0.16% ± 0.15% bacteria of the total community was calculated to contain the gene.”
§ Uncovering the trimethylamine-producing bacteria of the human gut microbiota > Results > Gene-targeted assays to investigate the TMA-producing community
plainn = 50- Asserted: passes — The authors put it forward as true.
- Checkable: passes — It can be checked against evidence.
- Load-bearing: passes — The paper’s conclusions depend on it.
- Based: passes — The paper gives a reason why it holds.
It may state two separate claims as one.
- Rests on an assumption: The TMA-producing communities in fecal samples are representative of the colonic TMA-producing communities in humans.
A result the paper reports from its own data — it cites no other source for it, so there is none to check. The quote shows it is in the paper.
In the paper
“Members of clade I (defined by clusters a–d from Fig. 2b) are separated where the main clusters a and b are not connected to each other nor to other phylogenetically related clusters, whereas members from clades II (g) and III (j) are located in the same module linked to other clusters from those clades.”
§ Uncovering the trimethylamine-producing bacteria of the human gut microbiota > Results > Gene-targeted assays to investigate the TMA-producing community
plaincorrelational- Asserted: passes — The authors put it forward as true.
- Checkable: passes — It can be checked against evidence.
- Load-bearing: unclear — It is unclear whether the paper’s conclusions depend on it.
- Based: passes — The paper gives a reason why it holds.
It may state two separate claims as one.
- Rests on an assumption: The TMA-producing communities in fecal samples are representative of the colonic TMA-producing communities in humans.
A result the paper reports from its own data — it cites no other source for it, so there is none to check. The quote shows it is in the paper.
In the paper
“In contrast, reads indicating the presence of cntA/B were nearly identical to references (99.6% ± 1.1% and 99.8% ± 0.8% for cntA and cntB, respectively) and predominantly related to Gammaproteobacteria, in particular to Escherichia/Shigella and Klebsiella.”
§ Uncovering the trimethylamine-producing bacteria of the human gut microbiota > Results > Screening of metagenomes for TMA-producing catabolic genes
plaincorrelationaln = 154- Asserted: passes — The authors put it forward as true.
- Checkable: passes — It can be checked against evidence.
- Load-bearing: passes — The paper’s conclusions depend on it.
- Based: passes — The paper gives a reason why it holds.
It may state two separate claims as one.
A result the paper reports from its own data — it cites no other source for it, so there is none to check. The quote shows it is in the paper.
In the paper
“On average, 98.2% (cutC) and 92.5% (cntA) of all merged sequences passed these initial steps”
§ Uncovering the trimethylamine-producing bacteria of the human gut microbiota > Methods > Bioinformatic procedures for amplicon analysis
plainn = 12- Asserted: passes — The authors put it forward as true.
- Checkable: passes — It can be checked against evidence.
- Load-bearing: fails — The paper’s conclusions may not depend on it.
- Based: passes — The paper gives a reason why it holds.
Probably not a substantial claim. The paper’s conclusions may not depend on it. It may state two separate claims as one.
In the paper
“Another recent study [10] demonstrated that colonization of the mouse gut with a specific consortium of CutC-encoding human isolates results in TMA synthesis and subsequent TMAO accumulation in the serum of animals”
§ Uncovering the trimethylamine-producing bacteria of the human gut microbiota > Background
What the sources say
- Not checked yetcites [10] Romano KA, Vivas EI, Amador-Noguez D, Rey FE. Intestinal microbiota composition modulates choline bioavailability. MBio. 2015;6:e02481–14. source
boosteddirect- Asserted: passes — The authors put it forward as true.
- Checkable: passes — It can be checked against evidence.
- Load-bearing: fails — The paper’s conclusions may not depend on it.
- Based: passes — The paper gives a reason why it holds.
Probably not a substantial claim. The paper’s conclusions may not depend on it.
None of the sources cited for this claim have been checked yet.
In the paper
“Functionality has been shown for Acinetobacter baumannii and Escherichia coli where both genes cntA/yeaX and cntB/yeaW are required for the formation of TMA.”
§ Uncovering the trimethylamine-producing bacteria of the human gut microbiota > Background
plaindirect- Asserted: passes — The authors put it forward as true.
- Checkable: passes — It can be checked against evidence.
- Load-bearing: fails — The paper’s conclusions may not depend on it.
- Based: passes — The paper gives a reason why it holds.
Probably not a substantial claim. The paper’s conclusions may not depend on it. It may state two separate claims as one.
In the paper
“A mechanistic model has been formulated proposing that TMAO promotes atherogenesis through the formation of foam cells (lipid-laden macrophages) and a reduction of the reverse cholesterol transport from the atherosclerotic plaque [5].”
§ Uncovering the trimethylamine-producing bacteria of the human gut microbiota > Background
What the sources say
- Not checked yetcites [5] Koeth R, Wang Z, Levison BS, Buffa J, Org E, Sheehy BT, et al. Intestinal microbiota metabolism of L-carnitine, a nutrient in red meat, promotes atherosclerosis. Nat Med. 2013;19:576–85. source
hedgeddirect- Asserted: passes — The authors put it forward as true.
- Checkable: passes — It can be checked against evidence.
- Load-bearing: fails — The paper’s conclusions may not depend on it.
- Based: passes — The paper gives a reason why it holds.
Probably not a substantial claim. The paper’s conclusions may not depend on it.
None of the sources cited for this claim have been checked yet.
In the paper
“Two major TMA-synthesis pathways have been described with a specific glycyl radical enzyme, the choline TMA-lyase (CutC) and its activator CutD [6], that takes choline as a substrate and a two-component Rieske-type oxygenase/reductase (CntA/B) [7], which acts on carnitine and its derivative gamma-butyrobetaine, as the key enzymes.”
§ Uncovering the trimethylamine-producing bacteria of the human gut microbiota > Background
What the sources say
- Not checked yetcites [6] Craciun S, Balskus EP. Microbial conversion of choline to trimethylamine requires a glycyl radical enzyme. Proc Natl Acad Sci U S A. 2012;109:21307–12. source
- Not checked yetcites [7] Zhu Y, Jameson E, Crosatti M, Schäfer H, Rajakumar K, Bugg TDH, et al. Carnitine metabolism to trimethylamine by an unusual Rieske-type oxygenase from human microbiota. Proc Natl Acad Sci U S A. 2014;111:4268–73. source
plain- Asserted: passes — The authors put it forward as true.
- Checkable: passes — It can be checked against evidence.
- Load-bearing: passes — The paper’s conclusions depend on it.
- Based: passes — The paper gives a reason why it holds.
Probably not a substantial claim. It may state two separate claims as one.
In the paper
“Campo and colleagues have shown that the so-called choline utilization cluster, which includes cutC/D among other genes involved in anaerobic choline metabolism, is widely, but discontinuously, distributed across various taxa belonging to Firmicutes, Actinobacteria, and Proteobacteria [9].”
§ Uncovering the trimethylamine-producing bacteria of the human gut microbiota > Background
What the sources say
- Not checked yetcites [9] Campo AM, Bodea S, Hamer H. Characterization and detection of a widely distributed gene cluster that predicts anaerobic choline utilization by human gut bacteria. MBio. 2015;6:e00042–15.
plain- Asserted: passes — The authors put it forward as true.
- Checkable: passes — It can be checked against evidence.
- Load-bearing: fails — The paper’s conclusions may not depend on it.
- Based: passes — The paper gives a reason why it holds.
Probably not a substantial claim. The paper’s conclusions may not depend on it.
What the paper did — it cites no source for this, so there is none to check. The quote shows it is in the paper.
In the paper
“In silico analysis on coverage of developed primers suggested that a broad range of cutC and cntA gene sequences are targeted, namely 93 and 96% of all unique cutC and cntA genes, respectively (allowing for one mismatch in each primer).”
§ Uncovering the trimethylamine-producing bacteria of the human gut microbiota > Results > Gene-targeted assays to investigate the TMA-producing community
hedged- Asserted: passes — The authors put it forward as true.
- Checkable: passes — It can be checked against evidence.
- Load-bearing: passes — The paper’s conclusions depend on it.
- Based: passes — The paper gives a reason why it holds.
It may state two separate claims as one.
A conclusion the paper draws from its own results — it cites no other source for it, so there is none to check. The quote shows it is in the paper.
In the paper
“However, for both genes, metagenomic analysis suggested that sequences not targeted by our assays do not play an important role in the colonic TMA-producing communities as not a single read was related to any of those reference sequences.”
§ Uncovering the trimethylamine-producing bacteria of the human gut microbiota > Discussion
hedged- Asserted: passes — The authors put it forward as true.
- Checkable: passes — It can be checked against evidence.
- Load-bearing: passes — The paper’s conclusions depend on it.
- Based: passes — The paper gives a reason why it holds.
It may state two separate claims as one.
In the paper
“However, the yeaW gene displays close sequence identity (74%) to the cntA model sequence from A. baumannii and is arranged in similar operons that additionally encode a reductase (yeaX and cntB, respectively) as well as a betaine/carnitine/choline transporter”
§ Uncovering the trimethylamine-producing bacteria of the human gut microbiota > Discussion
What the sources say
- Not checked yetcites [8] Koeth RA, Levison BS, Culley MK, Buffa JA, Wang Z, Gregory JC, et al. γ-Butyrobetaine is a proantherogenic intermediate in gut microbial metabolism of L-carnitine to TMAO. Cell Metab. 2014;20:799–812. source
plaincorrelational- Asserted: passes — The authors put it forward as true.
- Checkable: passes — It can be checked against evidence.
- Load-bearing: passes — The paper’s conclusions depend on it.
- Based: passes — The paper gives a reason why it holds.
It may state two separate claims as one.
None of the sources cited for this claim have been checked yet.
In the paper
“and for both enzymes, promiscuity to transform carnitine and butyrobetaine at similar rates was shown (yeaW/X was reported to act on choline and to a lesser extent on betaine as well).”
§ Uncovering the trimethylamine-producing bacteria of the human gut microbiota > Discussion
plain- Asserted: passes — The authors put it forward as true.
- Checkable: passes — It can be checked against evidence.
- Load-bearing: passes — The paper’s conclusions depend on it.
- Based: passes — The paper gives a reason why it holds.
Probably not a substantial claim.
What the paper did — it cites no source for this, so there is none to check. The quote shows it is in the paper.
In the paper
“Our gene-targeted assays encompass key genes of the two major TMA-synthesis pathways and target a broad range of distinct taxa.”
§ Uncovering the trimethylamine-producing bacteria of the human gut microbiota > Discussion
plain- Asserted: passes — The authors put it forward as true.
- Checkable: passes — It can be checked against evidence.
- Load-bearing: passes — The paper’s conclusions depend on it.
- Based: passes — The paper gives a reason why it holds.
It may state two separate claims as one.
What the paper did — it cites no source for this, so there is none to check. The quote shows it is in the paper.
In the paper
“Primer coverage is thorough, and amplification as well as quantification of numerous distinct target sequences at similar levels was confirmed.”
§ Uncovering the trimethylamine-producing bacteria of the human gut microbiota > Discussion
plain- Asserted: passes — The authors put it forward as true.
- Checkable: passes — It can be checked against evidence.
- Load-bearing: passes — The paper’s conclusions depend on it.
- Based: passes — The paper gives a reason why it holds.
It may state two separate claims as one.
What the paper did — it cites no source for this, so there is none to check. The quote shows it is in the paper.
In the paper
“The qPCR on one third diluted samples indicated quantities of 40.6% ± 12.2% and 39.9% ± 22.2% of undiluted samples for cutC and cntA (five samples were on the borderline of detection), respectively, evidencing that the PCR mixtures were devoid of any interfering ingredients.”
§ Uncovering the trimethylamine-producing bacteria of the human gut microbiota > Results > Gene-targeted assays to investigate the TMA-producing community
hedgeddirectn = 5- Asserted: passes — The authors put it forward as true.
- Checkable: passes — It can be checked against evidence.
- Load-bearing: unclear — It is unclear whether the paper’s conclusions depend on it.
- Based: passes — The paper gives a reason why it holds.
It may state two separate claims as one.
What the paper did — it cites no source for this, so there is none to check. The quote shows it is in the paper.
In the paper
“For cutC, one major band with the expected size was detected in all samples; for a few samples, some very faint unspecific bands were additionally visible.”
§ Uncovering the trimethylamine-producing bacteria of the human gut microbiota > Results > Gene-targeted assays to investigate the TMA-producing community
plainn = 50- Asserted: passes — The authors put it forward as true.
- Checkable: passes — It can be checked against evidence.
- Load-bearing: fails — The paper’s conclusions may not depend on it.
- Based: passes — The paper gives a reason why it holds.
Probably not a substantial claim. The paper’s conclusions may not depend on it. It may state two separate claims as one.
What the paper did — it cites no source for this, so there is none to check. The quote shows it is in the paper.
In the paper
“Hence, a cutoff of 906.4, representing the median HMM score of the two sequences that frame that drop, was set, and all entries above that cutoff were considered as true cutC sequences.”
§ Uncovering the trimethylamine-producing bacteria of the human gut microbiota > Results > Establishing databases for cutC and cntA
plain- Asserted: passes — The authors put it forward as true.
- Checkable: passes — It can be checked against evidence.
- Load-bearing: passes — The paper’s conclusions depend on it.
- Based: passes — The paper gives a reason why it holds.
Probably not a substantial claim. It may state two separate claims as one.
A conclusion the paper draws from its own results — it cites no other source for it, so there is none to check. The quote shows it is in the paper.
In the paper
“suggesting that TMA producers constitute members of the core gut community, though at very low abundances”
§ Uncovering the trimethylamine-producing bacteria of the human gut microbiota > Discussion
hedgedcorrelational- Asserted: passes — The authors put it forward as true.
- Checkable: passes — It can be checked against evidence.
- Load-bearing: passes — The paper’s conclusions depend on it.
- Based: passes — The paper gives a reason why it holds.
It may state two separate claims as one.
What the paper did — it cites no source for this, so there is none to check. The quote shows it is in the paper.
In the paper
“Sequencing depth was roughly 1 order of magnitude lower compared to HMP datasets hampering accurate analyses.”
§ Uncovering the trimethylamine-producing bacteria of the human gut microbiota > Results > Screening of metagenomes for TMA-producing catabolic genes
plaindirect- Asserted: passes — The authors put it forward as true.
- Checkable: passes — It can be checked against evidence.
- Load-bearing: passes — The paper’s conclusions depend on it.
- Based: passes — The paper gives a reason why it holds.
It may state two separate claims as one.
What the paper did — it cites no source for this, so there is none to check. The quote shows it is in the paper.
In the paper
“Similar to cutC, the chosen HMM similarity cutoff was set at an obvious HMM score drop that, however, correlated less strongly with other parameters investigated in comparison with the cutC analysis shown above.”
§ Uncovering the trimethylamine-producing bacteria of the human gut microbiota > Results > Establishing databases for cutC and cntA
plaincorrelational- Asserted: passes — The authors put it forward as true.
- Checkable: passes — It can be checked against evidence.
- Load-bearing: unclear — It is unclear whether the paper’s conclusions depend on it.
- Based: passes — The paper gives a reason why it holds.
It may state two separate claims as one.
What the paper did — it cites no source for this, so there is none to check. The quote shows it is in the paper.
In the paper
“Specifically, 34 lower-scoring sequences from Bacilli are neither in close phylogenetic relation to the top-scoring sequences nor do they exhibit syntenic cntB sequences and were, hence, not considered as true cntA”
§ Uncovering the trimethylamine-producing bacteria of the human gut microbiota > Results > Establishing databases for cutC and cntA
plain- Asserted: passes — The authors put it forward as true.
- Checkable: passes — It can be checked against evidence.
- Load-bearing: unclear — It is unclear whether the paper’s conclusions depend on it.
- Based: passes — The paper gives a reason why it holds.
It may state two separate claims as one.
A conclusion the paper draws from its own results — it cites no other source for it, so there is none to check. The quote shows it is in the paper.
In the paper
“Overall, Clostridium XIVa cutC protein sequences form a monophyletic clade (Additional file 1), where phylogenetic relations, with a few exceptions such as Clostridium phytofermentans, Clostridium sp. AT5, and Dorea sp. 5-2, resemble those derived from 16S rRNA gene sequence analysis (Additional file 9B) suggesting a close linkage between host phylogeny and cutC gene evolution.”
§ Uncovering the trimethylamine-producing bacteria of the human gut microbiota > Results > Genomic analyses of Clostridium XIVa strains
hedgedcorrelational- Asserted: passes — The authors put it forward as true.
- Checkable: passes — It can be checked against evidence.
- Load-bearing: passes — The paper’s conclusions depend on it.
- Based: passes — The paper gives a reason why it holds.
It may state two separate claims as one.
What the paper did — it cites no source for this, so there is none to check. The quote shows it is in the paper.
In the paper
“Based on genomic sequences that were used as standards in the developed assays (see the “Methods” section), a quantification limit of 5 × 10³ genome copies per reaction for both genes was determined. Below those concentrations, the formation of primer dimers did not allow for accurate target enumeration (Additional file 3A, B).”
§ Uncovering the trimethylamine-producing bacteria of the human gut microbiota > Results > Gene-targeted assays to investigate the TMA-producing community
plaindirect- Asserted: passes — The authors put it forward as true.
- Checkable: passes — It can be checked against evidence.
- Load-bearing: unclear — It is unclear whether the paper’s conclusions depend on it.
- Based: passes — The paper gives a reason why it holds.
It may state two separate claims as one.
What the paper did — it cites no source for this, so there is none to check. The quote shows it is in the paper.
In the paper
“For both genes, all tested synthetic sequences were amplified and, with a few exceptions, quantified at similar abundance levels (Additional file 3C, D ).”
§ Uncovering the trimethylamine-producing bacteria of the human gut microbiota > Results > Gene-targeted assays to investigate the TMA-producing community
plain- Asserted: passes — The authors put it forward as true.
- Checkable: passes — It can be checked against evidence.
- Load-bearing: passes — The paper’s conclusions depend on it.
- Based: passes — The paper gives a reason why it holds.
It may state two separate claims as one.
A conclusion the paper draws from its own results — it cites no other source for it, so there is none to check. The quote shows it is in the paper.
In the paper
“Given that 16S rRNA gene sequence analysis cannot adequately predict the TMA-producing potential (Additional file 7) and metagenomic data lack depth to satisfactorily resolve this low abundant functional community, the assays developed here represent the most proper technique to investigate intestinal TMA-producing communities.”
§ Uncovering the trimethylamine-producing bacteria of the human gut microbiota > Discussion
plain- Asserted: passes — The authors put it forward as true.
- Checkable: passes — It can be checked against evidence.
- Load-bearing: passes — The paper’s conclusions depend on it.
- Based: passes — The paper gives a reason why it holds.
It may state two separate claims as one.
What the paper did — it cites no source for this, so there is none to check. The quote shows it is in the paper.
In the paper
“In the cntA qPCR, two samples (10 and 19) showed a single unspecific band (sequencing confirmed them as non-target (data not shown)) and samples were, hence, not considered as positive for the gene; one sample displayed two bands.”
§ Uncovering the trimethylamine-producing bacteria of the human gut microbiota > Results > Gene-targeted assays to investigate the TMA-producing community
plainn = 2- Asserted: passes — The authors put it forward as true.
- Checkable: passes — It can be checked against evidence.
- Load-bearing: fails — The paper’s conclusions may not depend on it.
- Based: passes — The paper gives a reason why it holds.
Probably not a substantial claim. The paper’s conclusions may not depend on it. It may state two separate claims as one.
A conclusion the paper draws from its own results — it cites no other source for it, so there is none to check. The quote shows it is in the paper.
In the paper
“Thus, due to the low abundance of bacteria encoding a TMA-producing potential, sequencing depth was not enough to ensure adequate coverage for assembly (the BLAST searches yielded on average only 56 and 13 reads for cutC and cutD, respectively), even for HMP datasets where an ample amount of reads (on average >108) is provided.”
§ Uncovering the trimethylamine-producing bacteria of the human gut microbiota > Results > Screening of metagenomes for TMA-producing catabolic genes
plaindirect- Asserted: passes — The authors put it forward as true.
- Checkable: passes — It can be checked against evidence.
- Load-bearing: passes — The paper’s conclusions depend on it.
- Based: passes — The paper gives a reason why it holds.
It may state two separate claims as one.
What the paper did — it cites no source for this, so there is none to check. The quote shows it is in the paper.
In the paper
“Our developed assays are applicable in high throughput”
§ Uncovering the trimethylamine-producing bacteria of the human gut microbiota > Discussion
plain- Asserted: passes — The authors put it forward as true.
- Checkable: passes — It can be checked against evidence.
- Load-bearing: fails — The paper’s conclusions may not depend on it.
- Based: fails — The paper may give no reason why it holds.
Probably not a substantial claim. The paper’s conclusions may not depend on it. The paper may give no reason why it holds.
The paper states this without a source or data behind it here, so there is nothing to check it against. The quote shows it is in the paper.
In the paper
“a nutrition that is rich in animal-derived products delivers both essential amino acids required for growth and high concentrations of the main TMA precursors choline and carnitine”
§ Uncovering the trimethylamine-producing bacteria of the human gut microbiota > Discussion
plaindirect- Asserted: passes — The authors put it forward as true.
- Checkable: passes — It can be checked against evidence.
- Load-bearing: passes — The paper’s conclusions depend on it.
- Based: passes — The paper gives a reason why it holds.
It may state two separate claims as one.
What the paper did — it cites no source for this, so there is none to check. The quote shows it is in the paper.
In the paper
“though the methodology used, i.e., metagenomics, provided only limited insights and together with a low sample size it did not allow for extraction of statistically significant results (Additional file 8)”
§ Uncovering the trimethylamine-producing bacteria of the human gut microbiota > Discussion
plain- Asserted: passes — The authors put it forward as true.
- Checkable: passes — It can be checked against evidence.
- Load-bearing: passes — The paper’s conclusions depend on it.
- Based: passes — The paper gives a reason why it holds.
It may state two separate claims as one.
A conclusion the paper draws from its own results — it cites no other source for it, so there is none to check. The quote shows it is in the paper.
In the paper
“may assist the design of subject-specific therapies that prevent TMA synthesis and the development of disease”
§ Uncovering the trimethylamine-producing bacteria of the human gut microbiota > Conclusions
hedgedconditional- Asserted: passes — The authors put it forward as true.
- Checkable: fails — It may be too vague to check against evidence.
- Load-bearing: passes — The paper’s conclusions depend on it.
- Based: passes — The paper gives a reason why it holds.
Probably not a substantial claim. It may be too vague to check against evidence.
What the paper did — it cites no source for this, so there is none to check. The quote shows it is in the paper.
In the paper
“which allowed insights into the TMA-producing community from a diverse population, but hindered revealing specific host factors that govern its proliferation”
§ Uncovering the trimethylamine-producing bacteria of the human gut microbiota > Discussion
plaindirect- Asserted: passes — The authors put it forward as true.
- Checkable: passes — It can be checked against evidence.
- Load-bearing: passes — The paper’s conclusions depend on it.
- Based: passes — The paper gives a reason why it holds.
It may state two separate claims as one.
In the paper
“patients suffering from trimethylaminuria, where TMA accumulates in various body fluids, are often treated by adapting to a vegan diet in order to limit the intake of dietary animal products that promote TMA production such as egg yolk and various meats [15]”
§ Uncovering the trimethylamine-producing bacteria of the human gut microbiota > Discussion
What the sources say
- Not checked yetcites [15] Christodoulou J. Trimethylaminuria: an under-recognised and socially debilitating metabolic disorder. J Paediatr Child Health. 2012;48:2011–3. source
plaindirect- Asserted: passes — The authors put it forward as true.
- Checkable: passes — It can be checked against evidence.
- Load-bearing: fails — The paper’s conclusions may not depend on it.
- Based: passes — The paper gives a reason why it holds.
Probably not a substantial claim. The paper’s conclusions may not depend on it.
What the paper did — it cites no source for this, so there is none to check. The quote shows it is in the paper.
In the paper
“Only samples displaying both genes of a pathway were considered for analysis”
§ Uncovering the trimethylamine-producing bacteria of the human gut microbiota > Methods > Metagenomic analysis
plainn = 154- Asserted: passes — The authors put it forward as true.
- Checkable: passes — It can be checked against evidence.
- Load-bearing: passes — The paper’s conclusions depend on it.
- Based: passes — The paper gives a reason why it holds.
Probably not a substantial claim.
What the paper did — it cites no source for this, so there is none to check. The quote shows it is in the paper.
In the paper
“Results are expressed as averages of three independent experiments”
§ Uncovering the trimethylamine-producing bacteria of the human gut microbiota > Methods > Development of gene-targeted assays
plain- Asserted: passes — The authors put it forward as true.
- Checkable: passes — It can be checked against evidence.
- Load-bearing: fails — The paper’s conclusions may not depend on it.
- Based: passes — The paper gives a reason why it holds.
Probably not a substantial claim. The paper’s conclusions may not depend on it.
A conclusion the paper draws from its own results — it cites no other source for it, so there is none to check. The quote shows it is in the paper.
In the paper
“Results of the developed assays together with presented functional predictions of major taxa involved provide crucial information for uncovering factors limiting growth of TMA producers in the gut”
§ Uncovering the trimethylamine-producing bacteria of the human gut microbiota > Conclusions
boosted- Asserted: passes — The authors put it forward as true.
- Checkable: fails — It may be too vague to check against evidence.
- Load-bearing: passes — The paper’s conclusions depend on it.
- Based: passes — The paper gives a reason why it holds.
Probably not a substantial claim. It may be too vague to check against evidence.
In the paper
“To ensure adequate amplification, including taxa that were previously underrepresented using conventional primers that target the V1-2 region such as Bifidobacteria [29], a modified forward primer was used”
§ Uncovering the trimethylamine-producing bacteria of the human gut microbiota > Methods > 16S rRNA gene sequence profiling of samples
What the sources say
- Not checked yetcites [29] Walker AW, Martin JC, Scott P, Parkhill J, Flint HJ, Scott KP. 16S rRNA gene-based profiling of the human infant gut microbiota is strongly influenced by sample processing and PCR primer choice. Microbiome. 2015;3:26. source
plaindirect- Asserted: passes — The authors put it forward as true.
- Checkable: passes — It can be checked against evidence.
- Load-bearing: passes — The paper’s conclusions depend on it.
- Based: passes — The paper gives a reason why it holds.
Probably not a substantial claim.
In the paper
“a correlation between dietary habits and production of TMAO was previously established”
§ Uncovering the trimethylamine-producing bacteria of the human gut microbiota > Discussion
What the sources say
- Not checked yetcites [5] Koeth R, Wang Z, Levison BS, Buffa J, Org E, Sheehy BT, et al. Intestinal microbiota metabolism of L-carnitine, a nutrient in red meat, promotes atherosclerosis. Nat Med. 2013;19:576–85. source
plaincorrelational- Asserted: passes — The authors put it forward as true.
- Checkable: passes — It can be checked against evidence.
- Load-bearing: fails — The paper’s conclusions may not depend on it.
- Based: passes — The paper gives a reason why it holds.
Probably not a substantial claim. The paper’s conclusions may not depend on it.
What the paper did — it cites no source for this, so there is none to check. The quote shows it is in the paper.
In the paper
“Only clusters that exhibit ≥5 sequence counts were considered, and the data was rarified to equal depth”
§ Uncovering the trimethylamine-producing bacteria of the human gut microbiota > Methods > Bioinformatic procedures for amplicon analysis
plain- Asserted: passes — The authors put it forward as true.
- Checkable: passes — It can be checked against evidence.
- Load-bearing: fails — The paper’s conclusions may not depend on it.
- Based: passes — The paper gives a reason why it holds.
Probably not a substantial claim. The paper’s conclusions may not depend on it. It may state two separate claims as one.
What the paper did — it cites no source for this, so there is none to check. The quote shows it is in the paper.
In the paper
“this cycle was repeated three times to ensure construction of robust models”
§ Uncovering the trimethylamine-producing bacteria of the human gut microbiota > Methods > Constructing the databases
plain- Asserted: passes — The authors put it forward as true.
- Checkable: passes — It can be checked against evidence.
- Load-bearing: fails — The paper’s conclusions may not depend on it.
- Based: passes — The paper gives a reason why it holds.
Probably not a substantial claim. The paper’s conclusions may not depend on it.
What the paper did — it cites no source for this, so there is none to check. The quote shows it is in the paper.
In the paper
“For cntA, sample 3 was omitted as >99% of obtained sequences (from 13,095) failed FrameBot analysis”
§ Uncovering the trimethylamine-producing bacteria of the human gut microbiota > Methods > Bioinformatic procedures for amplicon analysis
plaindirectSingle case- Asserted: passes — The authors put it forward as true.
- Checkable: passes — It can be checked against evidence.
- Load-bearing: fails — The paper’s conclusions may not depend on it.
- Based: passes — The paper gives a reason why it holds.
Probably not a substantial claim. The paper’s conclusions may not depend on it.
What the paper did — it cites no source for this, so there is none to check. The quote shows it is in the paper.
In the paper
“Top hits (based on e-value) that covered ≥70 bp and displayed ≥70% identity to a reference were considered for analysis where both genes of each pathway had to be detected for a positive result”
§ Uncovering the trimethylamine-producing bacteria of the human gut microbiota > Methods > Metagenomic analysis
plainn = 154- Asserted: passes — The authors put it forward as true.
- Checkable: passes — It can be checked against evidence.
- Load-bearing: passes — The paper’s conclusions depend on it.
- Based: passes — The paper gives a reason why it holds.
Probably not a substantial claim. It may state two separate claims as one.
What the paper did — it cites no source for this, so there is none to check. The quote shows it is in the paper.
In the paper
“we only targeted the TMA-producing potential by quantifying respective gene abundances, and no investigations on gene expression/TMA production were performed”
§ Uncovering the trimethylamine-producing bacteria of the human gut microbiota > Discussion
plain- Asserted: passes — The authors put it forward as true.
- Checkable: passes — It can be checked against evidence.
- Load-bearing: passes — The paper’s conclusions depend on it.
- Based: passes — The paper gives a reason why it holds.
It may state two separate claims as one.
What the paper did — it cites no source for this, so there is none to check. The quote shows it is in the paper.
In the paper
“Only significant correlations (p < 0.01) displaying a ρ ≥ 0.5 and a false-discovery correction q-value <0.01 between clusters that were detected in at least 50% of samples were considered for analysis”
§ Uncovering the trimethylamine-producing bacteria of the human gut microbiota > Methods > Bioinformatic procedures for amplicon analysis
plaincorrelational- Asserted: passes — The authors put it forward as true.
- Checkable: passes — It can be checked against evidence.
- Load-bearing: passes — The paper’s conclusions depend on it.
- Based: passes — The paper gives a reason why it holds.
Probably not a substantial claim.
The paper relies on this without support.
The TMA-producing communities in fecal samples are representative of the colonic TMA-producing communities in humans.
“The developed assays were used to characterize the TMA-producing communities in the fecal samples of 50 individuals.”
The paper relies on this without support.
A nutrition rich in animal-derived products delivers both essential amino acids required for growth and high concentrations of the main TMA precursors choline and carnitine.
“a nutrition that is rich in animal-derived products delivers both essential amino acids required for growth and high concentrations of the main TMA precursors choline and carnitine”
The paper relies on this without support.
Most bacteria, including those belonging to Clostridium XIVa as well as main cntA-containing taxa, are able to utilize a multitude of energy sources in vivo.
“Most bacteria, also those belonging to Clostridium XIVa as well as main cntA-containing taxa are able to utilize a multitude of energy sources in vivo”
The paper relies on this without support.
Major health-promoting butyrate producers previously classified as belonging to Clostridium XIVa such as Eubacterium rectale and Roseburia represent members of other genera that do not comprise any known CutC-encoding strains.
“major health-promoting butyrate producers previously classified as belonging to Clostridium XIVa such as Eubacterium rectale and Roseburia represent members of other genera that does not comprise any known CutC-encoding strains”
Claims other papers make about this one
Each is checked against this paper’s own text: does it say what the citing paper says it does?
The cited source doesn’t support the claim as written.
In the citing paper
“it was only present in 26% of individuals”
From Gut reactions: Breaking down xenobiotic–microbiome interactions (2019) · cites this paper as Rath et al., 2017
Checked by a reasoning model — may be wrong.
Experimental — accuracy not yet measured
Self-check
Percentages, sums and reported differences re-computed from the paper’s own numbers.
Each contradiction between two passages listed here was confirmed by an independent check.
Rated minor: it would not touch a result — a value no result rests on, a p-value that stays on the same side of the significance level, or a conflict that is clerical, resolved elsewhere in the paper, or outside its own findings.
In the paper
§ Uncovering the trimethylamine-producing bacteria of the human gut microbiota > Methods > Development of gene-targeted assays
“total combinations—cutC_F, 32; cutC_R, 16; cntA_F, 32; cntA_R, 512; 16S_F, 32; 16S_R, 1”
§ Uncovering the trimethylamine-producing bacteria of the human gut microbiota > Methods > Development of gene-targeted assays
“| 16S | AGRGTTHGATYMTGGCTCAG | TGCTGCCTCCCGTAGGAGT |”
Citations
Cites
phyloseq: An R Package for Reproducible Interactive Analysis and Graphics of Microbiome Census Data
McMurdie, P. J., & Holmes, S. (2013) · PLoS ONE · doi:10.1371/journal.pone.0061217 · Cited by 21,942
Naive Bayesian Classifier for Rapid Assignment of rRNA Sequences into the New Bacterial Taxonomy
Wang, Q., Garrity, G. M., Tiedje, J. M., & Cole, J. R. (2007) · Applied and Environmental Microbiology · doi:10.1128/aem.00062-07 · Cited by 20,145
FastTree 2 – Approximately Maximum-Likelihood Trees for Large Alignments
Price, M. N., Dehal, P. S., & Arkin, A. P. (2010) · PLoS ONE · doi:10.1371/journal.pone.0009490 · Cited by 14,894
Muyzer, G., de Waal, E. C., & Uitterlinden, A. G. (1993) · Applied and Environmental Microbiology · doi:10.1128/aem.59.3.695-700.1993 · Cited by 11,490
Enterotypes of the human gut microbiome
MetaHIT Consortium (additional members), Arumugam, M., Raes, J., Pelletier, E., Le Paslier, D., Yamada, T., Mende, D. R., Fernandes, G. R., Tap, J., Bruls, T., et al. (2011) · Nature · doi:10.1038/nature09944 · Cited by 7,548
Gut flora metabolism of phosphatidylcholine promotes cardiovascular disease
Wang, Z., Klipfell, E., Bennett, B. J., Koeth, R., Levison, B. S., DuGar, B., Feldstein, A. E., Britt, E. B., Fu, X., Chung, Y.-M., et al. (2011) · Nature · doi:10.1038/nature09922 · Cited by 5,597
Ribosomal Database Project: data and tools for high throughput rRNA analysis
Cole, J. R., Wang, Q., Fish, J. A., Chai, B., McGarrell, D. M., Sun, Y., Brown, C. T., Porras‐Alfaro, A., Kuske, C. R., & Tiedje, J. M. (2013) · Nucleic Acids Research · doi:10.1093/nar/gkt1244 · Cited by 4,480
Intestinal microbiota metabolism of l-carnitine, a nutrient in red meat, promotes atherosclerosis
Koeth, R. A., Wang, Z., Levison, B. S., Buffa, J. A., Org, E., Sheehy, B. T., Britt, E. B., Fu, X., Wu, Y., Li, L., et al. (2013) · Nature Medicine · doi:10.1038/nm.3145 · Cited by 4,386
Intestinal microbial metabolism of phosphatidylcholine and cardiovascular risk
Tang, W. H. W., Wang, Z., Levison, B. S., Koeth, R. A., Britt, E. B., Fu, X., Wu, Y., & Hazen, S. L. (2013) · New England Journal of Medicine · doi:10.1056/nejmoa1109400 · Cited by 3,400
A framework for human microbiome research
The Human Microbiome Project Consortium (2012) · Nature · doi:10.1038/nature11209 · Cited by 2,650
Cited by
Sorted by citations
Beghini, F., McIver, L. J., Blanco-Míguez, A., Dubois, L., Asnicar, F., Maharjan, S., Mailyan, A., Manghi, P., Scholz, M., Thomas, A. M., et al. (2021) · eLife · doi:10.7554/elife.65088 · Cited by 2,303
Oliphant, K., & Allen-Vercoe, E. (2019) · Microbiome · doi:10.1186/s40168-019-0704-8 · Cited by 1,327
Metabolomics for Investigating Physiological and Pathophysiological Processes
Wishart, D. S. (2019) · Physiological Reviews · doi:10.1152/physrev.00035.2018 · Cited by 1,295
Gut Microbiome: Profound Implications for Diet and Disease
Hills, R. D., Pontefract, B., Mishcon, H. R., Black, C. A., Sutton, S. C., & Theberge, C. R. (2019) · Nutrients · doi:10.3390/nu11071613 · Cited by 1,143
Thomas, A. M., Manghi, P., Asnicar, F., Pasolli, E., Armanini, F., Zolfo, M., Beghini, F., Manara, S., Karcher, N., Pozzi, C., et al. (2019) · Nature Medicine · doi:10.1038/s41591-019-0405-7 · Cited by 1,030
Metadata
- Authors
- Rath, S., Heidrich, B., Pieper, D. H., & Vital, M.
- Affiliations
- Helmholtz Centre for Infection Research (DE)
- Medizinische Hochschule Hannover (DE)
- Corresponding author
- Vital, Marius
- Venue
- Microbiome
- Published
- 2017-05-15
- Volume
- 5
- Issue
- 1
- Pages
- 54-54
- ISSN
- 2049-2618 (ISSN-L)
- PMC
- PMC5433236
- OpenAlex
- W2612729422
- Cited by
- 515
- References
- 32
- Citations by year
- 2026: 51 · 2025: 65 · 2024: 75 · 2023: 57 · 2022: 65 · 2021: 69 · 2020: 48 · 2019: 45 · 2018: 31 · 2017: 8
- FWCI
- 14.74
- Type
- journal article
- Language
- en
- Open access
- gold
- doi.org
- Licence
- cc-by
- Locations
- Microbiome (publishedVersion, cc-by)
- Europe PMC (PubMed Central) (publishedVersion, cc-by)
- PubMed Central (publishedVersion, cc-by)
- PubMed (publishedVersion)
- HZI (Helmholtz Centre for Infection Research) (submittedVersion, cc-by-nc-sa)
- DOAJ (DOAJ: Directory of Open Access Journals) (submittedVersion)
- Topics
- Life Sciences › Biochemistry, Genetics and Molecular Biology › Molecular Biology › Gut microbiota and health
- Health Sciences › Dentistry › Periodontics › Oral microbiology and periodontitis research
- Physical Sciences › Environmental Science › Ecology › Microbial Community Ecology and Physiology
- Keywords
- trimethylamine, gut microbiota, CutC, quaternary amines, choline, L-carnitine, Clostridium XIVa, Escherichia coli, atherosclerosis, cardiovascular disease, metagenomics, Human Microbiome Project
- MeSH terms
- Gastrointestinal Microbiome, Bacteria, Bacterial Proteins, Feces, Humans, Methylamines, Phylogeny, Sequence Analysis, DNA, Biosynthetic Pathways, Metagenomics, Multilocus Sequence Typing
About these checks
Registry, retraction, Cites and statistics results are computed, not judged, with one exception: a printed reference that no index lists is read once by a model before it counts as a citation error. Claims are extracted by a model and kept only when their quote appears verbatim in the text; each cited source is then checked, with a model’s help, for whether it says what the claim relies on. Those verdicts can be wrong — read the claim’s quote and the cited source before relying on one.
A language model drew the claims from the paper on 2026-10-08, under version 3 of the claim definition (model deepseek-v4.1-flash, prompt extract-v3).
A second model labelled each claim on 2026-10-08 (model jev-1.13-20260917, definition revision gold-guideline-v0.2).
Statistics and arithmetic are recomputed, not judged.
Confidence bands are shown only for fields calibrated on our annotated test set. None is calibrated yet, so no band is shown.
What counts as a claim ›How we measure confidence ›How we check this ›
Are you an author, or do you see a problem with this page? Request a review
