

The DOI matches its Crossref record; 2 of the 2 references it cites were found in a registry or an index.
Increasing the power of interpretation for soil metaproteomics data
Abstract
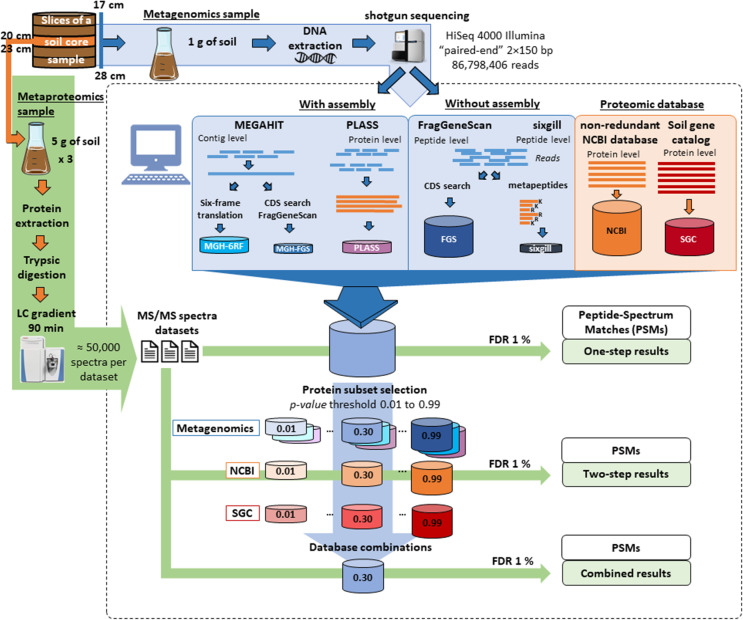
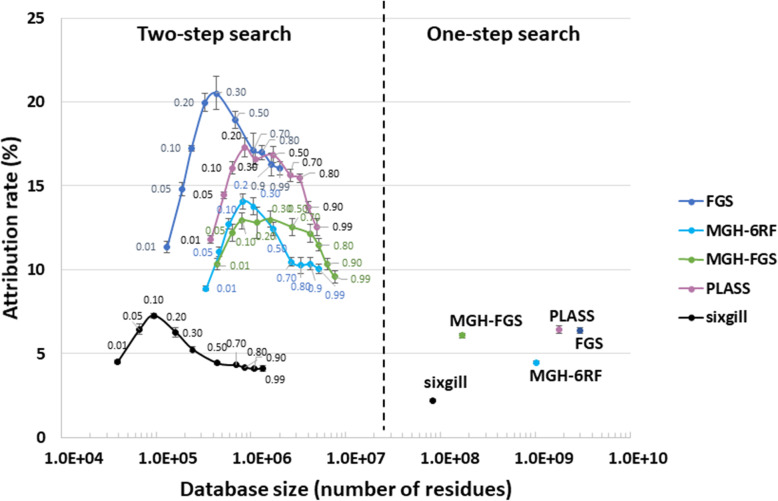
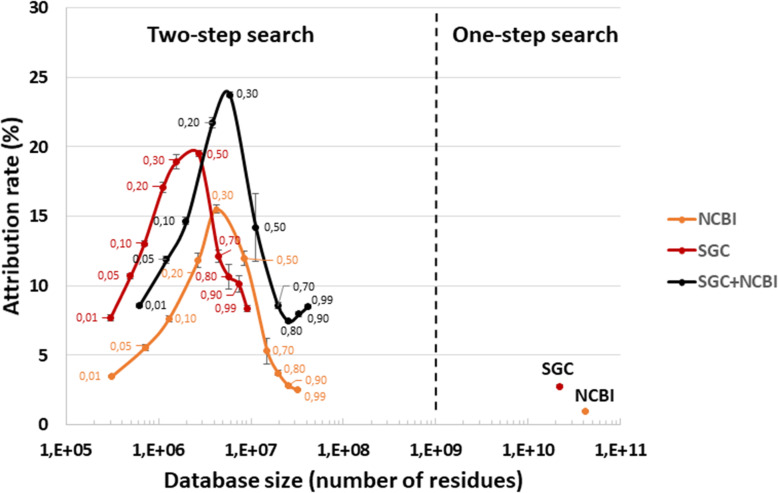
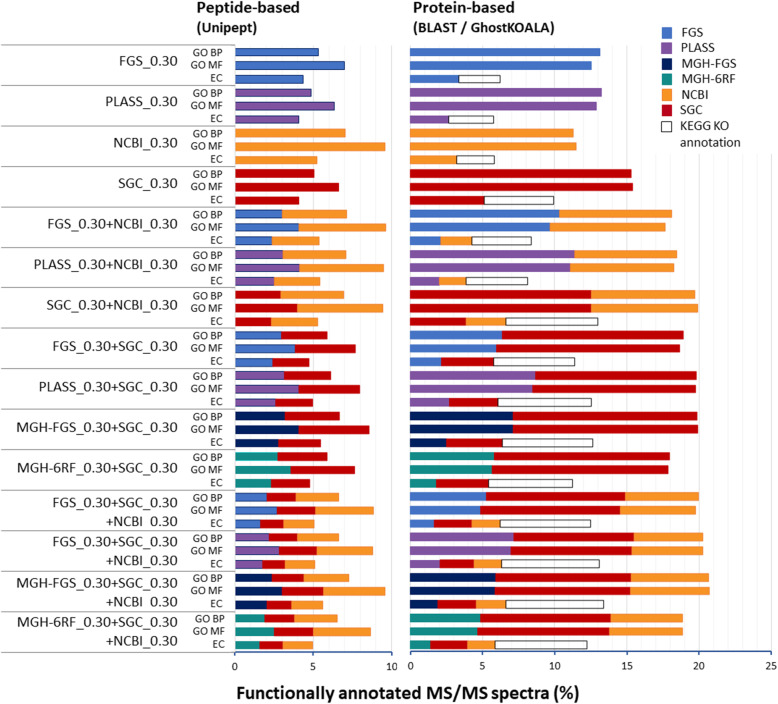
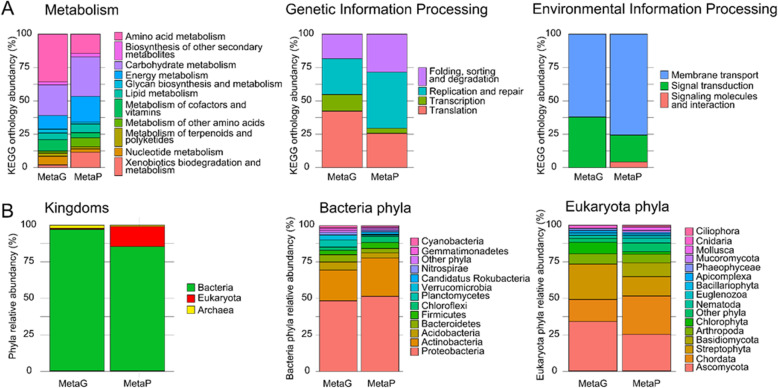
Background: Soil and sediment microorganisms are highly phylogenetically diverse but are currently largely under-represented in public molecular databases. Their functional characterization by means of metaproteomics is usually performed using metagenomic sequences acquired for the same sample. However, such hugely diverse metagenomic datasets are difficult to assemble; in parallel, theoretical proteomes from isolates available in generic databases are of high quality. Both these factors advocate for the use of theoretical proteomes in metaproteomics interpretation pipelines. Here, we examined a number of database construction strategies with a view to increasing the outputs of metaproteomics studies performed on soil samples. Results: The number of peptide-spectrum matches was found to be of comparable magnitude when using public or sample-specific metagenomics-derived databases. However, numbers were significantly increased when a combination of both types of information was used in a two-step cascaded search. Our data also indicate that the functional annotation of the metaproteomics dataset can be maximized by using a combination of both types of databases. Conclusions: A two-step strategy combining sample-specific metagenome database and public databases such as the non-redundant NCBI database and a massive soil gene catalog allows maximizing the metaproteomic interpretation both in terms of ratio of assigned spectra and retrieval of function-derived information.
Overview
The claims and statistics of this paper haven’t been checked yet.
Run the check — free, no account needed. It reads the open-access text and checks the sources it cites.
Integrity signals
Registry
Cites
Statistics
Figures
Verification
Claims the paper makes
The claims and statistics of this paper haven’t been checked yet.
Run the check — free, no account needed. It reads the open-access text and checks the sources it cites.
Claims other papers make about this one
Each is checked against this paper’s own text: does it say what the citing paper says it does?
The source backs part of the claim, not all of it — or backs it for a different population, condition or comparison.
In the citing paper
“This proportion corresponds to the expected ratio for samples of equivalent complexity analyzed in similar experimental conditions [10].”
From Metaproteomic analysis of King Ghezo tomb wall (Abomey, Benin) confirms 19th century voodoo sacrifices (2024) · cites this paper as [10]
Experimental — accuracy not yet measuredThe cited source says what the claim attributes to it.
In the citing paper
“Proteotyping of organisms based on tandem mass spectrometry data has been successfully used to identify bacteria [6, 7], and more complex medical microbiota [8, 9] or environmental microbiota [10].”
From Metaproteomic analysis of King Ghezo tomb wall (Abomey, Benin) confirms 19th century voodoo sacrifices (2024) · cites this paper as [10]
The check wasn’t confident either way, so it gives no verdict — never disputed.
In the citing paper
“This profile is atypical compared to a soil sample, that would contain fewer animal traces [10].”
From Metaproteomic analysis of King Ghezo tomb wall (Abomey, Benin) confirms 19th century voodoo sacrifices (2024) · cites this paper as [10]
Experimental — accuracy not yet measured
Self-check
Percentages, sums and reported differences re-computed from the paper’s own numbers.
The self-check needs the paper’s full text.
Citations
Cites
MetaQUAST: evaluation of metagenome assemblies
Mikheenko, A., Saveliev, V., & Gurevich, A. (2016) · Bioinformatics · doi:10.1093/bioinformatics/btv697 · Cited by 711
Protein-level assembly increases protein sequence recovery from metagenomic samples manyfold
Steinegger, M., Mirdita, M., & Söding, J. (2019) · Nature Methods · doi:10.1038/s41592-019-0437-4 · Cited by 445
Research works printed but not linked: 73
- Ayrault, S., M. Meybeck, J.-M. Mouchel, J. Gaspéri, L. Lestel, C. Lorgeoux and D. Boust (2019). Sedimentary archives reveal the concealed history of micropollutant contamination in the Seine River basin. Berlin, Heidelberg, Springer Berlin Heidelberg: 1-32. · DOI
- Ayrault S, Priadi CR, Evrard O, Lefevre I, Bonte P. Silver and thallium historical trends in the Seine River basin. J Environ Monit. 2010;12(11):2177–85. https://doi.org/10.1039/c0em00153h. · DOI · Paper page
- Ayrault S, Roy-Barman M, Le Cloarec MF, Priadi CR, Bonte P, Gopel C. Lead contamination of the Seine River, France: geochemical implications of a historical perspective. Chemosphere. 2012;87(8):902–10. https://doi.org/10.1016/j.chemosphere.2012.01.043. · DOI
- Bagnoud A, Chourey K, Hettich RL, de Bruijn I, Andersson AF, Leupin OX, et al. Reconstructing a hydrogen-driven microbial metabolic network in Opalinus Clay rock. Nat Commun. 2016;7(1):12770. https://doi.org/10.1038/ncomms12770. · DOI
- Bahram M, Hildebrand F, Forslund SK, Anderson JL, Soudzilovskaia NA, Bodegom PM, et al. Structure and function of the global topsoil microbiome. Nature. 2018;560(7717):233–7. https://doi.org/10.1038/s41586-018-0386-6. · DOI
- Bastida F, Jehmlich N, Martínez-Navarro J, Bayona V, García C, Moreno JL. The effects of struvite and sewage sludge on plant yield and the microbial community of a semiarid Mediterranean soil. Geoderma. 2019;337:1051–7. https://doi.org/10.1016/j.geoderma.2018.10.046. · DOI
- Bastida F, Torres IF, Moreno JL, Baldrian P, Ondono S, Ruiz-Navarro A, et al. The active microbial diversity drives ecosystem multifunctionality and is physiologically related to carbon availability in Mediterranean semi-arid soils. Mol Ecol. 2016;25(18):4660–73. https://doi.org/10.1111/mec.13783. · DOI
- Batut B, Gravouil K, Defois C, Hiltemann S, Brugere JF, Peyretaillade E, et al. ASaiM: a Galaxy-based framework to analyze microbiota data. Gigascience. 2018;7(6). https://doi.org/10.1093/gigascience/giy057. · DOI
- Becher D, Bernhardt J, Fuchs S, Riedel K. Metaproteomics to unravel major microbial players in leaf litter and soil environments: challenges and perspectives. Proteomics. 2013;13(18-19):2895–909. https://doi.org/10.1002/pmic.201300095. · DOI
- Buchfink B, Xie C, Huson DH. Fast and sensitive protein alignment using DIAMOND. Nat Methods. 2015;12(1):59–60. https://doi.org/10.1038/nmeth.3176. · DOI · Paper page
- Cernava T, Erlacher A, Aschenbrenner IA, Krug L, Lassek C, Riedel K, et al. Deciphering functional diversification within the lichen microbiota by meta-omics. Microbiome. 2017;5(1):82. https://doi.org/10.1186/s40168-017-0303-5. · DOI
- Cheng K, Ning Z, Zhang X, Li L, Liao B, Mayne J, et al. MetaLab: an automated pipeline for metaproteomic data analysis. Microbiome. 2017;5(1):157. https://doi.org/10.1186/s40168-017-0375-2. · DOI
- Chourey K, Nissen S, Vishnivetskaya T, Shah M, Pfiffner S, Hettich RL, et al. Environmental proteomics reveals early microbial community responses to biostimulation at a uranium- and nitrate-contaminated site. Proteomics. 2013;13(18-19):2921–30. https://doi.org/10.1002/pmic.201300155. · DOI
- Cogne Y, Gouveia D, Chaumot A, Degli-Esposti D, Geffard O, Pible O, et al. Proteogenomics-guided evaluation of RNA-Seq assembly and protein database construction for emergent model organisms. Proteomics. 2020;20(10):e1900261. https://doi.org/10.1002/pmic.201900261. · DOI
- Coute Y, Bruley C, Burger T. Beyond target-decoy competition: stable validation of peptide and protein identifications in mass spectrometry-based discovery proteomics. Anal Chem. 2020;92(22):14898–906. https://doi.org/10.1021/acs.analchem.0c00328. · DOI
- Ewels P, Magnusson M, Lundin S, Kaller M. MultiQC: summarize analysis results for multiple tools and samples in a single report. Bioinformatics. 2016;32(19):3047–8. https://doi.org/10.1093/bioinformatics/btw354. · DOI · Paper page
- Fierer N. Embracing the unknown: disentangling the complexities of the soil microbiome. Nat Rev Microbiol. 2017;15(10):579–90. https://doi.org/10.1038/nrmicro.2017.87. · DOI
- Gallois N, Alpha-Bazin B, Ortet P, Barakat M, Piette L, Long J, et al. Proteogenomic insights into uranium tolerance of a Chernobyl's microbacterium bacterial isolate. J Proteomics. 2018;177:148–57. https://doi.org/10.1016/j.jprot.2017.11.021. · DOI
- Glass JB, Yu H, Steele JA, Dawson KS, Sun S, Chourey K, et al. Geochemical, metagenomic and metaproteomic insights into trace metal utilization by methane-oxidizing microbial consortia in sulphidic marine sediments. Environ Microbiol. 2014;16(6):1592–611. https://doi.org/10.1111/1462-2920.12314. · DOI
- Gouveia D, Pible O, Culotta K, Jouffret V, Geffard O, Chaumot A, et al. Combining proteogenomics and metaproteomics for deep taxonomic and functional characterization of microbiomes from a non-sequenced host. NPJ Biofilms Microbiomes. 2020;6(1):23. https://doi.org/10.1038/s41522-020-0133-2. · DOI
- Gurdeep Singh R, Tanca A, Palomba A, Van der Jeugt F, Verschaffelt P, Uzzau S, et al. Unipept 4.0: functional analysis of metaproteome data. J Proteome Res. 2019;18(2):606–15. https://doi.org/10.1021/acs.jproteome.8b00716. · DOI
- Hartmann EM, Allain F, Gaillard JC, Pible O, Armengaud J. Taking the shortcut for high-throughput shotgun proteomic analysis of bacteria. Methods Mol Biol. 2014;1197:275–85. https://doi.org/10.1007/978-1-4939-1261-2_16. · DOI
- Henson J, Tischler G, Ning Z. Next-generation sequencing and large genome assemblies. Pharmacogenomics. 2012;13(8):901–15. https://doi.org/10.2217/pgs.12.72. · DOI
- Heyer R, Benndorf D, Kohrs F, De Vrieze J, Boon N, Hoffmann M, et al. Proteotyping of biogas plant microbiomes separates biogas plants according to process temperature and reactor type. Biotechnol Biofuels. 2016;9(1):155. https://doi.org/10.1186/s13068-016-0572-4. · DOI
- Heyer R, Schallert K, Zoun R, Becher B, Saake G, Benndorf D. Challenges and perspectives of metaproteomic data analysis. J Biotechnol. 2017;261:24–36. https://doi.org/10.1016/j.jbiotec.2017.06.1201. · DOI
- Hubler SL, Kumar P, Mehta S, Easterly C, Johnson JE, Jagtap PD, et al. Challenges in peptide-spectrum matching: a robust and reproducible statistical framework for removing low-accuracy, high-scoring hits. J Proteome Res. 2020;19(1):161–73. https://doi.org/10.1021/acs.jproteome.9b00478. · DOI
- Hultman J, Waldrop MP, Mackelprang R, David MM, McFarland J, Blazewicz SJ, et al. Multi-omics of permafrost, active layer and thermokarst bog soil microbiomes. Nature. 2015;521(7551):208–12. https://doi.org/10.1038/nature14238. · DOI
- Jagtap P, Goslinga J, Kooren JA, McGowan T, Wroblewski MS, Seymour SL, et al. A two-step database search method improves sensitivity in peptide sequence matches for metaproteomics and proteogenomics studies. Proteomics. 2013;13(8):1352–7. https://doi.org/10.1002/pmic.201200352. · DOI
- Jansson JK, Hofmockel KS. Soil microbiomes and climate change. Nat Rev Microbiol. 2020;18(1):35–46. https://doi.org/10.1038/s41579-019-0265-7. · DOI
- Johnson-Rollings AS, Wright H, Masciandaro G, Macci C, Doni S, Calvo-Bado LA, et al. Exploring the functional soil-microbe interface and exoenzymes through soil metaexoproteomics. ISME J. 2014;8(10):2148–50. https://doi.org/10.1038/ismej.2014.130. · DOI
- Kanehisa M, Sato Y, Morishima K. BlastKOALA and GhostKOALA: KEGG Tools for Functional Characterization of Genome and Metagenome Sequences. J Mol Biol. 2016;428(4):726–31. https://doi.org/10.1016/j.jmb.2015.11.006. · DOI
- Keiblinger KM, Wilhartitz IC, Schneider T, Roschitzki B, Schmid E, Eberl L, et al. Soil metaproteomics - comparative evaluation of protein extraction protocols. Soil Biol Biochem. 2012;54(15-10):14–24. https://doi.org/10.1016/j.soilbio.2012.05.014. · DOI
- Klein G, Mathe C, Biola-Clier M, Devineau S, Drouineau E, Hatem E, et al. RNA-binding proteins are a major target of silica nanoparticles in cell extracts. Nanotoxicology. 2016;10(10):1555–64. https://doi.org/10.1080/17435390.2016.1244299. · DOI
- Kleiner, M. (2019). "Metaproteomics: much more than measuring gene expression in microbial communities." mSystems 4(3). · DOI
- Kroeger ME, Delmont TO, Eren AM, Meyer KM, Guo J, Khan K, et al. New biological insights into how deforestation in Amazonia affects soil microbial communities using metagenomics and metagenome-assembled genomes. Front Microbiol. 2018;9:1635. https://doi.org/10.3389/fmicb.2018.01635. · DOI
- Langmead B, Salzberg SL. Fast gapped-read alignment with Bowtie 2. Nat Methods. 2012;9(4):357–9. https://doi.org/10.1038/nmeth.1923. · DOI · Paper page
- Le Cloarec MF, Bonte PH, Lestel L, Lefèvre I, Ayrault S. Sedimentary record of metal contamination in the Seine River during the last century. Physics and Chemistry of the Earth, Parts A/B/C. 2011;36(12):515–29. https://doi.org/10.1016/j.pce.2009.02.003. · DOI · Paper page
- Li D, Luo R, Liu CM, Leung CM, Ting HF, Sadakane K, et al. MEGAHIT v1.0: A fast and scalable metagenome assembler driven by advanced methodologies and community practices. Methods. 2016;102:3–11. https://doi.org/10.1016/j.ymeth.2016.02.020. · DOI
- Lin W, Wu L, Lin S, Zhang A, Zhou M, Lin R, et al. Metaproteomic analysis of ratoon sugarcane rhizospheric soil. BMC Microbiol. 2013;13(1):135. https://doi.org/10.1186/1471-2180-13-135. · DOI
- Liu D, Keiblinger KM, Leitner S, Wegner U, Zimmermann M, Fuchs S, et al. Response of microbial communities and their metabolic functions to drying(-)rewetting stress in a temperate forest soil. Microorganisms. 2019;7(5). https://doi.org/10.3390/microorganisms7050129. · DOI
- Lorgeoux C, Moilleron R, Gasperi J, Ayrault S, Bonte P, Lefevre I, et al. Temporal trends of persistent organic pollutants in dated sediment cores: chemical fingerprinting of the anthropogenic impacts in the Seine River basin, Paris. Sci Total Environ. 2016;541:1355–63. https://doi.org/10.1016/j.scitotenv.2015.09.147. · DOI
- May DH, Timmins-Schiffman E, Mikan MP, Harvey HR, Borenstein E, Nunn BL, et al. An alignment-free "metapeptide" strategy for metaproteomic characterization of microbiome samples using shotgun metagenomic sequencing. J Proteome Res. 2016;15(8):2697–705. https://doi.org/10.1021/acs.jproteome.6b00239. · DOI
- Mesuere B, Debyser G, Aerts M, Devreese B, Vandamme P, Dawyndt P. The Unipept metaproteomics analysis pipeline. Proteomics. 2015;15(8):1437–42. https://doi.org/10.1002/pmic.201400361. · DOI
- Meyer F, Paarmann D, D'Souza M, Olson R, Glass EM, Kubal M, et al. The metagenomics RAST server - a public resource for the automatic phylogenetic and functional analysis of metagenomes. BMC Bioinformatics. 2008;9(1):386. https://doi.org/10.1186/1471-2105-9-386. · DOI
- Mirdita M, von den Driesch L, Galiez C, Martin MJ, Soding J, Steinegger M. Uniclust databases of clustered and deeply annotated protein sequences and alignments. Nucleic Acids Res. 2017;45(D1):D170–6. https://doi.org/10.1093/nar/gkw1081. · DOI
- Murray, A. E., J. Freudenstein, S. Gribaldo, R. Hatzenpichler, P. Hugenholtz, P. Kampfer, K. T. Konstantinidis, C. E. Lane, R. T. Papke, D. H. Parks, R. Rossello-Mora, M. B. Stott, I. C. Sutcliffe, J. C. Thrash, S. N. Venter, W. B. Whitman, S. G. Acinas, R. I. Amann, K. Anantharaman, J. Armengaud, B. J. Baker, R. A. Barco, H. B. Bode, E. S. Boyd, C. L. Brady, P. Carini, P. S. G. Chain, D. R. Colman, K. M. DeAngelis, M. A. de Los Rios, P. Estrada-de Los Santos, C. A. Dunlap, J. A. Eisen, D. Emerson, T. J. G. Ettema, D. Eveillard, P. R. Girguis, U. Hentschel, J. T. Hollibaugh, L. A. Hug, W. P. Inskeep, E. P. Ivanova, H. P. Klenk, W. J. Li, K. G. Lloyd, F. E. Loffler, T. P. Makhalanyane, D. P. Moser, T. Nunoura, M. Palmer, V. Parro, C. Pedros-Alio, A. J. Probst, T. H. M. Smits, A. D. Steen, E. T. Steenkamp, A. Spang, F. J. Stewart, J. M. Tiedje, P. Vandamme, M. Wagner, F. P. Wang, P. Yarza, B. P. Hedlund and A. L. Reysenbach (2020). "Roadmap for naming uncultivated Archaea and bacteria." Nat Microbiol 5(8): 987-994, DOI: https://doi.org/10.1038/s41564-020-0733-x. · DOI
- Muth T, Kolmeder CA, Salojärvi J, keskitalo S, Varjosalo M, Verdam FJ, Rensen SS, Reichl U, de Vos WM, Rapp E, Martens L. "Navigating through metaproteomics data: a logbook of database searching." Proteomics. 2015;15(20):3439–53. · DOI
- Muth T, Renard BY, Martens L. Metaproteomic data analysis at a glance: advances in computational microbial community proteomics. Expert Rev Proteomics. 2016;13(8):757–69. https://doi.org/10.1080/14789450.2016.1209418. · DOI
- Orellana LH, Hatt JK, Iyer R, Chourey K, Hettich RL, Spain JC, et al. Comparing DNA, RNA and protein levels for measuring microbial dynamics in soil microcosms amended with nitrogen fertilizer. Sci Rep. 2019;9(1):17630. https://doi.org/10.1038/s41598-019-53679-0. · DOI
- Parks DH, Rinke C, Chuvochina M, Chaumeil PA, Woodcroft BJ, Evans PN, et al. Recovery of nearly 8,000 metagenome-assembled genomes substantially expands the tree of life. Nat Microbiol. 2017;2(11):1533–42. https://doi.org/10.1038/s41564-017-0012-7. · DOI · Paper page
- Pible O, Allain F, Jouffret V, Culotta K, Miotello G, Armengaud J. Estimating relative biomasses of organisms in microbiota using "phylopeptidomics". Microbiome. 2020;8(1):30. https://doi.org/10.1186/s40168-020-00797-x. · DOI
- Ram RJ, Verberkmoes NC, Thelen MP, Tyson GW, Baker BJ, Blake RC 2nd, et al. Community proteomics of a natural microbial biofilm. Science. 2005;308(5730):1915–20. https://doi.org/10.1126/science.1109070. · DOI
- Rho M, Tang H, Ye Y. FragGeneScan: predicting genes in short and error-prone reads. Nucleic Acids Res. 2010;38(20):e191. https://doi.org/10.1093/nar/gkq747. · DOI
- Schneider T, Keiblinger KM, Schmid E, Sterflinger-Gleixner K, Ellersdorfer G, Roschitzki B, et al. Who is who in litter decomposition? Metaproteomics reveals major microbial players and their biogeochemical functions. ISME J. 2012;6(9):1749–62. https://doi.org/10.1038/ismej.2012.11. · DOI
- Seifert J, Muth T. Editorial for special issue: metaproteomics. Proteomes. 2019;7(1). https://doi.org/10.3390/proteomes7010009. · DOI
- Stamboulian M, Li S, Ye Y. Using high-abundance proteins as guides for fast and effective peptide/protein identification from human gut metaproteomic data. Microbiome. 2021;9(1):80. https://doi.org/10.1186/s40168-021-01035-8. · DOI
- Starke R, Jehmlich N, Bastida F. Using proteins to study how microbes contribute to soil ecosystem services: the current state and future perspectives of soil metaproteomics. J Proteomics. 2019;198:50–8. https://doi.org/10.1016/j.jprot.2018.11.011. · DOI
- Starr AE, Deeke SA, Li L, Zhang X, Daoud R, Ryan J, et al. Proteomic and metaproteomic approaches to understand host-microbe interactions. Anal Chem. 2018;90(1):86–109. https://doi.org/10.1021/acs.analchem.7b04340. · DOI
- Tanca A, Palomba A, Deligios M, Cubeddu T, Fraumene C, Biosa G, et al. Evaluating the impact of different sequence databases on metaproteome analysis: insights from a lab-assembled microbial mixture. PLoS One. 2013;8(12):e82981. https://doi.org/10.1371/journal.pone.0082981. · DOI
- Tanca A, Palomba A, Fraumene C, Pagnozzi D, Manghina V, Deligios M, et al. The impact of sequence database choice on metaproteomic results in gut microbiota studies. Microbiome. 2016;4(1):51. https://doi.org/10.1186/s40168-016-0196-8. · DOI
- Tartaglia M, Bastida F, Sciarrillo R, Guarino C. Soil metaproteomics for the study of the relationships between microorganisms and plants: a review of extraction protocols and ecological insights. Int J Mol Sci. 2020;21(22). https://doi.org/10.3390/ijms21228455. · DOI
- Taubert M, Grob C, Crombie A, Howat AM, Burns OJ, Weber M, et al. Communal metabolism by methylococcaceae and methylophilaceae is driving rapid aerobic methane oxidation in sediments of a shallow seep near Elba, Italy. Environ Microbiol. 2019;21(10):3780–95. https://doi.org/10.1111/1462-2920.14728. · DOI
- Terrat S, Christen R, Dequiedt S, Lelievre M, Nowak V, Regnier T, et al. Molecular biomass and MetaTaxogenomic assessment of soil microbial communities as influenced by soil DNA extraction procedure. Microb Biotechnol. 2012;5(1):135–41. https://doi.org/10.1111/j.1751-7915.2011.00307.x. · DOI
- Trapp J, Almunia C, Gaillard JC, Pible O, Chaumot A, Geffard O, et al. Proteogenomic insights into the core-proteome of female reproductive tissues from crustacean amphipods. J Proteomics. 2016;135:51–61. https://doi.org/10.1016/j.jprot.2015.06.017. · DOI
- Van Den Bossche T, Kunath B, Schallert K, Schäpe S Abraham P, Armengaud J, Arntzen M, Bassignanin A, Benndorf D, Fuchs S, et al. "Critical Assessment of Metaproteome Investigation (CAMPI): A Multi-Lab Comparison of Established Workflows." BioRxiV. 2021. https://doi.org/10.1101/2021.03.05.433915. · DOI
- Wang HB, Zhang ZX, Li H, He HB, Fang CX, Zhang AJ, et al. Characterization of metaproteomics in crop rhizospheric soil. J Proteome Res. 2011;10(3):932–40. https://doi.org/10.1021/pr100981r. · DOI
- Wang Z, Wang Y, Fuhrman JA, Sun F, Zhu S. Assessment of metagenomic assemblers based on hybrid reads of real and simulated metagenomic sequences. Brief Bioinform. 2020;21(3):777–90. https://doi.org/10.1093/bib/bbz025. · DOI
- Wilmes P, Heintz-Buschart A, Bond PL. A decade of metaproteomics: where we stand and what the future holds. Proteomics. 2015;15(20):3409–17. https://doi.org/10.1002/pmic.201500183. · DOI
- Wilpiszeski RL, Aufrecht JA, Retterer ST, Sullivan MB, Graham DE, Pierce EM, et al. Soil aggregate microbial communities: towards understanding microbiome interactions at biologically relevant scales. Appl Environ Microbiol. 2019;85(14). https://doi.org/10.1128/AEM.00324-19. · DOI
- Wu L, Wang H, Zhang Z, Lin R, Zhang Z, Lin W. Comparative metaproteomic analysis on consecutively Rehmannia glutinosa-monocultured rhizosphere soil. PLoS One. 2011;6(5):e20611. https://doi.org/10.1371/journal.pone.0020611. · DOI
- Xiao J, Tanca A, Jia B, Yang R, Wang B, Zhang Y, et al. Metagenomic taxonomy-guided database-searching strategy for improving metaproteomic analysis. J Proteome Res. 2018;17(4):1596–605. https://doi.org/10.1021/acs.jproteome.7b00894. · DOI
- Yao Q, Li Z, Song Y, Wright SJ, Guo X, Tringe SG, et al. Community proteogenomics reveals the systemic impact of phosphorus availability on microbial functions in tropical soil. Nat Ecol Evol. 2018;2(3):499–509. https://doi.org/10.1038/s41559-017-0463-5. · DOI
- Zampieri E, Chiapello M, Daghino S, Bonfante P, Mello A. Soil metaproteomics reveals an inter-kingdom stress response to the presence of black truffles. Sci Rep. 2016;6(1):25773. https://doi.org/10.1038/srep25773. · DOI
Cited by
Sorted by citations
Charlier, P., Bourdin, V., N'Dah, D., Kielbasa, M., Pible, O., & Armengaud, J. (2024) · PROTEOMICS · doi:10.1002/pmic.202400048 · Cited by 8
Self-citation
Metadata
- Authors
- Jouffret, V., Miotello, G., Culotta, K., Ayrault, S., Pible, O., & Armengaud, J.
- ORCID
- Armengaud, Jean
- Venue
- Microbiome
- Published
- 2021-09-29
- Volume
- 9
- Issue
- 1
- ISSN
- 2049-2618
- PMC
- PMC8482631
- Cited by
- 52
- References
- 2
- Language
- en
About these checks
Registry, retraction, Cites and statistics results are computed, not judged, with one exception: a printed reference that no index lists is read once by a model before it counts as a citation error. Claims are extracted by a model and kept only when their quote appears verbatim in the text; each cited source is then checked, with a model’s help, for whether it says what the claim relies on. Those verdicts can be wrong — read the claim’s quote and the cited source before relying on one.
Statistics and arithmetic are recomputed, not judged.
Confidence bands are shown only for fields calibrated on our annotated test set. None is calibrated yet, so no band is shown.
What counts as a claim ›How we measure confidence ›How we check this ›
Are you an author, or do you see a problem with this page? Request a review
How to cite
Cite CoChat for the checks on this page, and the paper for its own findings.
- This page
- CoChat. (2026). Citation check: Increasing the power of interpretation for soil metaproteomics data. https://app.cochat.ai/papers/10.1186/s40168-021-01139-1
- The paper
- Jouffret, V., Miotello, G., Culotta, K., Ayrault, S., Pible, O., & Armengaud, J. (2021). Increasing the power of interpretation for soil metaproteomics data. Microbiome. https://doi.org/10.1186/s40168-021-01139-1
