

The DOI matches its Crossref record; 30 of the 30 references it cites were found in a registry or an index.
Amyloid accelerates tau propagation and toxicity in a model of early Alzheimer’s disease
Open accessAbstract
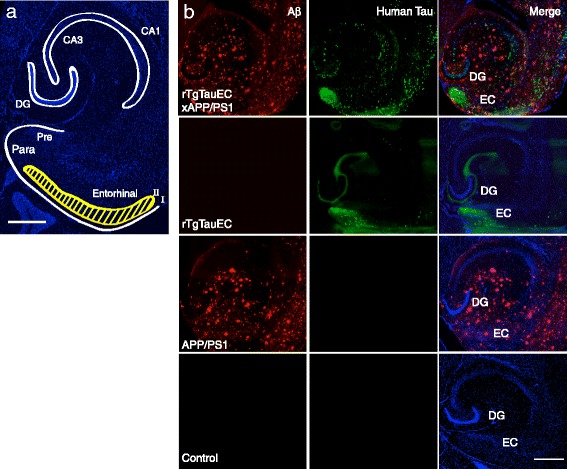
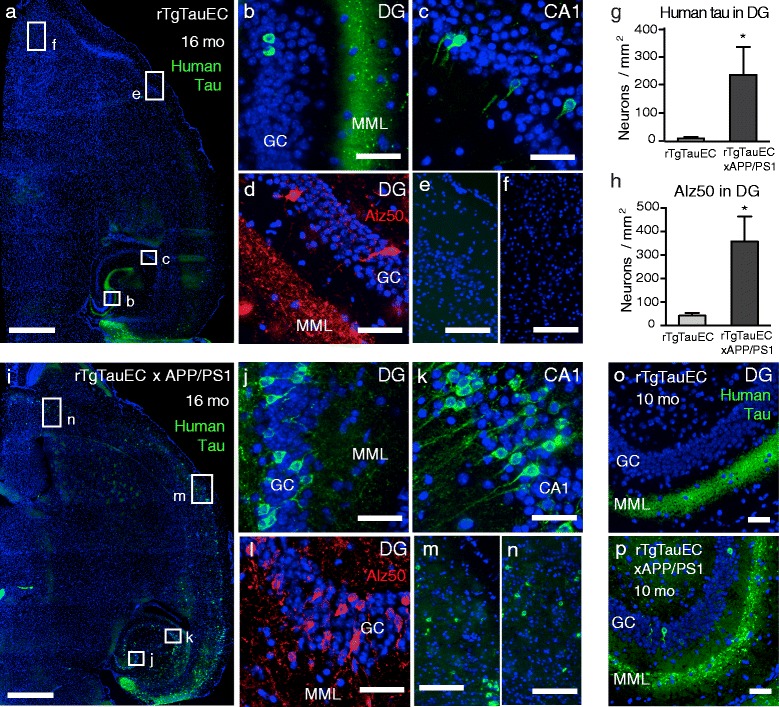
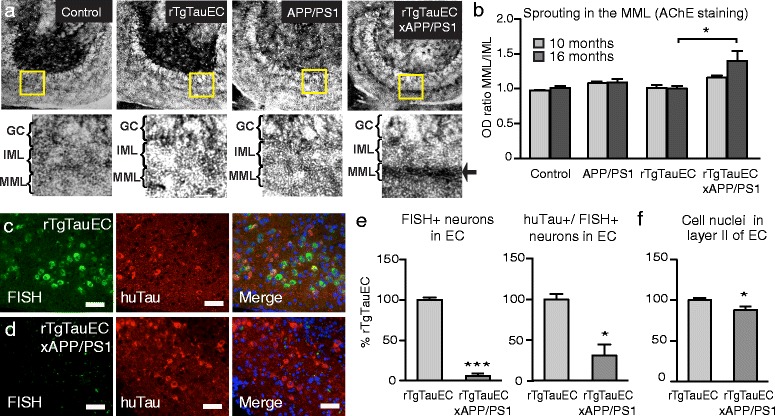
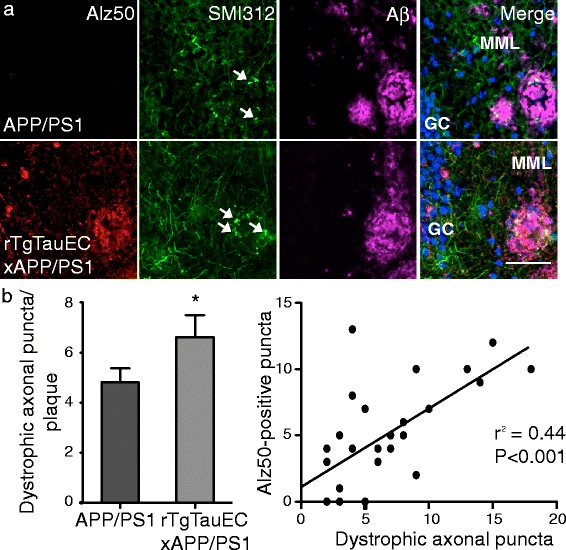
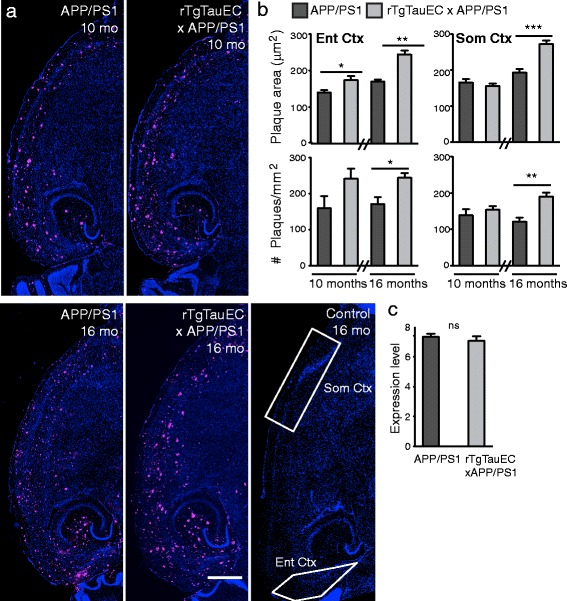
INTRODUCTION: In early stages of Alzheimer's disease (AD), neurofibrillary tangles (NFT) are largely restricted to the entorhinal cortex and medial temporal lobe. At later stages, when clinical symptoms generally occur, NFT involve widespread limbic and association cortices. At this point in the disease, amyloid plaques are also abundantly distributed in the cortex. This observation from human neuropathological studies led us to pose two alternative hypotheses: that amyloid in the cortex is permissive for the spread of tangles from the medial temporal lobe, or that these are co-occurring but not causally related events simply reflecting progression of AD pathology. RESULTS: We now directly test the hypothesis that cortical amyloid acts as an accelerant for spreading of tangles beyond the medial temporal lobe. We crossed rTgTauEC transgenic mice that demonstrate spread of tau from entorhinal cortex to other brain structures at advanced age with APP/PS1 mice, and examined mice with either NFTs, amyloid pathology, or both. We show that concurrent amyloid deposition in the cortex 1) leads to a dramatic increase in the speed of tau propagation and an extraordinary increase in the spread of tau to distal brain regions, and 2) significantly increases tau-induced neuronal loss. CONCLUSIONS: These data strongly support the hypothesis that cortical amyloid accelerates the spread of tangles throughout the cortex and amplifies tangle-associated neural system failure in AD.
Overview
The claims and statistics of this paper haven’t been checked yet.
Run the check — free, no account needed. It reads the open-access text and checks the sources it cites.
Integrity signals
Registry
Cites
Statistics
Figures
Verification
Claims the paper makes
The claims and statistics of this paper haven’t been checked yet.
Run the check — free, no account needed. It reads the open-access text and checks the sources it cites.
Claims other papers make about this one
Each is checked against this paper’s own text: does it say what the citing paper says it does?
The cited source says what the claim attributes to it.
In the citing paper
“Another study has shown that presence of cortical Aβ plaques accelerates the development of tauopathy along the perforant pathway and synergizes with tau-related neurodegeneration (6).”
From Combinatorial model of amyloid β and tau reveals synergy between amyloid deposits and tangle formation (2022) · cites this paper as [6]
The cited source says what the claim attributes to it.
In the citing paper
“Previous studies have shown that either co-expressing APP and MAPT genes (3, 6, 23) or using prion-like seeding paradigms (4, 24, 25) led to exacerbated Aβ and tau pathologies.”
From Combinatorial model of amyloid β and tau reveals synergy between amyloid deposits and tangle formation (2022) · cites this paper as [6]
The cited source says what the claim attributes to it.
In the citing paper
“Furthermore, Aβ plays a permissive role for the spread of tau pathology in vivo (Pooler et al., 2015).”
From Wild-Type, but Not Mutant N296H, Human Tau Restores Aβ-Mediated Inhibition of LTP in Tau−/− mice (2017) · cites this paper as Pooler et al., 2015
Self-check
Percentages, sums and reported differences re-computed from the paper’s own numbers.
The self-check needs the paper’s full text.
Citations
Cites
Alzheimer's disease: the amyloid cascade hypothesis
Hardy, J. A., & Higgins, G. A. (1992) · Science · doi:10.1126/science.1566067 · Cited by 7,484
Jack, C. R., Knopman, D. S., Jagust, W. J., Petersen, R. C., Weiner, M. W., Aisen, P. S., Shaw, L. M., Vemuri, P., Wiste, H. J., Weigand, S. D., et al. (2013) · The Lancet Neurology · doi:10.1016/s1474-4422(12)70291-0 · Cited by 4,396
Phases of Aβ-deposition in the human brain and its relevance for the development of AD
Thal, D. R., Rüb, U., Orantes, M., & Braak, H. (2002) · Neurology · doi:10.1212/wnl.58.12.1791 · Cited by 3,490
Neurofibrillary tangles but not senile plaques parallel duration and severity of Alzheimer's disease
Arriagada, P. V., Growdon, J. H., Hedley-Whyte, E. T., & Hyman, B. T. (1992) · Neurology · doi:10.1212/wnl.42.3.631 · Cited by 2,668
Self-citationAlzheimer's disease: cell-specific pathology isolates the hippocampal formation.
Hyman, B. T., Van Hoesen, G. W., Damasio, A. R., & Barnes, C. L. (1984) · Science · doi:10.1126/science.6474172 · Cited by 2,268
Self-citationStages of the Pathologic Process in Alzheimer Disease: Age Categories From 1 to 100 Years
Braak, H., Thal, D. R., Ghebremedhin, E., & Del Tredici, K. (2011) · Journal of Neuropathology & Experimental Neurology · doi:10.1097/nen.0b013e318232a379 · Cited by 2,194
Tau Suppression in a Neurodegenerative Mouse Model Improves Memory Function
SantaCruz, K., Lewis, J., Spires, T., Paulson, J., Kotilinek, L., Ingelsson, M., Guimaraes, A., DeTure, M., Ramsden, M., McGowan, E., et al. (2005) · Science · doi:10.1126/science.1113694 · Cited by 2,014
Self-citationFormation of Neurofibrillary Tangles in P301L Tau Transgenic Mice Induced by Aβ42 Fibrils
Götz, J., Chen, F., van Dorpe, J., & Nitsch, R. M. (2001) · Science · doi:10.1126/science.1062097 · Cited by 1,526
Propagation of Tau Pathology in a Model of Early Alzheimer's Disease
de Calignon, A., Polydoro, M., Suárez-Calvet, M., William, C., Adamowicz, D. H., Kopeikina, K. J., Pitstick, R., Sahara, N., Ashe, K. H., Carlson, G. A., et al. (2012) · Neuron · doi:10.1016/j.neuron.2011.11.033 · Cited by 1,427
Self-citationTrans-Synaptic Spread of Tau Pathology In Vivo
Liu, L., Drouet, V., Wu, J., Witter, M. P., Small, S. A., Clelland, C. L. T., & Duff, K. (2012) · PLoS ONE · doi:10.1371/journal.pone.0031302 · Cited by 994
Early Aβ accumulation and progressive synaptic loss, gliosis, and tangle formation in AD brain
Ingelsson, M., Fukumoto, H., Newell, K. L., Growdon, J. H., Hedley–Whyte, E. T., Frosch, M. P., Albert, M. S., Hyman, B. T., & Irizarry, M. C. (2004) · Neurology · doi:10.1212/01.wnl.0000115115.98960.37 · Cited by 666
Self-citationPhysiological release of endogenous tau is stimulated by neuronal activity
Pooler, A. M., Phillips, E. C., Lau, D. H. W., Noble, W., & Hanger, D. P. (2013) · The EMBO Reports · doi:10.1038/embor.2013.15 · Cited by 642
Self-citationDistribution of acetyl cholinesterase in the hippocampal region of the guinea pig
Geneser-Jensen, F. A., & Blackstad, T. W. (1971) · Cell and Tissue Research · doi:10.1007/bf00325634 · Cited by 611
Neuronal activity regulates extracellular tau in vivo
Yamada, K., Holth, J. K., Liao, F., Stewart, F. R., Mahan, T. E., Jiang, H., Cirrito, J. R., Patel, T. K., Hochgräfe, K., Mandelkow, E., et al. (2014) · The Journal of Experimental Medicine · doi:10.1084/jem.20131685 · Cited by 606
Wu, J. W., Herman, M., Liu, L., Simoes, S., Acker, C. M., Figueroa, H., Steinberg, J. I., Margittai, M., Kayed, R., Zurzolo, C., et al. (2013) · Journal of Biological Chemistry · doi:10.1074/jbc.m112.394528 · Cited by 537
Kovács, G. G., Milenković, I., Wöehrer, A., Höftberger, R., Gelpí, E., Haberler, C., Hönigschnabl, S., Reiner‐Concin, A., Heinzl, H., Jungwirth, S., et al. (2013) · Acta Neuropathologica · doi:10.1007/s00401-013-1157-y · Cited by 380
Neuritic pathology and dementia in alzheimer's disease
McKee, A. C., Kosik, K. S., & Kowall, N. W. (1991) · Annals of Neurology · doi:10.1002/ana.410300206 · Cited by 358
Distribution of acetyl cholinesterase in the hippocampal region of the guinea pig
Geneser-Jensen, F. A. (1972) · Cell and Tissue Research · doi:10.1007/bf00335257 · Cited by 311
Bolmont, T., Clavaguera, F., Meyer-Luehmann, M., Herzig, M. C., Radde, R., Staufenbiel, M., Lewis, J., Hutton, M., Tolnay, M., & Jucker, M. (2007) · The American Journal of Pathology · doi:10.2353/ajpath.2007.070403 · Cited by 281
Brendza, R. P., Bacskai, B. J., Cirrito, J. R., Simmons, K. A., Skoch, J. M., Klunk, W. E., Mathis, C. A., Bales, K. R., Paul, S. M., Hyman, B. T., et al. (2005) · Journal of Clinical Investigation · doi:10.1172/jci23269 · Cited by 190
Self-citationAβ-independent processes—rethinking preclinical AD
Chételat, G. (2013) · Nature Reviews Neurology · doi:10.1038/nrneurol.2013.21 · Cited by 184
Ribé, E. M., Pérez, M., Puig, B., Gich, I., Lim, F., Cuadrado, M., Sesma, T., Catena, S., Sánchez, B., Nieto, M., et al. (2005) · Neurobiology of Disease · doi:10.1016/j.nbd.2005.05.027 · Cited by 162
Harris, J. A., Koyama, A., Maeda, S., Ho, K., Devidze, N., Dubal, D. B., Yu, G.-Q., Masliah, E., & Mucke, L. (2012) · PLoS ONE · doi:10.1371/journal.pone.0045881 · Cited by 141
The demonstration of acetylcholinesterase containing neurones within the caudate nucleus of the rat
LYNCH, G. S., Lucas, P., & Deadwyler, S. A. (1972) · Brain Research · doi:10.1016/0006-8993(72)90494-5 · Cited by 124
Polydoro, M., Dzhala, V. I., Pooler, A. M., Nicholls, S. B., McKinney, A. P., Sanchez, L., Pitstick, R., Carlson, G. A., Staley, K. J., Spires-Jones, T. L., et al. (2014) · Acta Neuropathologica · doi:10.1007/s00401-013-1215-5 · Cited by 117
Self-citationAlzheimer Lesions in the Entorhinal Region and Isocortex in Parkinson's and Alzheimer's Diseasesa
Jellinger, K. A., Braak, H., Braak, E., & Fischer, P. A. (1991) · Annals of the New York Academy of Sciences · doi:10.1111/j.1749-6632.1991.tb00218.x · Cited by 78
Rasool, S., Martínez‐Coria, H., Wu, J., LaFerla, F. M., & Glabe, C. G. (2013) · Journal of Neurochemistry · doi:10.1111/jnc.12305 · Cited by 74
Polydoro, M., de Calignon, A., Suárez‐Calvet, M., Sanchez, L., Kay, K. R., Nicholls, S. B., Roe, A. D., Pitstick, R., Carlson, G. A., Gómez‐Isla, T., et al. (2013) · Journal of Neuroscience · doi:10.1523/jneurosci.0881-13.2013 · Cited by 47
Self-citationNeuropathological quantification of dtg APP/PS1: neuroimaging, stereology, and biochemistry
Manaye, K. F., Wang, P. C., O’Neil, J. N., Huang, S., Xu, T., Lei, D.-L., Tizabi, Y., Ottinger, M. A., Ingram, D. K., & Mouton, P. R. (2007) · AGE · doi:10.1007/s11357-007-9035-y · Cited by 35
Pooler, A. M., Polydoro, M., Wegmann, S., Pitstick, R., Kay, K. R., Sanchez, L., Carlson, G. A., Gómez‐Isla, T., Albers, M. W., Spires‐Jones, T. L., et al. (2013) · The Journal of Comparative Neurology · doi:10.1002/cne.23411 · Cited by 21
Self-citation
Cited by
Sorted by citations
Alzheimer Disease: An Update on Pathobiology and Treatment Strategies
Long, J. M., & Holtzman, D. M. (2019) · Cell · doi:10.1016/j.cell.2019.09.001 · Cited by 3,204
The Amyloid-β Pathway in Alzheimer’s Disease
Hampel, H., Hardy, J., Blennow, K., Chen, C., Perry, G., Kim, S. H., Villemagne, V. L., Aisen, P., Vendruscolo, M., Iwatsubo, T., et al. (2021) · Molecular Psychiatry · doi:10.1038/s41380-021-01249-0 · Cited by 1,952
Synergy between amyloid-β and tau in Alzheimer’s disease
Busche, M. A., & Hyman, B. T. (2020) · Nature Neuroscience · doi:10.1038/s41593-020-0687-6 · Cited by 1,242
Self-citationProtein misfolding, aggregation, and conformational strains in neurodegenerative diseases
Soto, C., & Pritzkow, S. (2018) · Nature Neuroscience · doi:10.1038/s41593-018-0235-9 · Cited by 1,180
The Amyloid-β Oligomer Hypothesis: Beginning of the Third Decade
Cline, E. N., Bicca, M. A., Viola, K. L., & Klein, W. L. (2018) · Journal of Alzheimer's Disease · doi:10.3233/jad-179941 · Cited by 870
Metadata
- Authors
- Pooler, A. M., Polydoro, M., Maury, E. A., Nicholls, S. B., Reddy, S. M., Wegmann, S., William, C., Saqran, L., Cagsal-Getkin, O., Pitstick, R., Beier, D. R., Carlson, G. A., Spires-Jones, T. L., & Hyman, B. T.
- Affiliations
- Harvard University (US)
- McLaughlin Research Institute (US)
- Seattle Children's Research Institute (US)
- Corresponding author
- Hyman, Bradley T
- ORCID
- Venue
- Acta Neuropathologica Communications
- Published
- 2015-03-24
- Volume
- 3
- Issue
- 1
- Pages
- 14-14
- ISSN
- 2051-5960 (ISSN-L)
- PMC
- PMC4371800
- OpenAlex
- W2107141858
- Cited by
- 236
- References
- 30
- Citations by year
- 2026: 9 · 2025: 20 · 2024: 20 · 2023: 26 · 2022: 20 · 2021: 24 · 2020: 30 · 2019: 17 · 2018: 25 · 2017: 23 · 2016: 16 · 2015: 5
- FWCI
- 16.94
- Type
- journal article
- Language
- en
- Open access
- gold
- doi.org
- Locations
- Acta Neuropathologica Communications (publishedVersion, cc-by)
- Europe PMC (PubMed Central) (publishedVersion, cc-by)
- PubMed Central (publishedVersion, cc-by)
- PubMed (publishedVersion)
- Digital Access to Scholarship at Harvard (DASH) (Harvard University) (submittedVersion, cc-by)
- Edinburgh Research Explorer (University of Edinburgh) (submittedVersion, cc-by)
- Funders
- Alzheimer's Association (ZEN-09-132524)
- American Health Assistance Foundation
- Glenn Foundation for Medical Research
- Alzheimer's Society
- National Institutes of Health
- National Institute on Aging (R01AG026249, 5T32AG00022222, R00AG033670, P50AG005134, R21AG03885, T32AG000222, P30AG062421)
- Topics
- Life Sciences › Neuroscience › Cellular and Molecular Neuroscience › Alzheimer's disease research and treatments
- Health Sciences › Medicine › Psychiatry and Mental health › Dementia and Cognitive Impairment Research
- Life Sciences › Neuroscience › Neurology › Neuroinflammation and Neurodegeneration Mechanisms
- Keywords
- Alzheimer's disease, amyloid plaques, tau propagation, neurofibrillary tangles, tauopathy, cortical amyloid, entorhinal cortex, APP/PS1 mice, transgenic mouse model, neuronal loss, tau toxicity, disease progression
- MeSH terms
- Aging, Alzheimer Disease, Amyloid, Animals, Brain, Cerebral Cortex, Disease Models, Animal, Hippocampus, Humans, Mice, Transgenic, Neurons, Temporal Lobe, Neurofibrillary Tangles, tau Proteins, Disease Progression, Mice
About these checks
Registry, retraction, Cites and statistics results are computed, not judged, with one exception: a printed reference that no index lists is read once by a model before it counts as a citation error. Claims are extracted by a model and kept only when their quote appears verbatim in the text; each cited source is then checked, with a model’s help, for whether it says what the claim relies on. Those verdicts can be wrong — read the claim’s quote and the cited source before relying on one.
Statistics and arithmetic are recomputed, not judged.
Confidence bands are shown only for fields calibrated on our annotated test set. None is calibrated yet, so no band is shown.
What counts as a claim ›How we measure confidence ›How we check this ›
Are you an author, or do you see a problem with this page? Request a review
