

The DOI matches its Crossref record; 1 of the 1 references it cites were found in a registry or an index.
Culturally Relevant Inquiry-Based Laboratory Module Implementations in Upper-Division Genetics and Cell Biology Teaching Laboratories
Open accessAbstract
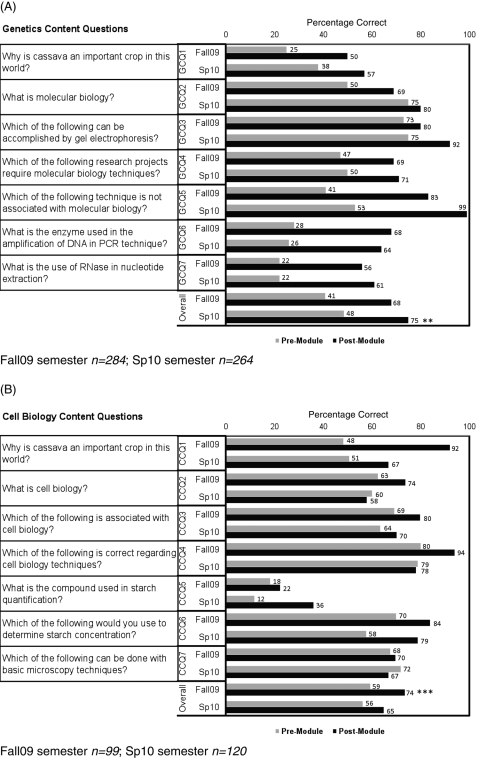
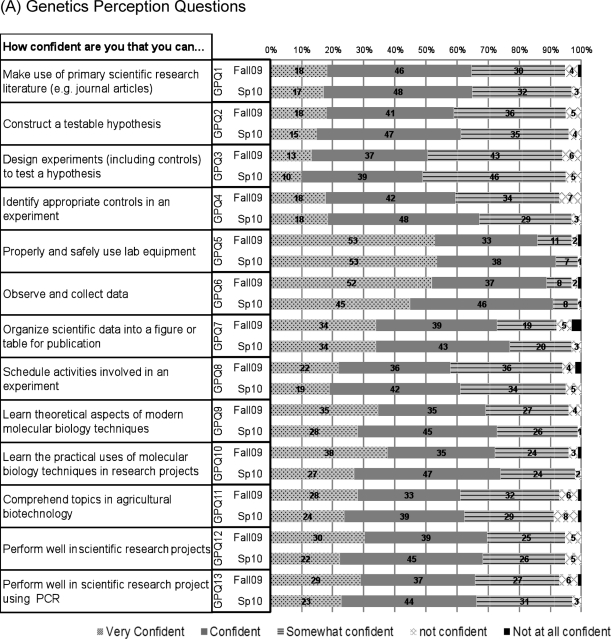
Today, more minority students are entering undergraduate programs than ever before, but they earn only 6% of all science or engineering PhDs awarded in the United States. Many studies suggest that hands-on research activities enhance students' interest in pursuing a research career. In this paper, we present a model for the implementation of laboratory research in the undergraduate teaching laboratory using a culturally relevant approach to engage students. Laboratory modules were implemented in upper-division genetics and cell biology courses using cassava as the central theme. Students were asked to bring cassava samples from their respective towns, which allowed them to compare their field-collected samples against known lineages from agricultural stations at the end of the implementation. Assessment of content and learning perceptions revealed that our novel approach allowed students to learn while engaged in characterizing Puerto Rican cassava. In two semesters, based on the percentage of students who answered correctly in the premodule assessment for content knowledge, there was an overall improvement of 66% and 55% at the end in the genetics course and 24% and 15% in the cell biology course. Our proposed pedagogical model enhances students' professional competitiveness by providing students with valuable research skills as they work on a problem to which they can relate.
Overview
The claims and statistics of this paper haven’t been checked yet.
Run the check — free, no account needed. It reads the open-access text and checks the sources it cites.
Integrity signals
Registry
Cites
Statistics
Figures
Verification
Claims the paper makes
The claims and statistics of this paper haven’t been checked yet.
Run the check — free, no account needed. It reads the open-access text and checks the sources it cites.
Claims other papers make about this one
Each is checked against this paper’s own text: does it say what the citing paper says it does?
The source backs part of the claim, not all of it — or backs it for a different population, condition or comparison.
In the citing paper
“Students experience cognitive gains, including analyzing data, interpreting results, and increased content knowledge (6–10, 17, 18).”
From Gains in Scientific Identity, Scientific Self-Efficacy, and Career Intent Distinguish Upper-Level CUREs from Traditional Experiences in the Classroom (2022) · cites this paper as [10]
Experimental — accuracy not yet measuredThe cited source says what the claim attributes to it.
In the citing paper
“Studies investigating course-based undergraduate research experiences (CUREs) suggest that CUREs provide a viable mechanism to foster the development of factors related to a student’s academic success and retention in STEM (6–10).”
From Gains in Scientific Identity, Scientific Self-Efficacy, and Career Intent Distinguish Upper-Level CUREs from Traditional Experiences in the Classroom (2022) · cites this paper as [10]
Self-check
Percentages, sums and reported differences re-computed from the paper’s own numbers.
The self-check needs the paper’s full text.
Citations
Cites
Hunter, A., Laursen, S. L., & Seymour, E. (2007) · Science Education · doi:10.1002/sce.20173 · Cited by 1,324
Research works printed but not linked: 21
- Cabral GB, 2001, R Bras Fisiol Veg, 13, 41, 10.1590/S0103-31312001000100005 · DOI
- Cox T, 1986, Proc Natl Acad Sci USA, 83, 5583, 10.1073/pnas.83.15.5583 · DOI
- Dellaporta S, 1983, Plant Mol Biol Reporter, 1, 19, 10.1007/BF02712670 · DOI
- Fields H, 2010, Sci Educ HHMI Bull, 23, 38
- Fregene M, 2003, Theor Appl Genet, 107, 1083, 10.1007/s00122-003-1348-3 · DOI
- Goenaga R, 2002, J Agric Univ Puerto Rico, 86, 27, 10.46429/jaupr.v86i1-2.3181 · DOI
- Hathaway RS, 2002, J Coll Stud Dev, 43, 614
- Hovenkamp-Hermelink JHM, 1988, Potato Res, 31, 241, 10.1007/BF02365532 · DOI
- Kizito E, 2005, Euphytica, 146, 45, 10.1007/s10681-005-2959-3 · DOI
- Lord T, 2007, J Coll Sci Teach, 36, 62
- Mohammadi S, 2003, Crop Sci, 43, 1235, 10.2135/cropsci2003.1235 · DOI
- Montero-Rojas M, 2011, AoB Plants
- Morgante M, 1993, Plant J, 3, 175, 10.1111/j.1365-313X.1993.tb00020.x · DOI
- National Academy of Sciences (2010). Expanding Underrepresented Minority Participation: America's Science and Technology Talent at the Crossroads In: Washington, DC: National Academies Press.
- National Research Council (NRC) (2000). Inquiry and the National Science Education Standards: A Guide for Teaching and Learning In: Washington, DC: National Academies Press.
- NRC (2003). BIO 2010: Transforming Undergraduate Education for Future Research Biologists. Committee on Undergraduate Biology Education to Prepare Research Scientists for the 21st Century In: Washington, DC: National Academies Press.
- Prince M, 2007, J Coll Sci Teach, 36, 14
- Russell SH, 2007, Science, 316, 548, 10.1126/science.1140384 · DOI · Paper page
- Seymour EL, 2004, Sci Educ, 88, 493, 10.1002/sce.10131 · DOI · Paper page
- 10.1187/09-11-0087 · DOI · Paper page
- Smith J, 1984, Crop Sci, 24, 1041, 10.2135/cropsci1984.0011183X002400060009x · DOI
Cited by
Assessment of Course-Based Undergraduate Research Experiences: A Meeting Report
Auchincloss, L. C., Laursen, S. L., Branchaw, J. L., Eagan, K., Graham, M., Hanauer, D. I., Lawrie, G., McLinn, C. M., Pelaez, N., Rowland, S., et al. (2014) · CBE—Life Sciences Education · doi:10.1187/cbe.14-01-0004 · Cited by 1,043
Newell, M. J., & Ulrich, P. N. (2022) · Journal of Microbiology & Biology Education · doi:10.1128/jmbe.00051-22 · Cited by 34
The genome solver project: Faculty training and student performance gains in bioinformatics
Mathur, V., Arora, G. S., McWilliams, M., Russell, J., & Rosenwald, A. G. (2019) · Journal of Microbiology & Biology Education · doi:10.1128/jmbe.v20i1.1607 · Cited by 14
Metadata
- Authors
- Siritunga, D., Montero-Rojas, M., Carrero, K., Toro, G., Vélez, A., & Carrero-Martínez, F. A.
- Affiliations
- University of Puerto Rico-Mayaguez (PR)
- Department of Biology, University of Puerto Rico, Mayagüez, PR 00680
- Corresponding author
- Siritunga, Dimuth
- ORCID
- Siritunga, Dimuth
- Venue
- CBE—Life Sciences Education
- Published
- 2011-09
- Volume
- 10
- Issue
- 3
- Pages
- 287-297
- ISSN
- 1931-7913 (ISSN-L)
- PMC
- PMC3164568
- OpenAlex
- W2117918363
- Cited by
- 29
- References
- 1
- Citations by year
- 2025: 2 · 2024: 1 · 2023: 1 · 2022: 5 · 2021: 2 · 2020: 1 · 2019: 5 · 2018: 2 · 2017: 2 · 2016: 1 · 2015: 2 · 2014: 4 · 2012: 1
- FWCI
- 7.70
- Type
- journal article
- Language
- en
- Open access
- hybrid
- doi.org
- Licence
- cc-by-nc-sa
- Locations
- CBE—Life Sciences Education (publishedVersion, cc-by-nc-sa)
- PubMed Central (publishedVersion, cc-by-nc-sa)
- PubMed (publishedVersion)
- Funders
- National Science Foundation
- Topics
- Social Sciences › Education › Science Education and Pedagogy
- Social Sciences › Education › Innovative Teaching Methods
- Life Sciences › Biochemistry, Genetics and Molecular Biology › Molecular Biology › Genetics, Bioinformatics, and Biomedical Research
- Keywords
- culturally relevant pedagogy, inquiry-based learning, genetics education, cell biology education, cassava, student engagement, research skills, content knowledge assessment, upper division courses
- MeSH terms
- Manihot, Culture, Curriculum, Cell Biology, Electrophoresis, Agar Gel, Genetic Markers, Genetics, Laboratories, Learning, Puerto Rico, Starch, Students, Teaching, Plant Roots, DNA, Plant, Microsatellite Repeats, Knowledge, Plant Stomata
About these checks
Registry, retraction, Cites and statistics results are computed, not judged, with one exception: a printed reference that no index lists is read once by a model before it counts as a citation error. Claims are extracted by a model and kept only when their quote appears verbatim in the text; each cited source is then checked, with a model’s help, for whether it says what the claim relies on. Those verdicts can be wrong — read the claim’s quote and the cited source before relying on one.
Statistics and arithmetic are recomputed, not judged.
Confidence bands are shown only for fields calibrated on our annotated test set. None is calibrated yet, so no band is shown.
What counts as a claim ›How we measure confidence ›How we check this ›
Are you an author, or do you see a problem with this page? Request a review
