

The DOI matches its Crossref record; 56 of the 57 references it cites were found in a registry or an index.
Cysteine supplementation reverses methionine restriction effects on rat adiposity: significance of stearoyl-coenzyme A desaturase
Open accessAbstract
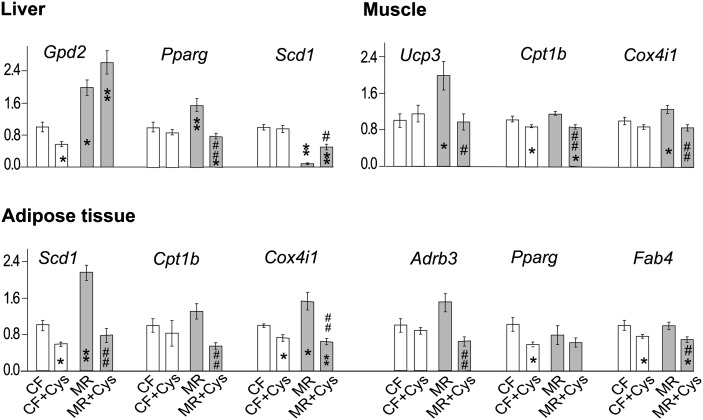
Stearoyl-CoA desaturase-1 (SCD1) is a key enzyme in fatty acid and energy metabolism, but little is known about its nutritional regulation. Dietary methionine restriction in rats decreases hepatic Scd1 mRNA and protein, increases energy expenditure, and decreases fat-pad mass/body-weight% (FM/BW%). In humans, plasma concentrations of the methionine product, cysteine, are associated with obesity. To determine which consequences of methionine-restriction are mediated by decreased cysteine availability, we monitored obesity-related variables in 4 dietary groups for 12 weeks: control-fed (CF), methionine-restricted (MR), MR supplemented with 0.5% l-cysteine (MR+Cys) and CF+Cys rats. MR lowered weight gain and FM/BW% despite higher food intake/weight than CF, and lowered serum cysteine. Hepatic Scd1 expression was decreased, with decreased serum SCD1 activity indices (calculated from serum fatty acid profile), decreased serum insulin, leptin and triglycerides, and higher adiponectin. Cysteine supplementation (MR+Cys) essentially reversed all these phenotypes and raised serum cysteine but not methionine to CF levels. Adding extra cysteine to control diet (CF+Cys) increased serum taurine but did not affect serum cysteine, lipids, proteins, or total weight gain. FM/BW% and serum leptin were modestly decreased. Our results indicate that anti-obesity effects of MR are caused by low cysteine and that dietary sulfur amino acid composition contributes to SCD1 regulation.
Overview
The claims and statistics of this paper haven’t been checked yet.
Run the check — free, no account needed. It reads the open-access text and checks the sources it cites.
Integrity signals
Registry
Cites
Statistics
Figures
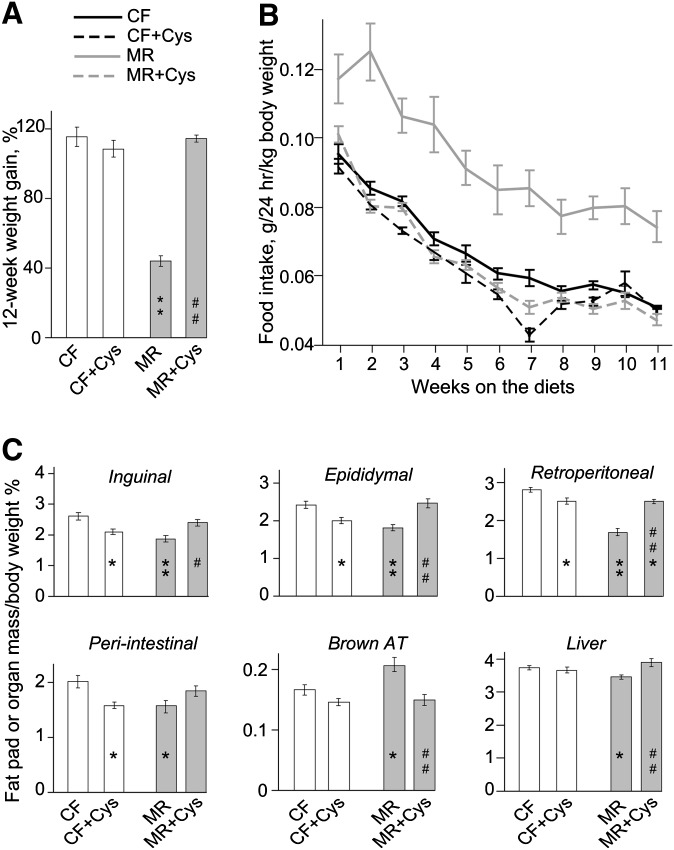
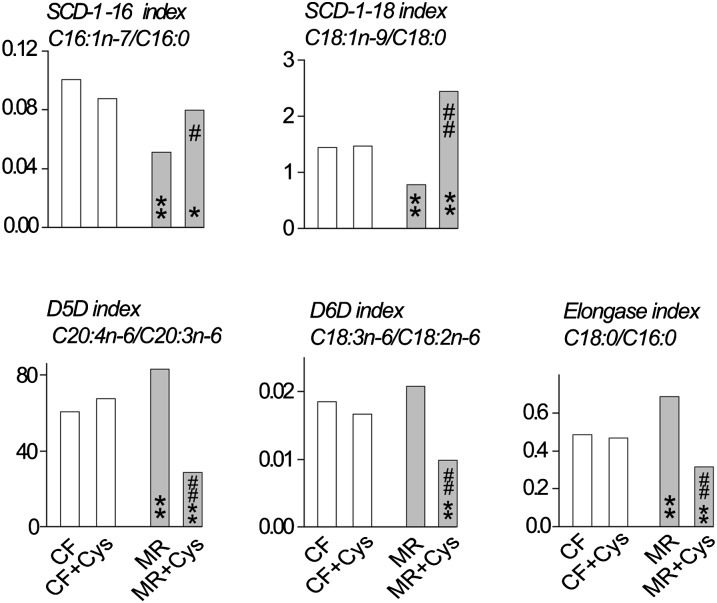
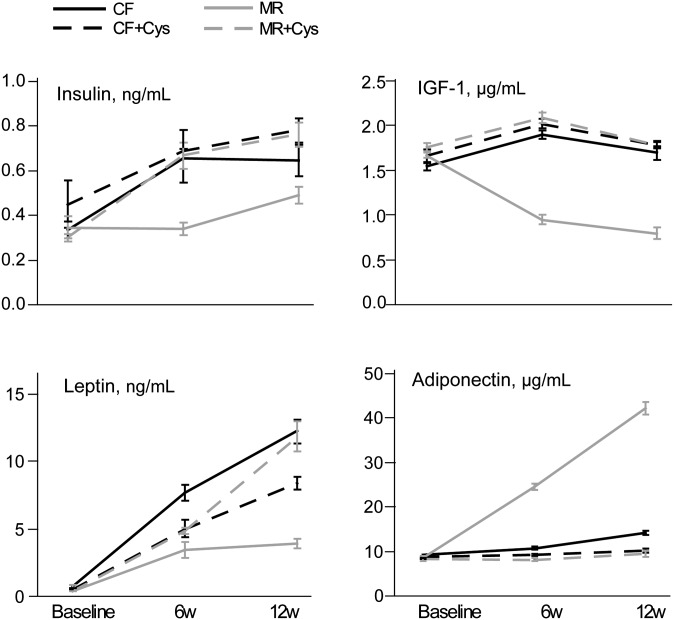
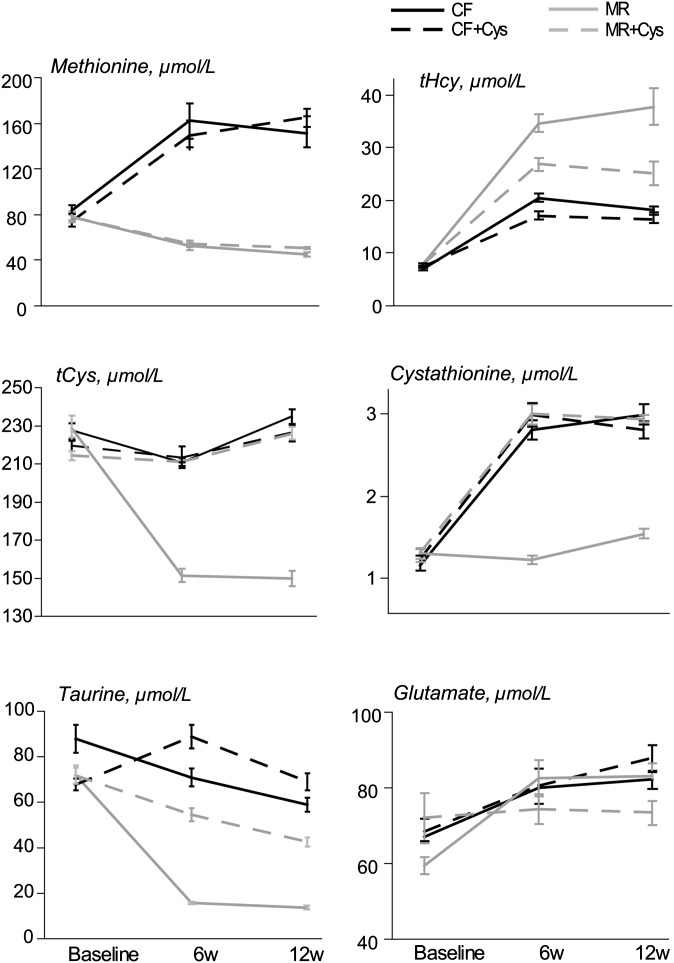
Verification
Claims the paper makes
The claims and statistics of this paper haven’t been checked yet.
Run the check — free, no account needed. It reads the open-access text and checks the sources it cites.
Claims other papers make about this one
Each is checked against this paper’s own text: does it say what the citing paper says it does?
In the citing paper
“Cysteine supplementation was found to reverse the effects of methionine restriction on the expression of genes involved in lipid synthesis [25]”
Self-check
Percentages, sums and reported differences re-computed from the paper’s own numbers.
The self-check needs the paper’s full text.
Citations
Cites
Methionine metabolism in mammals
Finkelstein, J. D. (1990) · The Journal of Nutritional Biochemistry · doi:10.1016/0955-2863(90)90070-2 · Cited by 1,495
The Effects of High Protein Diets on Thermogenesis, Satiety and Weight Loss: A Critical Review
Halton, T. L., & Hu, F. B. (2004) · Journal of the American College of Nutrition · doi:10.1080/07315724.2004.10719381 · Cited by 822
Gall, W. E., Beebe, K. D., Lawton, K. A., Adam, K., Mitchell, M. W., Nakhle, P. J., Ryals, J. A., Milburn, M. V., Nannipieri, M., Camastra, S., et al. (2010) · PLoS ONE · doi:10.1371/journal.pone.0010883 · Cited by 702
ATF4-dependent transcription mediates signaling of amino acid limitation
Kilberg, M. S., Shan, J., & Su, N. Y. (2009) · Trends in Endocrinology and Metabolism · doi:10.1016/j.tem.2009.05.008 · Cited by 614
Low methionine ingestion by rats extends life span.
Orentreich, N., Matias, J. R., Felice, A. D., & Zimmerman, J. (1993) · Journal of NutriLife · doi:10.1093/jn/123.2.269 · Cited by 608
Mice overexpressing human uncoupling protein-3 in skeletal muscle are hyperphagic and lean
Clapham, J. C., Arch, J. R. S., Chapman, H., Haynes, A., Lister, C., Moore, G. B. T., Piercy, V., Carter, S. A., Lehner, I., Smith, S. A., et al. (2000) · Nature · doi:10.1038/35019082 · Cited by 604
Mammalian Cysteine Metabolism: New Insights into Regulation of Cysteine Metabolism
Stipanuk, M. H., Dominy, J. E., Lee, J.-I., & Coloso, R. M. (2006) · Journal of Nutrition · doi:10.1093/jn/136.6.1652s · Cited by 546
Bowes & Church's food values of portions commonly used
Pennington, J. A. T., & Spungen, J. H. (1985) · Medical Entomology and Zoology · Cited by 468
Role of stearoyl-coenzyme A desaturase in regulating lipid metabolism
Flowers, M. T., & Ntambi, J. M. (2008) · Current Opinion in Lipidology · doi:10.1097/mol.0b013e3282f9b54d · Cited by 442
Dobrzyń, P., Dobrzyń, A., Miyazaki, M., Cohen, P., Asilmaz, E., Hardie, D. G., Friedman, J. M., & Ntambi, J. M. (2004) · Proceedings of the National Academy of Sciences · doi:10.1073/pnas.0401627101 · Cited by 400
Cited by
Sorted by citations
Molecular mechanisms of dietary restriction promoting health and longevity
Green, C. L., Lamming, D. W., & Fontana, L. (2022) · Nature Reviews Molecular Cell Biology · doi:10.1038/s41580-021-00411-4 · Cited by 714
l ‐Cysteine metabolism and its nutritional implications
Yin, J., Ren, W., Yang, G., Duan, J., Huang, X., Fang, R., Li, C.-Y., Li, Y., Yin, Y., Hou, Y., et al. (2015) · Molecular Nutrition & Food Research · doi:10.1002/mnfr.201500031 · Cited by 355
Ables, G. P., Perrone, C. E., Orentreich, D. S., & Orentreich∥, N. (2012) · PLoS ONE · doi:10.1371/journal.pone.0051357 · Cited by 241
Self-citationMechanisms of Increased In Vivo Insulin Sensitivity by Dietary Methionine Restriction in Mice
Stone, K. P., Wanders, D., Orgeron, M., Cortez, C. C., & Gettys, T. W. (2014) · Diabetes · doi:10.2337/db14-0464 · Cited by 201
The Mitochondrial Free Radical Theory of Aging
Barja, G. (2014) · Progress in molecular biology and translational science · doi:10.1016/b978-0-12-394625-6.00001-5 · Cited by 198
Metadata
- Authors
- Elshorbagy, A. K., Valdivia-Garcia, M., Mattocks, D. A. L., Plummer, J. D., Smith, A. D., Drevon, C. A., Refsum, H., & Perrone, C. E.
- Affiliations
- University of Oxford (GB)
- Orentreich Foundation for the Advancement of Science (US)
- University of Oslo (NO)
- Corresponding author
- Elshorbagy, Amany K.
- Venue
- Journal of Lipid Research
- Publisher
- Elsevier BV
- Published
- 2011-01
- Volume
- 52
- Issue
- 1
- Pages
- 104-112
- ISSN
- 0022-2275 (ISSN-L)
- PMC
- PMC2999932
- OpenAlex
- W1985118273
- Cited by
- 177
- References
- 57
- Citations by year
- 2026: 4 · 2025: 10 · 2024: 9 · 2023: 6 · 2022: 17 · 2021: 21 · 2020: 24 · 2019: 7 · 2018: 11 · 2017: 4 · 2016: 12 · 2015: 10 · 2014: 12 · 2013: 11 · 2012: 11
- FWCI
- 4.34
- Type
- journal article
- Language
- en
- Open access
- hybrid
- doi.org
- Licence
- Locations
- Journal of Lipid Research (publishedVersion, cc-by)
- PubMed Central (publishedVersion, cc-by-nc)
- PubMed (publishedVersion)
- DOAJ (DOAJ: Directory of Open Access Journals) (submittedVersion, cc-by-sa)
- Funders
- Norges Forskningsråd
- Direktør Throne Holsts Fond For Ernæringsforskning
- Topics
- Life Sciences › Biochemistry, Genetics and Molecular Biology › Biochemistry › Lipid metabolism and biosynthesis
- Health Sciences › Medicine › Endocrinology, Diabetes and Metabolism › Diet, Metabolism, and Disease
- Health Sciences › Medicine › Physiology (medical) › Dietary Effects on Health
- Keywords
- cysteine supplementation, methionine restriction, stearoyl-CoA desaturase 1, adiposity, obesity, fat mass, sulfur-containing amino acids, energy expenditure, leptin, adiponectin, taurine, dietary fat
- MeSH terms
- Animals, Body Weight, Cysteine, Male, Methionine, Rats, Inbred F344, Stearoyl-CoA Desaturase, Taurine, Adiposity, Rats, Adipokines
About these checks
Registry, retraction, Cites and statistics results are computed, not judged, with one exception: a printed reference that no index lists is read once by a model before it counts as a citation error. Claims are extracted by a model and kept only when their quote appears verbatim in the text; each cited source is then checked, with a model’s help, for whether it says what the claim relies on. Those verdicts can be wrong — read the claim’s quote and the cited source before relying on one.
Statistics and arithmetic are recomputed, not judged.
Confidence bands are shown only for fields calibrated on our annotated test set. None is calibrated yet, so no band is shown.
What counts as a claim ›How we measure confidence ›How we check this ›
Are you an author, or do you see a problem with this page? Request a review
