

The DOI matches its Crossref record; 29 of the 29 references it cites were found in a registry or an index.
Artificial intelligence-powered spatial analysis of tumor-infiltrating lymphocytes as complementary biomarker for immune checkpoint inhibition in non-small-cell lung cancer
Open accessAbstract
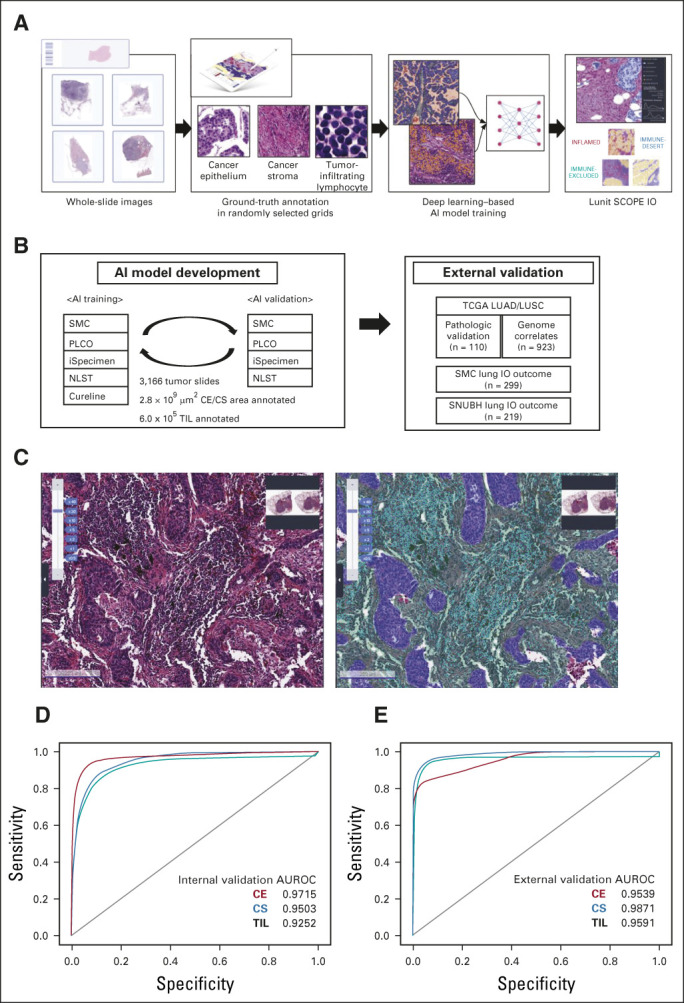
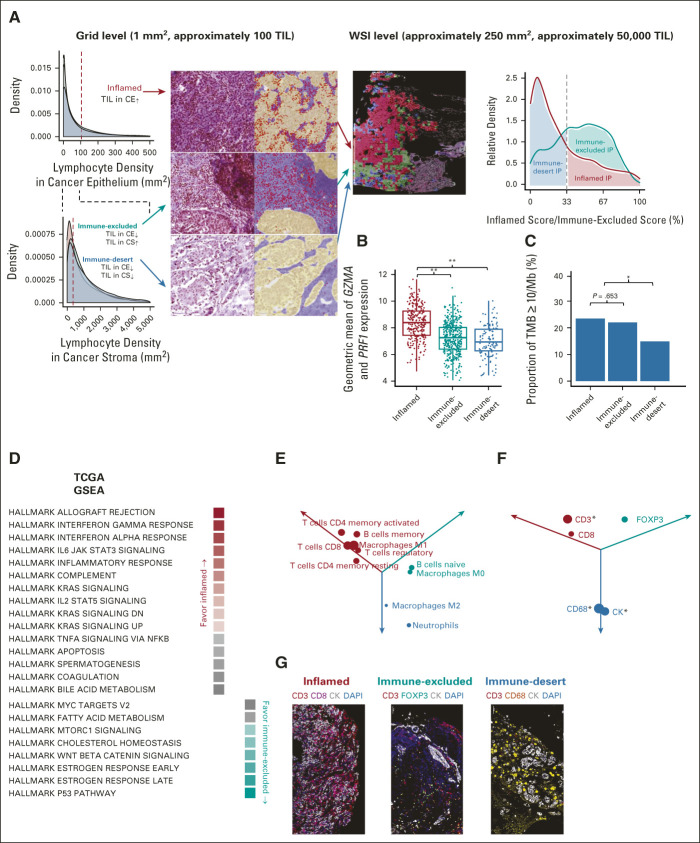
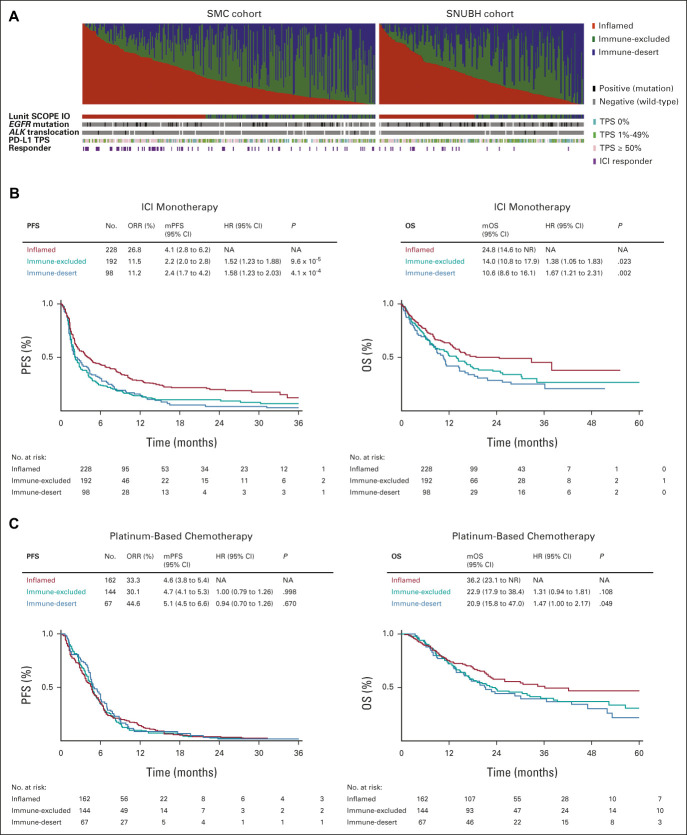
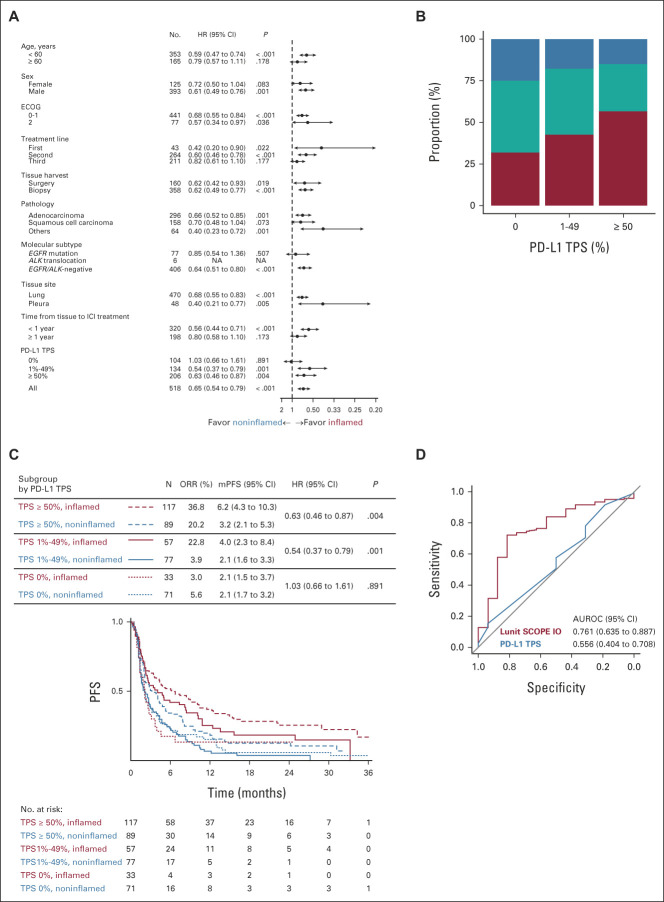
PURPOSE Biomarkers on the basis of tumor-infiltrating lymphocytes (TIL) are potentially valuable in predicting the effectiveness of immune checkpoint inhibitors (ICI). However, clinical application remains challenging because of methodologic limitations and laborious process involved in spatial analysis of TIL distribution in whole-slide images (WSI). METHODS We have developed an artificial intelligence (AI)–powered WSI analyzer of TIL in the tumor microenvironment that can define three immune phenotypes (IPs): inflamed, immune-excluded, and immune-desert. These IPs were correlated with tumor response to ICI and survival in two independent cohorts of patients with advanced non–small-cell lung cancer (NSCLC). RESULTS Inflamed IP correlated with enrichment in local immune cytolytic activity, higher response rate, and prolonged progression-free survival compared with patients with immune-excluded or immune-desert phenotypes. At the WSI level, there was significant positive correlation between tumor proportion score (TPS) as determined by the AI model and control TPS analyzed by pathologists ( P < .001). Overall, 44.0% of tumors were inflamed, 37.1% were immune-excluded, and 18.9% were immune-desert. Incidence of inflamed IP in patients with programmed death ligand-1 TPS at < 1%, 1%-49%, and ≥ 50% was 31.7%, 42.5%, and 56.8%, respectively. Median progression-free survival and overall survival were, respectively, 4.1 months and 24.8 months with inflamed IP, 2.2 months and 14.0 months with immune-excluded IP, and 2.4 months and 10.6 months with immune-desert IP. CONCLUSION The AI-powered spatial analysis of TIL correlated with tumor response and progression-free survival of ICI in advanced NSCLC. This is potentially a supplementary biomarker to TPS as determined by a pathologist.
Overview
The claims and statistics of this paper haven’t been checked yet.
Run the check — free, no account needed. It reads the open-access text and checks the sources it cites.
Integrity signals
Registry
Cites
Statistics
Figures
Verification
Claims the paper makes
The claims and statistics of this paper haven’t been checked yet.
Run the check — free, no account needed. It reads the open-access text and checks the sources it cites.
Claims other papers make about this one
Each is checked against this paper’s own text: does it say what the citing paper says it does?
In the citing paper
“Numerous studies have demonstrated the potential for using AI to predict immunotherapy biomarkers from H&E images of patients with NSCLC, including tumor mutation burden (TMB; ref. 76), PD-L1 expression (105), and TILs (106, 107).”
From Artificial Intelligence in Oncology: Current Landscape, Challenges, and Future Directions (2024) · cites this paper as [106]
Self-check
Percentages, sums and reported differences re-computed from the paper’s own numbers.
The self-check needs the paper’s full text.
Citations
Cites
PD-1 and PD-L1 Immune Checkpoint Blockade to Treat Breast Cancer
Hartkopf, A. D., Taran, F., Wallwiener, M., Walter, C. B., Krämer, B., Grischke, E., & Brucker, S. Y. (2016) · Breast Care · doi:10.1159/000453569 · Cited by 30,989
New response evaluation criteria in solid tumours: revised RECIST guideline (version 1.1)
Eisenhauer, E. A., Therasse, P., Bogaerts, J., Schwartz, L. H., Sargent, D., Ford, R., Dancey, J., Arbuck, S., Gwyther, S., Mooney, M., et al. (2009) · European Journal of Cancer · doi:10.1016/j.ejca.2008.10.026 · Cited by 29,534 · cited 1×
“1, 17 were retrospectively reviewed by investigators.”
Adverse Renal Effects of Immune Checkpoint Inhibitors: A Narrative Review
Wanchoo, R., Karam, S., Uppal, N. N., Barta, V. S., Deray, G., Devoe, C., Launay‐Vacher, V., Jhaveri, K. D., & on behalf of Cancer and Kidney International Network Workgroup on Immune Checkpoint Inhibitors (2017) · American Journal of Nephrology · doi:10.1159/000455014 · Cited by 15,320
Pembrolizumab versus Chemotherapy for PD-L1-Positive Non-Small-Cell Lung Cancer
Reck, M., Rodríguez-Abreu, D., Robinson, A. G., Hui, R., Csőszi, T., Fülöp, A., Gottfried, M., Peled, N., Tafreshi, A., Cuffe, S., et al. (2016) · New England Journal of Medicine · doi:10.1056/nejmoa1606774 · Cited by 10,089 · cited 4×
“This AI-powered spatial TIL analyzer may potentially supplement PD-L1 TPS as a supporting biomarker for ICI.”
ResultInfluentialHerbst, R. S., Baas, P., Kim, D.-W., Felip, E., Pérez-Gracia, J. L., Han, J.-Y., Molina, J., Kim, J.-H., Arvis, C. D., Ahn, M.-J., et al. (2016) · The Lancet · doi:10.1016/s0140-6736(15)01281-7 · Cited by 6,449 · cited 1×
“5%).(24,25) Distribution of IP by baseline clinical attributes and smoking history was investigated, and there was no correlation between IP and smoking status, liver metastasis, and lung immune prognostic index score(26); however, some correlation existed between IP and pleural effusion andbrainmetastasis at the poin…”
BackgroundPembrolizumab for the Treatment of Non–Small-Cell Lung Cancer
Garon, E. B., Rizvi, N. A., Hui, R., Leighl, N., Balmanoukian, A. S., Eder, J. P., Patnaik, A., Aggarwal, C., Gubens, M., Horn, L., et al. (2015) · New England Journal of Medicine · doi:10.1056/nejmoa1501824 · Cited by 6,198 · cited 2×
“8% of the PD-L1 1%-49% subgroup from the KEYNOTE 001 study.(24) In the small subset of patients (n 5 10) who received firstline ICI, the TRR of patients with inflamed versus noninflamed IP was 66.”
BackgroundSelf-citationTGFβ attenuates tumour response to PD-L1 blockade by contributing to exclusion of T cells
Mariathasan, S., Turley, S. J., Nickles, D., Castiglioni, A., Yuen, K., Wang, Y., Kadel III, E. E., Koeppen, H., Astarita, J. L., Cubas, R., et al. (2018) · Nature · doi:10.1038/nature25501 · Cited by 5,400
Elements of cancer immunity and the cancer–immune set point
Chen, D. S., & Mellman, I. (2017) · Nature · doi:10.1038/nature21349 · Cited by 5,352 · cited 1×
“IP was de fi ned as follows 13,14 : in fl amed as TIL density in CE area above the threshold (106/mm 2 ); immune-excluded as TIL density in CE area below the threshold and TIL density in CS area above the threshold (357/mm 2 ); and immune-desert as both TIL density in CE area and that in CS area…”
BackgroundIFN-γ–related mRNA profile predicts clinical response to PD-1 blockade
Ayers, M., Lunceford, J., Nebozhyn, M., Murphy, E., Loboda, A., Kaufman, D. R., Albright, A., Cheng, J. D., Kang, S. P., Shankaran, V., et al. (2017) · Journal of Clinical Investigation · doi:10.1172/jci91190 · Cited by 3,788
Mok, T. S. K., Wu, Y.-L. L. C., Kudaba, I., Kowalski, D. M., Cho, B. C., Turna, H. Z., de Castro, G., Srimuninnimit, V., Лактионов, К. К., Bondarenko, I., et al. (2019) · The Lancet · doi:10.1016/s0140-6736(18)32409-7 · Cited by 3,357 · cited 1×
“Pembrolizumab is superior to standard chemotherapy in terms of tumor response rate (TRR) and survival in patients with tumor proportion score (TPS)$ 50%(3); however, treatment outcomes were similar between pembrolizumab and chemotherapy in patients with PD-L1 TPS 1%-49%.(4) Therefore, development of a novel biomarker…”
Result
Research works printed but not linked: 1
- US Food and Drug Administration, 2020, PD-L1 IHC 22C3 pharmDx—P150013/S014
Cited by
Sorted by citations
Salcher, S., Sturm, G., Horvath, L., Untergasser, G., Kuempers, C., Fotakis, G., Panizzolo, E., Martowicz, A., Trebo, M., Pall, G., et al. (2022) · Cancer Cell · doi:10.1016/j.ccell.2022.10.008 · Cited by 503
Artificial Intelligence for Predictive Biomarker Discovery in Immuno-Oncology: A Systematic Review
Prelaj, A., Miskovic, V., Zanitti, M., Trovo, F., Genova, C., Viscardi, G., Rebuzzi, S. E., Mazzeo, L., Provenzano, L., Kosta, S., et al. (2024) · Annals of Oncology · doi:10.1016/j.annonc.2023.10.125 · Cited by 340
RETRACTED ARTICLE: Antibodies against endogenous retroviruses promote lung cancer immunotherapy
Ng, K. W., Boumelha, J., Enfield, K. S. S., Almagro, J., Cha, H., Pich, O., Karasaki, T., Moore, D. A., Salgado, R., Sivakumar, M., et al. (2023) · Nature · doi:10.1038/s41586-023-05771-9 · Cited by 252
“A For outcome analysis in the SMC LUAD cohort 34 , samples were stratified on the basis of ERVK-7 expression (the summed TPMs of any of the multiple transcripts overlapping the env ORF of this provirus), using a cut-off value of 20 TPM to define high and low ERVK-7 expression.”
InfluentialRetractedMino-Kenudson, M. A., Schalper, K. A., Cooper, W. A., Đačić, S., Hirsch, F. R., Jain, D., López‐Ríos, F., Tsao, M., Yatabe, Y., Beasley, M. B., et al. (2022) · Journal of Thoracic Oncology · doi:10.1016/j.jtho.2022.09.109 · Cited by 240
Fountzilas, E., Pearce, T. E., Baysal, M. A., Chakraborty, A., & Tsimberidou, A. M. (2025) · npj Digital Medicine · doi:10.1038/s41746-025-01471-y · Cited by 233
Metadata
- Authors
- Park, S., Ock, C.-Y., Kim, H., Pereira, S., Park, S., Ma, M., Choi, S., Kim, S., Shin, S., Aum, B. J., Paeng, K., Yoo, D., Cha, H., Park, S., Suh, K. J., Jung, H. A., Kim, S. H., Kim, Y. J., Sun, J.-M., Chung, J.-H., Ahn, J. S., Ahn, M.-J., Lee, J. S., Park, K., Song, S. Y., Bang, Y.-J., Choi, Y.-L., Mok, T. S., & Lee, S.-H.
- Affiliations
- Samsung Medical Center (KR)
- Lunit (South Korea) (KR)
- Seoul National University Bundang Hospital (KR)
- Lunit, Seoul, Republic of Korea
- Ajou University (KR)
- Seoul National University (KR)
- Chinese University of Hong Kong (HK)
- Corresponding author
- Lee, Se-Hoon
- ORCID
- Park, Sehhoon
- Ock, Chan-Young
- Kim, Hyojin
- Park, Seonwook
- Ma, Minuk
- Choi, Sangjoon
- Kim, Seokhwi
- Shin, Seunghwan
- Aum, Brian Jaehong
- Cha, Hongui
- Park, Sunyoung
- Suh, Koung Jin
- Jung, Hyun Ae
- Kim, Se Hyun
- Kim, Yu Jung
- Sun, Jong-Mu
- Chung, Jin-Haeng
- Ahn, Jin Seok
- Ahn, Myung-Ju
- Lee, Jong Seok
- Park, Keunchil
- Bang, Yung-Jue
- Choi, Yoon-La
- Mok, Tony S.
- Lee, Se-Hoon
- Venue
- Journal of Clinical Oncology
- Published
- 2022-06-10
- Volume
- 40
- Issue
- 17
- Pages
- 1916-1928
- ISSN
- 0732-183X (ISSN-L)
- 1527-7755
- PMC
- PMC9177249
- OpenAlex
- W4220803499
- Cited by
- 280
- References
- 29
- Citations by year
- 2026: 46 · 2025: 76 · 2024: 75 · 2023: 56 · 2022: 27
- FWCI
- 24.47
- Type
- journal article
- Language
- en
- Open access
- hybrid
- doi.org
- Licence
- cc-by-nc-nd
- Locations
- Journal of Clinical Oncology (publishedVersion, cc-by-nc-nd)
- PubMed Central (publishedVersion, cc-by-nc-nd)
- PubMed (publishedVersion)
- AJOU Open Repository (Ajou University) (submittedVersion, cc-by-nc-nd)
- Seoul National University Open Repository (Seoul National University) (submittedVersion)
- Funders
- Lunit
- Topics
- Health Sciences › Medicine › Oncology › Cancer Immunotherapy and Biomarkers
- Physical Sciences › Computer Science › Artificial Intelligence › AI in cancer detection
- Health Sciences › Medicine › Radiology, Nuclear Medicine and Imaging › Radiomics and Machine Learning in Medical Imaging
- Keywords
- tumor-infiltrating lymphocytes, immune checkpoint inhibitors, non-small cell lung cancer, tumor microenvironment, immunophenotype, immune-excluded tumors, tumor proportion score, PD-L1 expression, whole slide image analysis, artificial intelligence, predictive biomarkers, progression-free survival, overall survival
- MeSH terms
- Immune Checkpoint Inhibitors, Artificial Intelligence, Carcinoma, Non-Small-Cell Lung, Humans, Lung Neoplasms, Biomarkers, Lymphocytes, Tumor-Infiltrating, Tumor Microenvironment, B7-H1 Antigen, Spatial Analysis
About these checks
Registry, retraction, Cites and statistics results are computed, not judged, with one exception: a printed reference that no index lists is read once by a model before it counts as a citation error. Claims are extracted by a model and kept only when their quote appears verbatim in the text; each cited source is then checked, with a model’s help, for whether it says what the claim relies on. Those verdicts can be wrong — read the claim’s quote and the cited source before relying on one.
Statistics and arithmetic are recomputed, not judged.
Confidence bands are shown only for fields calibrated on our annotated test set. None is calibrated yet, so no band is shown.
What counts as a claim ›How we measure confidence ›How we check this ›
Are you an author, or do you see a problem with this page? Request a review
