

The DOI matches its Crossref record; 1 of the 1 references it cites were found in a registry or an index.
Abnormal brain metabolism on FDG-PET/CT is a common early finding in autoimmune encephalitis
Open accessAbstract
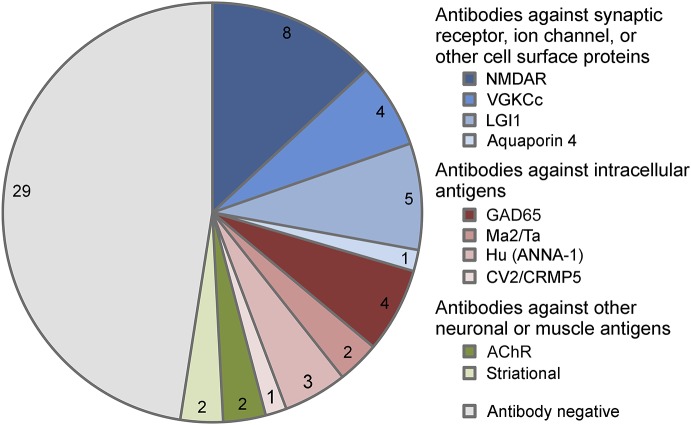
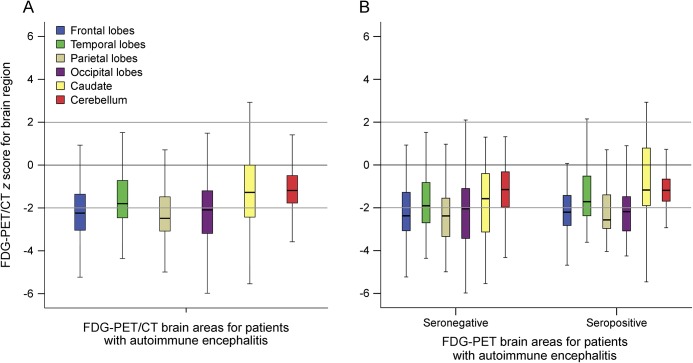
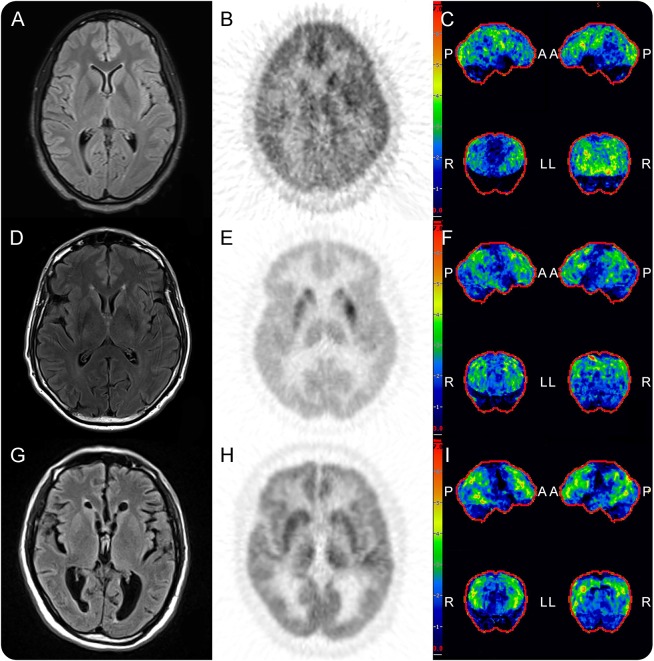
Objective: To compare the rate of abnormal brain metabolism by FDG-PET/CT to other paraclinical findings and to describe brain metabolism patterns in autoimmune encephalitis (AE). Methods: A retrospective review of clinical data and initial dedicated brain FDG-PET/CT studies for neurology inpatients with AE, per consensus criteria, treated at a single tertiary center over 123 months. Z-score maps of FDG-PET/CT were made using 3-dimensional stereotactic surface projections with comparison to age group–matched controls. Brain region mean Z-scores with magnitudes ≥2.00 were interpreted as significant. Comparisons were made to rates of abnormal initial brain MRI, abnormal initial EEG, and presence of intrathecal inflammation. Results: Sixty-one patients with AE (32 seropositive) underwent brain FDG-PET/CT at median 4 weeks of symptoms (interquartile range [IQR] 9 weeks) and median 4 days from MRI (IQR 8.5 days). FDG-PET/CT was abnormal in 52 (85%) patients, with 42 (69%) demonstrating only hypometabolism. Isolated hypermetabolism was demonstrated in 2 (3%) patients. Both hypermetabolic and hypometabolic brain regions were noted in 8 (13%) patients. Nine (15%) patients had normal FDG-PET/CT studies. CSF inflammation was evident in 34/55 (62%) patients, whereas initial EEG (17/56, 30%) and MRI (23/57, 40%) were abnormal in fewer. Detection of 2 or more of these paraclinical findings was in weak agreement with abnormal brain FDG-PET/CT (κ = 0.16, p = 0.02). Conclusions: FDG-PET/CT was more often abnormal than initial EEG, MRI, and CSF studies in neurology inpatients with AE, with brain region hypometabolism the most frequently observed.
Overview
The claims and statistics of this paper haven’t been checked yet.
Run the check — free, no account needed. It reads the open-access text and checks the sources it cites.
Integrity signals
Registry
Cites
Statistics
Figures
Verification
Claims the paper makes
The claims and statistics of this paper haven’t been checked yet.
Run the check — free, no account needed. It reads the open-access text and checks the sources it cites.
Claims other papers make about this one
Each is checked against this paper’s own text: does it say what the citing paper says it does?
The cited source says what the claim attributes to it.
In the citing paper
“Conditions such as PSP, autoimmune encephalitis, chronic schizophrenia, alcohol related brain damage and late onset psychiatric disorders [137–139] may also be associated with patterns of frontal hypometabolism on FDG-PET and therefore FDG-PET should be used in combination with history and other examinations available [140–142].”
From The use of neuroimaging techniques in the early and differential diagnosis of dementia (2023) · cites this paper as [139]
Self-check
Percentages, sums and reported differences re-computed from the paper’s own numbers.
The self-check needs the paper’s full text.
Citations
Cites
The neurobiology of psychedelic drugs: implications for the treatment of mood disorders
Vollenweider, F. X., & Kometer, M. (2010) · Nature Reviews Neuroscience · doi:10.1038/nrn2884 · Cited by 723
Research works printed but not linked: 30
- 10.1016/S1474-4422(15)00401-9 · DOI
- 10.1093/brain/awh526 · DOI
- 10.1097/RLU.0b013e31824852c7 · DOI
- 10.1007/s00415-013-7048-2 · DOI
- 10.1097/MNM.0000000000000163 · DOI
- 10.1016/j.neurol.2012.05.014 · DOI
- 10.1016/S1474-4422(16)30140-5 · DOI
- 10.1136/jnnp-2011-301969 · DOI
- 10.1186/1471-2377-14-136 · DOI
- 10.1016/j.braindev.2015.10.013 · DOI
- 10.1097/RLU.0000000000001164 · DOI
- 10.1016/j.jneuroim.2016.03.012 · DOI
- 10.1097/00003072-200410000-00004 · DOI
- 10.1016/j.jneuroim.2014.02.011 · DOI
- 10.1016/j.jneuroim.2013.10.005 · DOI
- Newey CR, Sarwal A, Hantus S. [(18)F]-Fluoro-deoxy-glucose positron emission tomography scan should be obtained early in cases of autoimmune encephalitis. Autoimmune Dis 2016;2016:9450452.
- 10.14581/jer.14014 · DOI
- 10.1016/j.jneuroim.2016.05.016 · DOI
- 10.3171/jns.1995.83.4.0657 · DOI
- 10.1111/j.1528-1157.2000.tb00213.x · DOI
- Minoshima S, Frey KA, Koeppe RA, Foster NL, Kuhl DE. A diagnostic approach in Alzheimer's disease using three-dimensional stereotactic surface projections of fluorine-18-FDG PET. J Nucl Med 1995;36:1238–1248.
- 10.1093/brain/aws032 · DOI
- 10.1016/S1474-4422(10)70253-2 · DOI
- 10.1016/S1474-4422(16)30130-2 · DOI
- 10.2967/jnmt.108.059584 · DOI
- 10.1001/archneurol.2009.336 · DOI
- 10.4065/mcp.2010.0326 · DOI
- 10.1093/brain/awm177 · DOI · Paper page
- 10.1097/RLU.0b013e318170d4e0 · DOI
- 10.1097/RLU.0b013e31824c5e2f · DOI
Cited by
Sorted by citations
The use of neuroimaging techniques in the early and differential diagnosis of dementia
Chouliaras, L., & O’Brien, J. T. (2023) · Molecular Psychiatry · doi:10.1038/s41380-023-02215-8 · Cited by 221
“Conditions such as PSP, autoimmune encephalitis, chronic schizophrenia, alcohol related brain damage and late onset psychiatric disorders [137 – 139] may also be associated with patterns of frontal hypometabolism on FDG-PET and therefore FDG-PET should be used in combination with history and other…”
BackgroundWesselingh, R., Butzkueven, H., Buzzard, K., Tarlinton, D., O'Brien, T. J., & Monif, M. (2019) · Frontiers in Immunology · doi:10.3389/fimmu.2019.02066 · Cited by 83
Shimasaki, C., Frye, R. E., Trifiletti, R., Cooperstock, M., Kaplan, G., Melamed, I., Greenberg, R., Katz, A., Fier, E., Kem, D., et al. (2020) · Journal of Neuroimmunology · doi:10.1016/j.jneuroim.2019.577138 · Cited by 61
Metadata
- Authors
- Probasco, J. C., Solnes, L., Nalluri, A., Cohen, J., Jones, K. M., Zan, E., Javadi, M. S., & Venkatesan, A.
- Affiliations
- Johns Hopkins University (US)
- From the Department of Neurology (J.C.P., A.N., J.C., A.V.), Johns Hopkins Encephalitis Center, Department of Neurology (J.C.P.), Johns Hopkins Center for Refractory Status Epilepticus and Neuroinflammation, and Russell H. Morgan Department of Radiology and Radiological Sciences (L.S., K.M.J., E.Z., M.S.J.), Johns Hopkins University School of Medicine, Baltimore, MD.
- Corresponding author
- Probasco, John C.
- Venue
- Neurology Neuroimmunology & Neuroinflammation
- Published
- 2017-07
- Volume
- 4
- Issue
- 4
- Pages
- e352-e352
- ISSN
- 2332-7812 (ISSN-L)
- PMC
- PMC5442608
- OpenAlex
- W2613762122
- Cited by
- 192
- References
- 1
- Citations by year
- 2026: 12 · 2025: 16 · 2024: 15 · 2023: 27 · 2022: 23 · 2021: 39 · 2020: 22 · 2019: 21 · 2018: 10 · 2017: 6
- FWCI
- 11.24
- Type
- journal article
- Language
- en
- Open access
- gold
- doi.org
- Licence
- cc-by-nc-nd
- Locations
- Neurology Neuroimmunology & Neuroinflammation (publishedVersion, cc-by-nc-nd)
- Europe PMC (PubMed Central) (publishedVersion, other-oa)
- PubMed Central (publishedVersion, cc-by-nc-nd)
- PubMed (publishedVersion)
- Topics
- Health Sciences › Medicine › Clinical Neurology › Autoimmune Neurological Disorders and Treatments
- Health Sciences › Medicine › Infectious Diseases › Infectious Encephalopathies and Encephalitis
- Health Sciences › Medicine › Clinical Neurology › Peripheral Neuropathies and Disorders
- Keywords
- autoimmune encephalitis, FDG PET/CT, brain metabolism, hypometabolism, hypermetabolism, intrathecal inflammation, cerebrospinal fluid inflammation, brain MRI, EEG abnormalities, early diagnosis
About these checks
Registry, retraction, Cites and statistics results are computed, not judged, with one exception: a printed reference that no index lists is read once by a model before it counts as a citation error. Claims are extracted by a model and kept only when their quote appears verbatim in the text; each cited source is then checked, with a model’s help, for whether it says what the claim relies on. Those verdicts can be wrong — read the claim’s quote and the cited source before relying on one.
Statistics and arithmetic are recomputed, not judged.
Confidence bands are shown only for fields calibrated on our annotated test set. None is calibrated yet, so no band is shown.
What counts as a claim ›How we measure confidence ›How we check this ›
Are you an author, or do you see a problem with this page? Request a review
