

The DOI matches its Crossref record.
Muscle and not neuronal biomarkers correlate with severity in spinal and bulbar muscular atrophy
Open accessAbstract
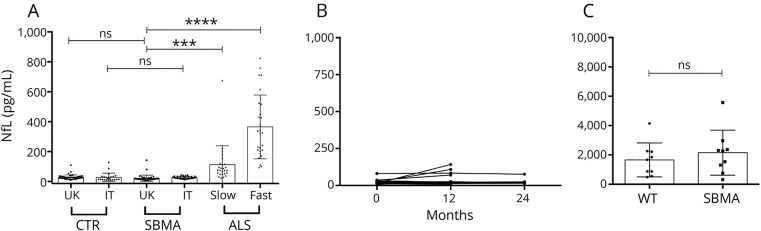
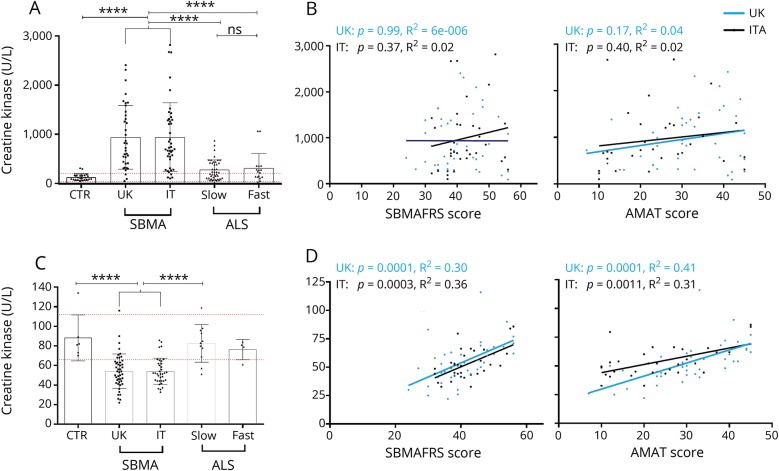
OBJECTIVE: To determine whether blood biomarkers of neuronal damage (neurofilament light chain [NfL]), muscle damage (creatine kinase [CK]), and muscle mass (creatinine) are altered in spinal and bulbar muscular atrophy (SBMA) and can be used as biomarkers for disease severity. METHODS: In this multicenter longitudinal prospective study, plasma and serum were collected from 2 cohorts of patients with SBMA in London, United Kingdom (n = 50), and Padova, Italy (n = 43), along with disease (amyotrophic lateral sclerosis [ALS]) and healthy controls, and levels of plasma and serum NfL, CK, and creatinine were measured. Disease severity was assessed by the SBMA Functional Rating Scale and the Adult Myopathy Assessment Tool at baseline and 12 and 24 months. RESULTS: Blood NfL concentrations were increased in ALS samples, but were unchanged in both SBMA cohorts, were stable after 12 and 24 months, and were not correlated with clinical severity. Normal NfL levels were also found in a well-established mouse model of SBMA. Conversely, CK concentrations were significantly raised in SBMA compared with ALS samples, and were not correlated to the clinical measures. Creatinine concentrations were significantly reduced in SBMA, and strongly and significantly correlated with disease severity. CONCLUSIONS: While muscle damage and muscle mass biomarkers are abnormal in SBMA, axonal damage markers are unchanged, highlighting the relevant primary role of skeletal muscle in disease pathogenesis. Creatinine, but not CK, correlated with disease severity, confirming its role as a valuable biomarker in SBMA.
Overview
The claims and statistics of this paper haven’t been checked yet.
Run the check — free, no account needed. It reads the open-access text and checks the sources it cites.
Integrity signals
Registry
Cites
Statistics
Figures
Verification
Claims the paper makes
The claims and statistics of this paper haven’t been checked yet.
Run the check — free, no account needed. It reads the open-access text and checks the sources it cites.
Claims other papers make about this one
Each is checked against this paper’s own text: does it say what the citing paper says it does?
The source backs part of the claim, not all of it — or backs it for a different population, condition or comparison.
In the citing paper
“Due to differences in sample type (serum or plasma), results were stratified per cohort, which lead to a reduction of statistical power, while ideally one would convert concentrations between serum and plasma and use them combined.”
From A Method to Combine Neurofilament Light Measurements From Blood Serum and Plasma in Clinical and Population-Based Studies (2022) · cites this paper as [12]
Experimental — accuracy not yet measured
Self-check
Percentages, sums and reported differences re-computed from the paper’s own numbers.
The self-check needs the paper’s full text.
Citations
Cites
No references could be resolved yet.
Research works printed but not linked: 24
- 10.1007/978-3-319-71779-1_5 · DOI
- 10.1212/WNL.18.7.671 · DOI
- 10.1016/j.neuron.2014.03.001 · DOI
- 10.1016/j.celrep.2016.08.084 · DOI
- 10.1016/j.nbd.2008.12.009 · DOI
- 10.1016/j.jns.2007.08.012 · DOI
- 10.1007/s00401-013-1122-9 · DOI
- 10.1073/pnas.0705501104 · DOI
- 10.1002/mus.21310 · DOI
- 10.1212/WNL.0000000000004932 · DOI
- 10.1212/WNL.0000000000001642 · DOI · Paper page
- 10.1016/S0896-6273(04)00082-0 · DOI
- Harris-Love MO, Fernandez-Rhodes L, Joe G, et al. Assessing function and endurance in adults with spinal and bulbar muscular atrophy: validity of the adult myopathy assessment tool. Rehabil Res Pract 2014;2014:873872.
- 10.1007/s10072-016-2666-y · DOI
- 10.1016/j.nmd.2015.03.008 · DOI
- 10.1371/journal.pone.0040998 · DOI
- 10.1093/hmg/ddr061 · DOI
- 10.1212/WNL.0000000000003154 · DOI
- 10.1016/j.neuron.2016.05.018 · DOI · Paper page
- 10.1002/acn3.324 · DOI
- 10.1093/brain/aws170 · DOI
- 10.1136/jnnp.57.10.1274 · DOI
- 10.1136/jnnp.45.11.1012 · DOI
- 10.1212/WNL.0000000000000507 · DOI
Cited by
Sorted by citations
Rübsamen, N., Willemse, E. A. J., Leppert, D., Wiendl, H., Nauck, M., Karch, A., Kuhle, J., & Berger, K. (2022) · Frontiers in Neurology · doi:10.3389/fneur.2022.894119 · Cited by 27
Metadata
- Authors
- Lombardi, V., Querin, G., Ziff, O. J., Zampedri, L., Martinelli, I., Heller, C., Foiani, M., Bertolin, C., Lu, C.-H., Malik, B., Allen, K., Rinaldi, C., Zetterberg, H., Heslegrave, A., Greensmith, L., Hanna, M., Soraru, G., Malaspina, A., & Fratta, P.
- Affiliations
- University of Padua (IT)
- From the Institute of Neurology (V.L., O.J.Z., L.Z., C.H., M.F., C.-H.L., B.M., H.Z., A.H., L.G., M.H., P.F.), University College London Institute of Neurology, Queen Square, London; Blizard Institute (V.L., A.M.), Queen Mary, University of London, UK; Department of Neurosciences (G.Q., I.M., C.B., G.S.), University of Padova, Italy; Department of Neurology (C.-H.L.), China Medical University Hospital, Taiwan; Basildon Hospital (K.A.), UK; Department of Physiology, Anatomy and Genetics (C.R.),...
- Corresponding author
- Querin, Giorgia
- Ziff, Oliver J.
- Zampedri, Luca
- Malaspina, Andrea
- Fratta, Pietro
- ORCID
- Venue
- Neurology
- Published
- 2019-03-12
- Volume
- 92
- Issue
- 11
- Pages
- e1205-e1211
- ISSN
- 0028-3878 (ISSN-L)
- 1526-632X
- PMC
- PMC6511101
- OpenAlex
- W2915286327
- Cited by
- 73
- References
- 0
- Citations by year
- 2026: 4 · 2025: 10 · 2024: 11 · 2023: 16 · 2022: 6 · 2021: 9 · 2020: 12 · 2019: 5
- FWCI
- 3.82
- Type
- journal article
- Language
- en
- Update notices
- correction (2020-04-14)
- Open access
- hybrid
- doi.org
- Licence
- cc-by
- Locations
- Neurology (publishedVersion, cc-by)
- PubMed Central (publishedVersion, cc-by)
- PubMed (publishedVersion)
- Padua Research Archive (University of Padova) (submittedVersion, cc-by)
- HAL (submittedVersion)
- UCL Discovery (University College London) (submittedVersion)
- Queen Mary Research Online (Queen Mary University of London) (submittedVersion, cc-by)
- Funders
- Muscular Dystrophy Association
- Wellcome Trust (205162/Z/16/Z)
- Brain Research UK (201718-11)
- National Institute for Health and Care Research (BRC279566)
- Motor Neurone Disease Association (Fratta/Mar19/951-795, MALASPINA/APR13/817-791, TURNER/OCT15/972-797, FRATTA/JAN15/946-795)
- Knut och Alice Wallenbergs Stiftelse
- Vetenskapsrådet
- University College London Hospitals NHS Foundation Trust
- UK Dementia Research Institute
- Medical Research Council (MR/S006508/1, MR/M008606/1, MR/K000608/1)
- Topics
- Life Sciences › Neuroscience › Cellular and Molecular Neuroscience › Genetic Neurodegenerative Diseases
- Health Sciences › Medicine › Clinical Neurology › Amyotrophic Lateral Sclerosis Research
- Life Sciences › Neuroscience › Cellular and Molecular Neuroscience › Hereditary Neurological Disorders
- Keywords
- spinal and bulbar muscular atrophy, neurofilament light chain, creatine kinase, creatinine, blood biomarkers, disease severity, amyotrophic lateral sclerosis, muscle damage, muscle mass, axonal injury
- MeSH terms
- Aged, Amyotrophic Lateral Sclerosis, Animals, Creatine Kinase, Creatinine, Disease Models, Animal, Female, Humans, Longitudinal Studies, Male, Middle Aged, Prospective Studies, Severity of Illness Index, Biomarkers, Neurofilament Proteins, Mice, Bulbo-Spinal Atrophy, X-Linked
About these checks
Registry, retraction, Cites and statistics results are computed, not judged, with one exception: a printed reference that no index lists is read once by a model before it counts as a citation error. Claims are extracted by a model and kept only when their quote appears verbatim in the text; each cited source is then checked, with a model’s help, for whether it says what the claim relies on. Those verdicts can be wrong — read the claim’s quote and the cited source before relying on one.
Statistics and arithmetic are recomputed, not judged.
Confidence bands are shown only for fields calibrated on our annotated test set. None is calibrated yet, so no band is shown.
What counts as a claim ›How we measure confidence ›How we check this ›
Are you an author, or do you see a problem with this page? Request a review
