

The DOI matches its Crossref record; 2 of the 2 references it cites were found in a registry or an index.
Walking economy at simulated high altitude in human healthy young male lowlanders
Abstract
We measured oxygen consumption during walking per unit distance (Cw) values for 12 human healthy young males at six speeds from 0.667 to 1.639 m s−1 (four min per stage) on a level gradient under normobaric normoxia, moderate hypoxia (15% O2), and severe hypoxia (11% O2). Muscle deoxygenation (HHb) was measured at the vastus lateralis muscle using near-infrared spectroscopy. Economical speed which can minimize the Cw in each individual was calculated from a U-shaped relationship. We found a significantly slower economical speed (ES) under severe hypoxia [1.237 (0.056) m s−1; mean (s.d.)] compared to normoxia [1.334 (0.070) m s−1] and moderate hypoxia [1.314 (0.070) m s−1, P<0.05 respectively] with no differences between normoxia and moderate hypoxia (P>0.05). HHb gradually increased with increasing speed under severe hypoxia, while it did not increase under normoxia and moderate hypoxia. Changes in HHb between standing baseline and the final minute at faster gait speeds were significantly related to individual ES (r=0.393 at 1.250 m s−1, r=0.376 at 1.444 m s−1, and r=0.409 at 1.639 m s−1, P<0.05, respectively). These results suggested that acute severe hypoxia slowed ES by ∼8%, but moderate hypoxia left ES unchanged.
Overview
The claims and statistics of this paper haven’t been checked yet.
Run the check — free, no account needed. It reads the open-access text and checks the sources it cites.
Integrity signals
Registry
Cites
Statistics
Figures
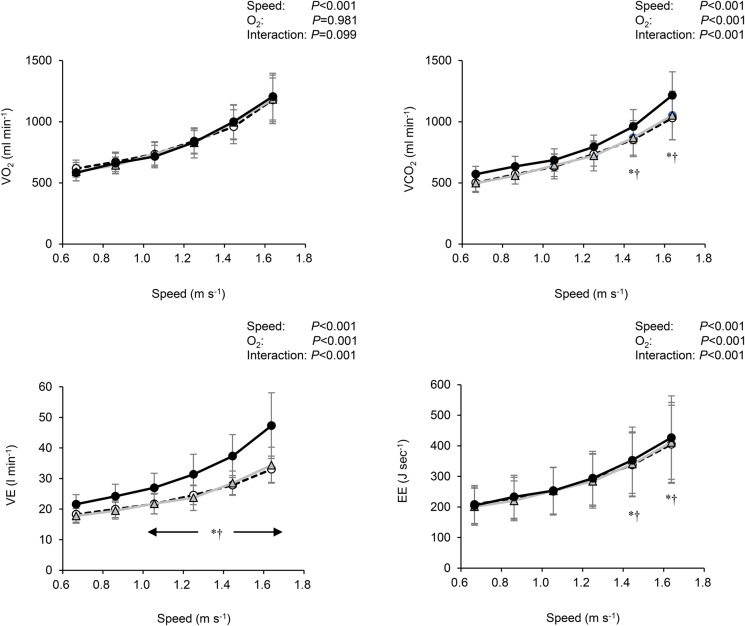
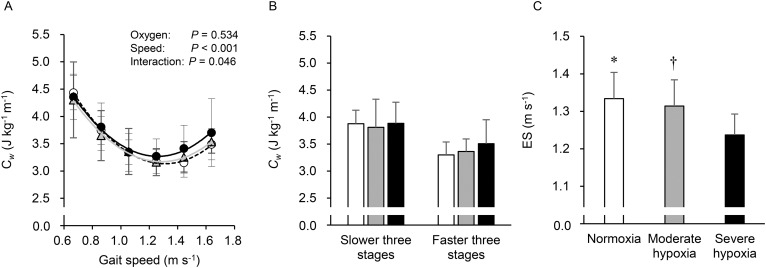
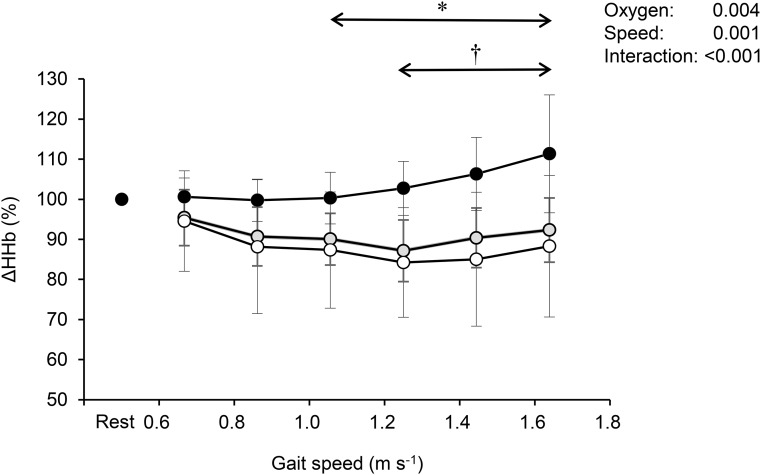
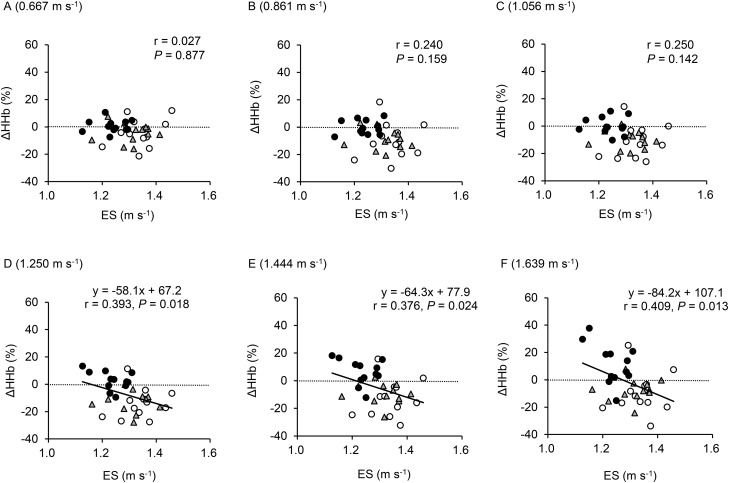
Verification
Claims the paper makes
The claims and statistics of this paper haven’t been checked yet.
Run the check — free, no account needed. It reads the open-access text and checks the sources it cites.
Claims other papers make about this one
Each is checked against this paper’s own text: does it say what the citing paper says it does?
The source backs part of the claim, not all of it — or backs it for a different population, condition or comparison.
In the citing paper
“This residual error and the ~ 19% of variance left unexplained in the cross-validation may be attributable to variety of factors, including different fitness levels in the three groups of study participants30, different weather conditions experienced during the three experiments (i.e., August vs. September vs. January)31, and different altitudes of the study transects32.”
From A singular, broadly-applicable model for estimating on- and off-path walking travel rates using airborne lidar data (2024) · cites this paper as [32]
Experimental — accuracy not yet measured
Self-check
Percentages, sums and reported differences re-computed from the paper’s own numbers.
The self-check needs the paper’s full text.
Citations
Cites
Biomechanical and physiological aspects of legged locomotion in humans
Saibene, F., & Minetti, A. E. (2003) · European Journal of Applied Physiology · doi:10.1007/s00421-002-0654-9 · Cited by 437
Coen, P. M., Jubrias, S. A., Distefano, G., Amati, F., Mackey, D. C., Glynn, N. W., Manini, T. M., Wohlgemuth, S. E., Leeuwenburgh, C., Cummings, S. R., et al. (2013) · The Journals of Gerontology: Series A · doi:10.1093/gerona/gls196 · Cited by 323 · cited 2×
“Additionally, preferred walking speed, which was found to be almost consistent with ES in previous studies (Malatesta et al., 2003; Wezenberg et al., 2013), has been suggested to be related to peak aerobic capacity and muscle mitochondrial capacity (Coen et al., 2013).”
BackgroundResult
Research works printed but not linked: 39
- Abe, 2004, Effects of load carriage, load position, and walking speed on energy cost of walking, Appl. Ergon., 35, 329, 10.1016/j.apergo.2004.03.008 · DOI · Paper page
- Abe, 2008, Ergonomic effects of load carriage on energy cost of gradient walking, Appl. Ergon., 39, 144, 10.1016/j.apergo.2007.06.001 · DOI
- Abe, 2008, Ergonomic effects of load carriage on the upper and lower back on metabolic energy cost of walking, Appl. Ergon., 39, 392, 10.1016/j.apergo.2007.07.001 · DOI
- Abe, 2015, Economical speed and energetically optimal transition speed evaluated by gross and net oxygen cost of transport at different gradients, PLoS ONE, 10, e0138154, 10.1371/journal.pone.0138154 · DOI · Paper page
- Ando, 2013, The effects of exercise under hypoxia on cognitive function, PLoS ONE, 8, e63630, 10.1371/journal.pone.0063630 · DOI
- Bastien, 2005, Energetics of load carrying in Nepalese porters, Science, 308, 1755, 10.1126/science.1111513 · DOI
- Beall, 2007, Two routes to functional adaptation: tibetan and Andean high-altitude natives, Proc. Natl. Acad. Sci. USA, 104, 8655, 10.1073/pnas.0701985104 · DOI
- Brouwer, 1957, On simple formulae for calculating the heat expenditure and the quantities of carbohydrate and fat oxidized in metabolism of men and animals, from gaseous exchange (Oxygen intake and carbonic acid output) and urine-N, Acta Physiol. Pharmacol. Neerl., 6, 795
- Browning, 2006, Effects of obesity and sex on the energetic cost and preferred speed of walking, J. Appl. Physiol., 100, 390, 10.1152/japplphysiol.00767.2005 · DOI · Paper page
- Calbet, 2009, Air to muscle O2 delivery during exercise at altitude, High Alt. Med. Biol., 10, 123, 10.1089/ham.2008.1099 · DOI
- Calbet, 2009, On the mechanisms that limit oxygen uptake during exercise in acute and chronic hypoxia: role of muscle mass, J. Physiol., 587, 477, 10.1113/jphysiol.2008.162271 · DOI
- DeLorey, 2003, Relationship between pulmonary O2 uptake kinetics and muscle deoxygenation during moderate-intensity exercise, J. Appl. Physiol. (1985), 95, 113, 10.1152/japplphysiol.00956.2002 · DOI
- DeLorey, 2004, The effect of hypoxia on pulmonary O2 uptake, leg blood flow and muscle deoxygenation during single-leg knee-extension exercise, Exp. Physiol., 89, 293, 10.1113/expphysiol.2003.026864 · DOI
- Donelan, 1997, The effect of reduced gravity on the kinematics of human walking: a test of the dynamic similarity hypothesis for locomotion, J. Exp. Biol., 200, 3193, 10.1242/jeb.200.24.3193 · DOI · Paper page
- Engelen, 1996, Effects of hypoxic hypoxia on O2 uptake and heart rate kinetics during heavy exercise, J. Appl. Physiol. (1985), 81, 2500, 10.1152/jappl.1996.81.6.2500 · DOI · Paper page
- Erzurum, 2007, Higher blood flow and circulating NO products offset high-altitude hypoxia among Tibetans, Proc. Natl. Acad. Sci. USA, 104, 17593, 10.1073/pnas.0707462104 · DOI
- Grassi, 2003, Muscle oxygenation and pulmonary gas exchange kinetics during cycling exercise on-transitions in humans, J. Appl. Physiol. (1985), 95, 149, 10.1152/japplphysiol.00695.2002 · DOI · Paper page
- Horiuchi, 2014, Impact of viewing vs. not viewing a real forest on physiological and psychological responses in the same setting, Int. J. Environ. Res. Public Health, 11, 10883, 10.3390/ijerph111010883 · DOI
- Horiuchi, 2014, Differential effect of sympathetic activation on tissue oxygenation in gastrocnemius and soleus muscles during exercise in humans, Exp. Physiol., 99, 348, 10.1113/expphysiol.2013.075846 · DOI
- Horiuchi, 2014, Energy cost of pushing a wheelchair on various gradients in young men, Int. J. Indus. Ergon., 44, 442, 10.1016/j.ergon.2013.11.014 · DOI
- Horiuchi, 2015, Comparisons of energy cost and economical walking speed at various gradients in healthy active younger and older adults, J. Exerc. Sci. Fit., 13, 79, 10.1016/j.jesf.2015.06.001 · DOI
- Horiuchi, 2015, Impact of ischemic preconditioning on functional sympatholysis during handgrip exercise in humans, Physiol. Rep., 3, e12304, 10.14814/phy2.12304 · DOI
- Jacobs, 2013, Improvements in exercise performance with high-intensity interval training coincide with an increase in skeletal muscle mitochondrial content and function, J. Appl. Physiol. (1985), 115, 785, 10.1152/japplphysiol.00445.2013 · DOI
- Kashima, 2003, Spectroscopic measurement of blood volume and its oxygenation in a small volume of tissue using red laser lights and differential calculation between two point detections, Optics Laser Technol., 35, 485, 10.1016/S0030-3992(03)00066-5 · DOI
- Koga, 2007, Spatial heterogeneity of quadriceps muscle deoxygenation kinetics during cycle exercise, J. Appl. Physiol. (1985), 103, 2049, 10.1152/japplphysiol.00627.2007 · DOI
- Malatesta, 2003, Energy cost of walking and gait instability in healthy 65- and 80-yr-olds, J. Appl. Physiol. (1985), 95, 2248, 10.1152/japplphysiol.01106.2002 · DOI
- Maloiy, 1986, Energetic cost of carrying loads: have African women discovered an economic way?, Nature, 319, 668, 10.1038/319668a0 · DOI
- Marconi, 2005, Economy of locomotion in high-altitude Tibetan migrants exposed to normoxia, J. Physiol., 569, 667, 10.1113/jphysiol.2005.094979 · DOI
- Martin, 1992, Effects of age and physical activity status on the speed-aerobic demand relationship of walking, J. Appl. Physiol., 73, 200, 10.1152/jappl.1992.73.1.200 · DOI
- Masschelein, 2012, Dietary nitrate improves muscle but not cerebral oxygenation status during exercise in hypoxia, J. Appl. Physiol. (1985), 113, 736, 10.1152/japplphysiol.01253.2011 · DOI · Paper page
- McArdle, 1996, Exercise Physiology: Nutrition, Energy, and Human Performance 4the edition, Alphen aan den Rijn
- Minetti, 2006, Himalayan porter's specialization: metabolic power, economy, efficiency and skill, Proc. Biol. Sci., 273, 2791, 10.1098/rspb.2006.3653 · DOI
- Patterson, 1989, Time resolved reflectance and transmittance for the noninvasive measurement of tissue optical properties, Appl. Optics, 28, 2331, 10.1364/AO.28.002331 · DOI
- Peyrot, 2012, Why does walking economy improve after weight loss in obese adolescents?, Med. Sci. Sports Exerc., 44, 659, 10.1249/MSS.0b013e318236edd8 · DOI
- Poole, 1988, Metabolic and respiratory profile of the upper limit for prolonged exercise in man, Ergonomics, 31, 1265, 10.1080/00140138808966766 · DOI
- Saibene, 1990, The mechanisms for minimizing energy expenditure in human locomotion, Eur. J. Clin. Nutr., 44, 65
- Schoene, 2001, Limits of human lung function at high altitude, J. Exp. Biol., 204, 3121, 10.1242/jeb.204.18.3121 · DOI
- Wall-Scheffler, 2013, Reproductive costs for everyone: how female loads impact human mobility strategies, J. Hum. Evol., 64, 448, 10.1016/j.jhevol.2013.01.014 · DOI
- Wezenberg, 2013, Relation between aerobic capacity and walking ability in older adults with a lower-limb amputation, Arch. Phys. Med. Rehabil., 94, 1714, 10.1016/j.apmr.2013.02.016 · DOI
Cited by
Sorted by citations
Horiuchi, M., Endo, J., Dobashi, S., Handa, Y., Kiuchi, M., & Koyama, K. (2017) · Physiological Reports · doi:10.14814/phy2.13475 · Cited by 19
Self-citationCampbell, M. J., Cutler, S. L., & Dennison, P. E. (2024) · Scientific Reports · doi:10.1038/s41598-024-71359-6 · Cited by 7
Metadata
- Authors
- Horiuchi, M., Handa, Y., Abe, D., & Fukuoka, Y.
- Venue
- Biology Open
- Publisher
- The Company of Biologists
- Published
- 2016-10-15
- Volume
- 5
- Issue
- 10
- Pages
- 1408-1414
- ISSN
- 2046-6390
- PMC
- PMC5087691
- Cited by
- 16
- References
- 2
- Language
- en
- Funders
- Japan Society for the Promotion of Science (26440268JP, 26440266JP, 26650175JP)
About these checks
Registry, retraction, Cites and statistics results are computed, not judged, with one exception: a printed reference that no index lists is read once by a model before it counts as a citation error. Claims are extracted by a model and kept only when their quote appears verbatim in the text; each cited source is then checked, with a model’s help, for whether it says what the claim relies on. Those verdicts can be wrong — read the claim’s quote and the cited source before relying on one.
Statistics and arithmetic are recomputed, not judged.
Confidence bands are shown only for fields calibrated on our annotated test set. None is calibrated yet, so no band is shown.
What counts as a claim ›How we measure confidence ›How we check this ›
Are you an author, or do you see a problem with this page? Request a review
