

The DOI matches its Crossref record; 47 of the 47 references it cites were found in a registry or an index.
Power analysis and sample size estimation for RNA-Seq differential expression
Open accessAbstract
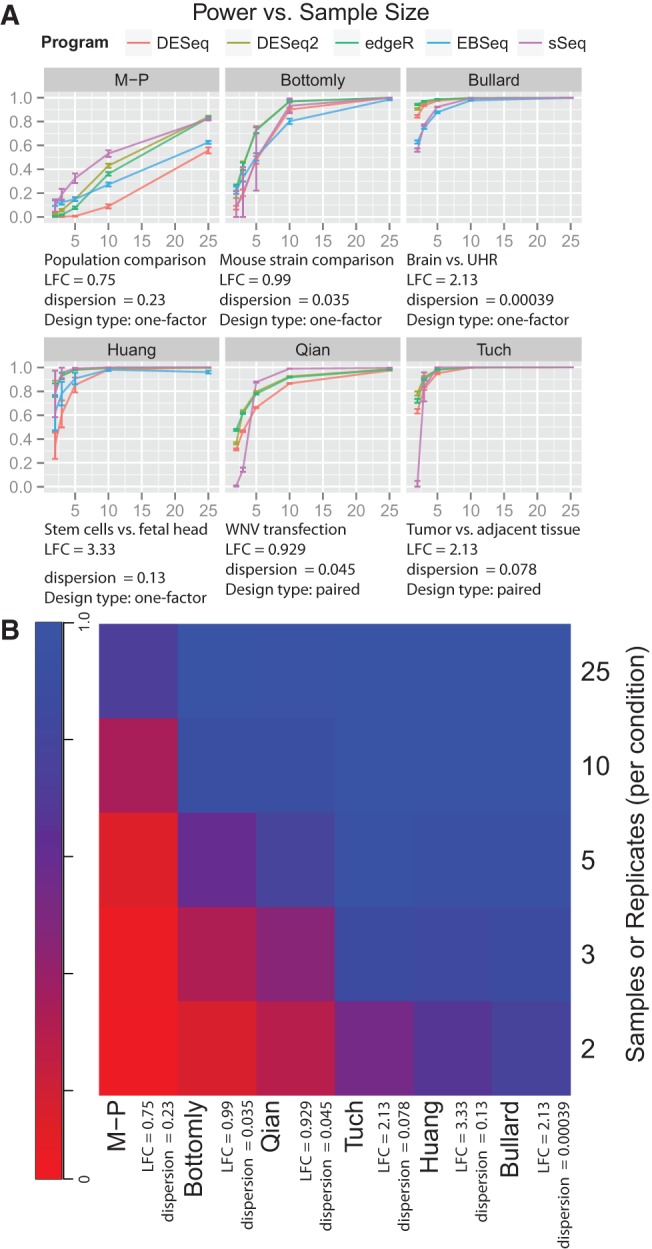
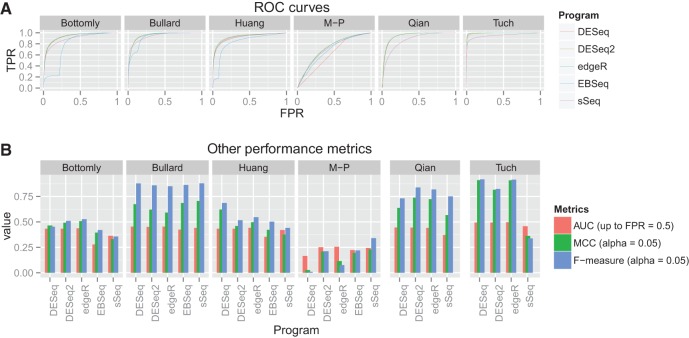
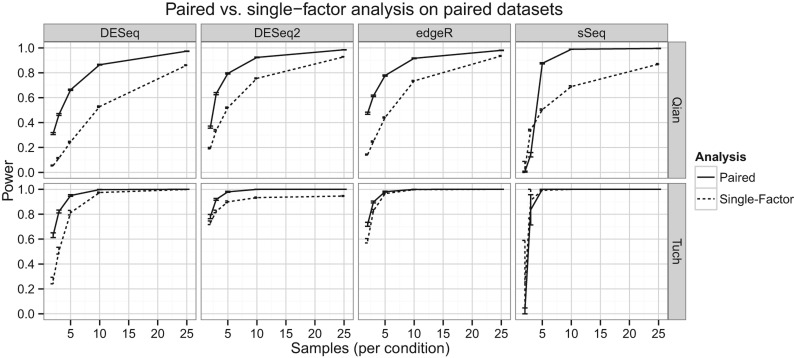
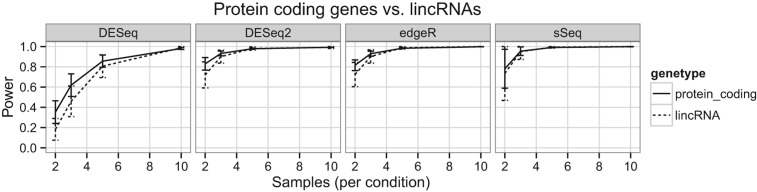
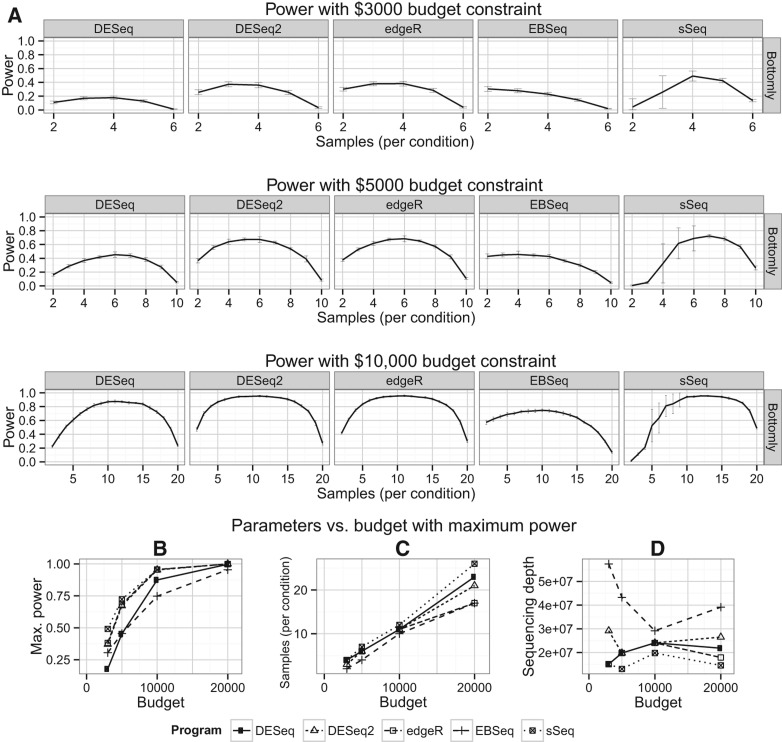
It is crucial for researchers to optimize RNA-seq experimental designs for differential expression detection. Currently, the field lacks general methods to estimate power and sample size for RNA-Seq in complex experimental designs, under the assumption of the negative binomial distribution. We simulate RNA-Seq count data based on parameters estimated from six widely different public data sets (including cell line comparison, tissue comparison, and cancer data sets) and calculate the statistical power in paired and unpaired sample experiments. We comprehensively compare five differential expression analysis packages (DESeq, edgeR, DESeq2, sSeq, and EBSeq) and evaluate their performance by power, receiver operator characteristic (ROC) curves, and other metrics including areas under the curve (AUC), Matthews correlation coefficient (MCC), and F -measures. DESeq2 and edgeR tend to give the best performance in general. Increasing sample size or sequencing depth increases power; however, increasing sample size is more potent than sequencing depth to increase power, especially when the sequencing depth reaches 20 million reads. Long intergenic noncoding RNAs (lincRNA) yields lower power relative to the protein coding mRNAs, given their lower expression level in the same RNA-Seq experiment. On the other hand, paired-sample RNA-Seq significantly enhances the statistical power, confirming the importance of considering the multifactor experimental design. Finally, a local optimal power is achievable for a given budget constraint, and the dominant contributing factor is sample size rather than the sequencing depth. In conclusion, we provide a power analysis tool ( http://www2.hawaii.edu/~lgarmire/RNASeqPowerCalculator.htm ) that captures the dispersion in the data and can serve as a practical reference under the budget constraint of RNA-Seq experiments.
Overview
The claims and statistics of this paper haven’t been checked yet.
Run the check — free, no account needed. It reads the open-access text and checks the sources it cites.
Integrity signals
Registry
Cites
Statistics
Figures
Verification
Claims the paper makes
The claims and statistics of this paper haven’t been checked yet.
Run the check — free, no account needed. It reads the open-access text and checks the sources it cites.
Claims other papers make about this one
Each is checked against this paper’s own text: does it say what the citing paper says it does?
In the citing paper
“For DGE and network analysis, there are many studies with guidelines that are based on theoretical models and empirical assessments40,173–176, but most studies use data from experiments that do not have the spatial, temporal or disease-relevant complexities that occur in studies of the CNS or post-mortem tissue.”
From Systems biology and gene networks in neurodevelopmental and neurodegenerative disorders (2015) · cites this paper as [176]
Self-check
Percentages, sums and reported differences re-computed from the paper’s own numbers.
The self-check needs the paper’s full text.
Citations
Cites
Moderated estimation of fold change and dispersion for RNA-seq data with DESeq2
Love, M. I., Huber, W., & Anders, S. (2014) · Genome Biology · doi:10.1186/s13059-014-0550-8 · Cited by 95,106
Robinson, M. D., McCarthy, D. J., & Smyth, G. K. (2010) · Bioinformatics · doi:10.1093/bioinformatics/btp616 · Cited by 41,364
Differential expression analysis for sequence count data
Anders, S., & Huber, W. (2010) · Genome Biology · doi:10.1186/gb-2010-11-10-r106 · Cited by 15,581
RNA-Seq: a revolutionary tool for transcriptomics
Wang, Z., Gerstein, M., & Snyder, M. (2009) · Nature Reviews Genetics · doi:10.1038/nrg2484 · Cited by 13,174
TopHat: discovering splice junctions with RNA-Seq
Trapnell, C., Pachter, L. S., & Salzberg, S. L. (2009) · Bioinformatics · doi:10.1093/bioinformatics/btp120 · Cited by 11,682
A scaling normalization method for differential expression analysis of RNA-seq data
Robinson, M. D., & Oshlack, A. (2010) · Genome Biology · doi:10.1186/gb-2010-11-3-r25 · Cited by 7,876
McCarthy, D. J., Chen, Y., & Smyth, G. K. (2012) · Nucleic Acids Research · doi:10.1093/nar/gks042 · Cited by 5,195
DEGseq: an R package for identifying differentially expressed genes from RNA-seq data
Wang, L., Feng, Z., Wang, X., Wang, X., & Zhang, X. (2010) · Bioinformatics · doi:10.1093/bioinformatics/btp612 · Cited by 4,553
Cabili, M. N., Trapnell, C., Goff, L. A., Koziol, M. J., Tazón‐Vega, B., Regev, A., & Rinn, J. L. (2011) · Genes & Development · doi:10.1101/gad.17446611 · Cited by 3,551
RNA-seq: An assessment of technical reproducibility and comparison with gene expression arrays
Marioni, J. C., Mason, C. E., Mane, S. M., Stephens, M., & Gilad, Y. (2008) · Genome Research · doi:10.1101/gr.079558.108 · Cited by 2,771
Moderated estimation of fold change and dispersion for RNA-seq data with DESeq2Preprint
Love, M. I., Huber, W. K., & Anders, S. (2014) · bioRxiv (Cold Spring Harbor Laboratory) · doi:10.1101/002832 · Cited by 1,849
Bullard, J. H., Purdom, E., Hansen, K. D., & Dudoit, S. (2010) · BMC Bioinformatics · doi:10.1186/1471-2105-11-94 · Cited by 1,680
Differential expression in RNA-seq: A matter of depth
Tarazona, S., García-Alcalde, F., Dopazo, J., Ferrer, A., & Conesa, A. (2011) · Genome Research · doi:10.1101/gr.124321.111 · Cited by 1,632
EBSeq: an empirical Bayes hierarchical model for inference in RNA-seq experiments
Leng, N., Dawson, J. A., Thomson, J. A., Ruotti, V., Rissman, A. I., Smits, B. M. G., Haag, J. D., Gould, M. N., Stewart, R. M., & Kendziorski, C. M. (2013) · Bioinformatics · doi:10.1093/bioinformatics/btt087 · Cited by 1,310
Understanding mechanisms underlying human gene expression variation with RNA sequencing
Pickrell, J. K., Marioni, J. C., Pai, A. A., Degner, J. F., Engelhardt, B. E., Nkadori, E., Veyrieras, J.-B., Stephens, M., Gilad, Y., & Pritchard, J. K. (2010) · Nature · doi:10.1038/nature08872 · Cited by 1,256
A comparison of methods for differential expression analysis of RNA-seq data
Soneson, C., & Delorenzi, M. (2013) · BMC Bioinformatics · doi:10.1186/1471-2105-14-91 · Cited by 887
Moderated statistical tests for assessing differences in tag abundance
Robinson, M. D., & Smyth, G. K. (2007) · Bioinformatics · doi:10.1093/bioinformatics/btm453 · Cited by 856
TopHat-Fusion: an algorithm for discovery of novel fusion transcripts
Kim, D., & Salzberg, S. L. (2011) · Genome biology · doi:10.1186/gb-2011-12-8-r72 · Cited by 816
Transcriptome genetics using second generation sequencing in a Caucasian population
Montgomery, S. B., Sammeth, M., Gutierrez-Arcelus, M., Lach, R. P., Ingle, C., Nisbett, J., Guigo, R., & Dermitzakis, E. T. (2010) · Nature · doi:10.1038/nature08903 · Cited by 797
Maximum Likelihood Algorithms for Generalized Linear Mixed Models
McCulloch, C. E. (1997) · Journal of the American Statistical Association · doi:10.1080/01621459.1997.10473613 · Cited by 762
Comprehensive evaluation of differential gene expression analysis methods for RNA-seq data
Rapaport, F., Khanin, R., Liang, Y., Pirun, M., Krek, A., Zumbo, P., Mason, C. E., Socci, N. D., & Betel, D. (2013) · Genome Biology · doi:10.1186/gb-2013-14-9-r95 · Cited by 733
RNA-seq differential expression studies: more sequence or more replication?
Liu, Y., Zhou, J., & White, K. P. (2014) · Bioinformatics · doi:10.1093/bioinformatics/btt688 · Cited by 497
Statistical inferences for isoform expression in RNA-Seq
Jiang, H., & Wong, W. H. (2009) · Bioinformatics · doi:10.1093/bioinformatics/btp113 · Cited by 468
Morin, R. D., Bainbridge, M. N., Fejes, A. P., Hirst, M., Krzywinski, M. I., Pugh, T. J., McDonald, H., Varhol, R., Jones, S. J. M., & Marra, M. A. (2008) · BioTechniques · doi:10.2144/000112900 · Cited by 433
Calculating Sample Size Estimates for RNA Sequencing Data
Hart, S. N., Therneau, T. M., Zhang, Y., Poland, G. A., & Kocher, J.-P. (2013) · Journal of Computational Biology · doi:10.1089/cmb.2012.0283 · Cited by 341
Nookaew, I., Papini, M., Pornputtapong, N., Scalcinati, G., Fagerberg, L., Uhlén, M., & Nielsen, J. (2012) · Nucleic Acids Research · doi:10.1093/nar/gks804 · Cited by 309
RNA-seq: technical variability and sampling
McIntyre, L. M., Lopiano, K. K., Morse, A. M., Amin, V., Oberg, A. L., Young, L. J., & Nuzhdin, S. V. (2011) · BMC Genomics · doi:10.1186/1471-2164-12-293 · Cited by 285
A comparison of statistical methods for detecting differentially expressed genes from RNA‐seq data
Kvam, V. M., Liu, P., & Si, Y. (2012) · American Journal of Botany · doi:10.3732/ajb.1100340 · Cited by 281
Data-based filtering for replicated high-throughput transcriptome sequencing experiments
Rau, A., Gallopin, M., Celeux, G., & Jaffrézic, F. (2013) · Bioinformatics · doi:10.1093/bioinformatics/btt350 · Cited by 262
A new shrinkage estimator for dispersion improves differential expression detection in RNA-seq data
Wu, H., Wang, C., & Wu, Z. J. (2012) · Biostatistics · doi:10.1093/biostatistics/kxs033 · Cited by 248
Vijay, N., Poelstra, J. W., Künstner, A., & Wolf, J. B. W. (2012) · Molecular Ecology · doi:10.1111/mec.12014 · Cited by 230
Evaluating Gene Expression in C57BL/6J and DBA/2J Mouse Striatum Using RNA-Seq and Microarrays
Bottomly, D., Walter, N. A. R., Hunter, J. E., Darakjian, P., Kawane, S., Buck, K. J., Searles, R. P., Mooney, M. A., McWeeney, S. K., & HITZEMANN, R. J. (2011) · PLoS ONE · doi:10.1371/journal.pone.0017820 · Cited by 229
Robles, J. A., Qureshi, S. E., Stephen, S. J., Wilson, S. R., Burden, C. J., & Taylor, J. M. (2012) · BMC Genomics · doi:10.1186/1471-2164-13-484 · Cited by 198
Mutch, D. M., Berger, A., Mansourian, R., Rytz, A., & Roberts, M.-A. (2002) · BMC Bioinformatics · doi:10.1186/1471-2105-3-17 · Cited by 182
Maximum Likelihood Algorithms for Generalized Linear Mixed Models
McCulloch, C. E. (1997) · Journal of the American Statistical Association · doi:10.2307/2291460 · Cited by 164
A two-parameter generalized Poisson model to improve the analysis of RNA-seq data
Srivastava, S., & Chen, L. (2010) · Nucleic Acids Research · doi:10.1093/nar/gkq670 · Cited by 161
ReCount: A multi-experiment resource of analysis-ready RNA-seq gene count datasets
Frazee, A. C., Langmead, B., & Leek, J. T. (2011) · BMC Bioinformatics · doi:10.1186/1471-2105-12-449 · Cited by 157
Tuch, B. B., Laborde, R. R., Xu, X. J., Gu, J. H., Chung, C. B., Monighetti, C. K., Stanley, S. J., Olsen, K. D., Kasperbauer, J. L., Moore, E. J., et al. (2010) · PLoS ONE · doi:10.1371/journal.pone.0009317 · Cited by 150
Scotty: a web tool for designing RNA-Seq experiments to measure differential gene expression
Busby, M. A., Stewart, C., Miller, C. A., Grzeda, K. R., & Marth, G. T. (2013) · Bioinformatics · doi:10.1093/bioinformatics/btt015 · Cited by 140
Yu, D., Huber, W. K., & Vitek, O. (2013) · Bioinformatics · doi:10.1093/bioinformatics/btt143 · Cited by 134
Huang, R., Jaritz, M., Guenzl, P. M., Vlatkovic, I., Sommer, A., Tamir, I., Marks, H., Klampfl, T., Královics, R., Stunnenberg, H. G., et al. (2011) · PLoS ONE · doi:10.1371/journal.pone.0027288 · Cited by 112
An accurate paired sample test for count data
Pham, T. V., & Jiménez, C. R. (2012) · Bioinformatics · doi:10.1093/bioinformatics/bts394 · Cited by 72
Aban, I., Cutter, G., & Mavinga, N. (2008) · Computational Statistics & Data Analysis · doi:10.1016/j.csda.2008.07.034 · Cited by 69
Statistical methods on detecting differentially expressed genes for RNA-seq data
Chen, Z., Liu, J., Ng, H. K. T., Nadarajah, S., Kaufman, H. L., Yang, J. Y., & Deng, Y. (2011) · BMC Systems Biology · doi:10.1186/1752-0509-5-s3-s1 · Cited by 58
Li, C.-I., Su, P.-F., & Shyr, Y. (2013) · BMC Bioinformatics · doi:10.1186/1471-2105-14-357 · Cited by 43
Qian, F., Chung, L. M., Zheng, W., Bruno, V. M., Alexander, R. P., Wang, Z., Wang, X., Kurscheid, S., Zhao, H., Fikrig, E., et al. (2013) · Viruses · doi:10.3390/v5071664 · Cited by 30
Garmire, L. X., Garmire, D. G., Huang, W. J. M., Yao, J., Glass, C. K., & Subramaniam, S. (2011) · PLoS ONE · doi:10.1371/journal.pone.0024051 · Cited by 27
Self-citation
Cited by
Sorted by citations
Shen, S., Park, J. W., Lu, Z.-X., Lin, L., Henry, M. D., Wu, Y. N., Zhou, Q., & Xing, Y. (2014) · Proceedings of the National Academy of Sciences · doi:10.1073/pnas.1419161111 · Cited by 2,713
Systems biology and gene networks in neurodevelopmental and neurodegenerative disorders
Parikshak, N. N., Gandal, M. J., & Geschwind, D. H. (2015) · Nature Reviews Genetics · doi:10.1038/nrg3934 · Cited by 430
Resolving host–pathogen interactions by dual RNA-seq
Westermann, A. J., Barquist, L., & Vogel, J. (2017) · PLoS Pathogens · doi:10.1371/journal.ppat.1006033 · Cited by 301
The draft genome of tropical fruit durian (Durio zibethinus)
Teh, B. T., Lim, K. J., Yong, C. H., Ng, C. C. Y., Rao, S. R., Rajasegaran, V., Lim, W. K., Ong, C. K., Chan, K. C., Cheng, V. K. Y., et al. (2017) · Nature Genetics · doi:10.1038/ng.3972 · Cited by 256
A broken promise: microbiome differential abundance methods do not control the false discovery rate
Hawinkel, S., Mattiello, F., Bijnens, L., & Thas, O. (2019) · Briefings in Bioinformatics · doi:10.1093/bib/bbx104 · Cited by 199
Metadata
- Authors
- Ching, T., Huang, S., & Garmire, L. X.
- Affiliations
- University of Hawaiʻi at Mānoa (US)
- Corresponding author
- Garmire, Lana X.
- Venue
- RNA
- Publisher
- Cold Spring Harbor Laboratory
- Published
- 2014-09-22
- Volume
- 20
- Issue
- 11
- Pages
- 1684-1696
- ISSN
- 1355-8382 (ISSN-L)
- 1469-9001
- PMC
- PMC4201821
- OpenAlex
- W2157710407
- Cited by
- 263
- References
- 45
- Citations by year
- 2026: 17 · 2025: 24 · 2024: 17 · 2023: 23 · 2022: 19 · 2021: 24 · 2020: 28 · 2019: 31 · 2018: 27 · 2017: 20 · 2016: 23 · 2015: 6 · 2014: 3
- FWCI
- 7.10
- Type
- journal article
- Language
- en
- Open access
- hybrid
- doi.org
- Licence
- cc-by-nc
- Locations
- RNA (publishedVersion, cc-by-nc)
- Europe PMC (PubMed Central) (publishedVersion, cc-by-nc)
- PubMed Central (publishedVersion, cc-by-nc)
- PubMed (publishedVersion)
- HighWire Press Open Archive (submittedVersion)
- Funders
- National Institute of General Medical Sciences (P20 COBRE GM103457)
- Topics
- Life Sciences › Biochemistry, Genetics and Molecular Biology › Molecular Biology › Gene expression and cancer classification
- Life Sciences › Biochemistry, Genetics and Molecular Biology › Molecular Biology › Genomics and Phylogenetic Studies
- Life Sciences › Biochemistry, Genetics and Molecular Biology › Molecular Biology › Single-cell and spatial transcriptomics
- Keywords
- RNA-seq, statistical power, sample size determination, differential gene expression, negative binomial distribution, DESeq2, edgeR, sequencing depth, long intergenic non-coding RNA
- MeSH terms
- Animals, Computer Simulation, Humans, Regression Analysis, Research Design, RNA, Messenger, Software, Reproducibility of Results, Sequence Analysis, RNA, Sample Size, Gene Expression Profiling, Databases, Genetic, Mice, High-Throughput Nucleotide Sequencing
About these checks
Registry, retraction, Cites and statistics results are computed, not judged, with one exception: a printed reference that no index lists is read once by a model before it counts as a citation error. Claims are extracted by a model and kept only when their quote appears verbatim in the text; each cited source is then checked, with a model’s help, for whether it says what the claim relies on. Those verdicts can be wrong — read the claim’s quote and the cited source before relying on one.
Statistics and arithmetic are recomputed, not judged.
Confidence bands are shown only for fields calibrated on our annotated test set. None is calibrated yet, so no band is shown.
What counts as a claim ›How we measure confidence ›How we check this ›
Are you an author, or do you see a problem with this page? Request a review
