

The DOI matches its Crossref record; 52 of the 53 references it cites were found in a registry or an index.
Arsenic Exposure and Hypertension: A Systematic Review
Open accessAbstract
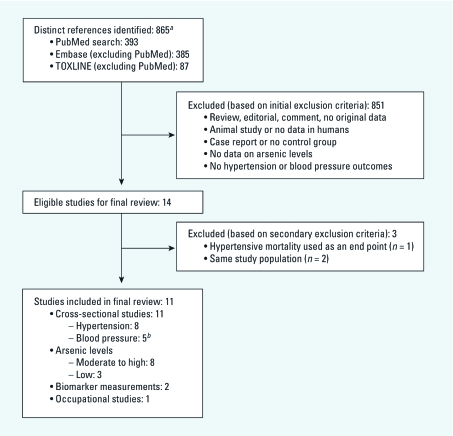
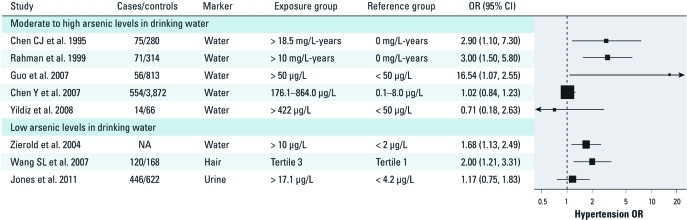
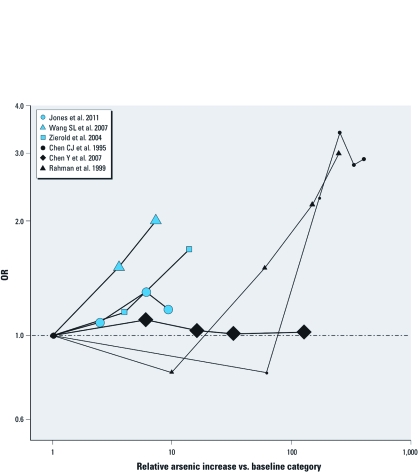
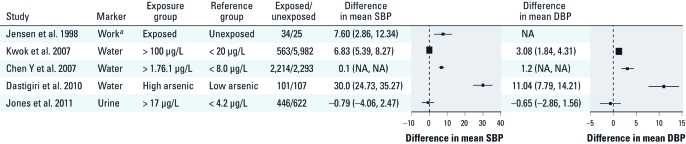
Background: Environmental exposure to arsenic has been linked to hypertension in persons living in arsenic-endemic areas. Objective: We summarized published epidemiologic studies concerning arsenic exposure and hypertension or blood pressure (BP) measurements to evaluate the potential relationship. Data sources and extraction: We searched PubMed, Embase, and TOXLINE and applied predetermined exclusion criteria. We identified 11 cross-sectional studies from which we abstracted or derived measures of association and calculated pooled odds ratios (ORs) using inverse-variance weighted random-effects models. Data synthesis: The pooled OR for hypertension comparing the highest and lowest arsenic exposure categories was 1.27 [95% confidence interval (CI): 1.09, 1.47; p-value for heterogeneity = 0.001; I2 = 70.2%]. In populations with moderate to high arsenic concentrations in drinking water, the pooled OR was 1.15 (95% CI: 0.96, 1.37; p-value for heterogeneity = 0.002; I2 = 76.6%) and 2.57 (95% CI: 1.56, 4.24; p-value for heterogeneity = 0.13; I2 = 46.6%) before and after excluding an influential study, respectively. The corresponding pooled OR in populations with low arsenic concentrations in drinking water was 1.56 (95% CI: 1.21, 2.01; p-value for heterogeneity = 0.27; I2 = 24.6%). A dose–response assessment including six studies with available data showed an increasing trend in the odds of hypertension with increasing arsenic exposure. Few studies have evaluated changes in systolic and diastolic BP (SBP and DBP, respectively) measurements by arsenic exposure levels, and those studies reported inconclusive findings. Conclusion: In this systematic review we identified an association between arsenic and the prevalence of hypertension. Interpreting a causal effect of environmental arsenic on hypertension is limited by the small number of studies, the presence of influential studies, and the absence of prospective evidence. Additional evidence is needed to evaluate the dose–response relationship between environmental arsenic exposure and hypertension.
Overview
The claims and statistics of this paper haven’t been checked yet.
Run the check — free, no account needed. It reads the open-access text and checks the sources it cites.
Integrity signals
Registry
Cites
Statistics
Figures
Verification
Claims the paper makes
The claims and statistics of this paper haven’t been checked yet.
Run the check — free, no account needed. It reads the open-access text and checks the sources it cites.
Claims other papers make about this one
Each is checked against this paper’s own text: does it say what the citing paper says it does?
The check wasn’t confident either way, so it gives no verdict — never disputed.
In the citing paper
“Researchers have pointed out that trivalent arsenicals (AsIII, MMAIII, and DMAIII) can induce diabetes via distortion of glucose metabolism based on intact pancreatic islets from mice [75, 76].”
From Arsenic Contamination of Groundwater: A Review of Sources, Prevalence, Health Risks, and Strategies for Mitigation (2014) · cites this paper as [76]
Experimental — accuracy not yet measured
Self-check
Percentages, sums and reported differences re-computed from the paper’s own numbers.
The self-check needs the paper’s full text.
Citations
Cites
Quantifying heterogeneity in a meta‐analysis
Higgins, J. P. T., & Thompson, S. G. (2002) · Statistics in Medicine · doi:10.1002/sim.1186 · Cited by 36,763
A review of the source, behaviour and distribution of arsenic in natural waters
Smedley, P. L., & Kinniburgh, D. G. (2002) · Applied Geochemistry · doi:10.1016/s0883-2927(02)00018-5 · Cited by 7,691
Lopez, A. D., Mathers, C. D., Ezzati, M., Jamison, D. T., & Murray, C. J. (2006) · The Lancet · doi:10.1016/s0140-6736(06)68770-9 · Cited by 5,630
Mortality by cause for eight regions of the world: Global Burden of Disease Study
Murray, C. J., & Lopez, A. D. (1997) · The Lancet · doi:10.1016/s0140-6736(96)07493-4 · Cited by 4,043
World Health Organization, I. S. O. H. W. G. (2003) · Journal of Hypertension · doi:10.1097/00004872-200311000-00002 · Cited by 2,667
Lead Exposure and Cardiovascular Disease—A Systematic Review
Navas‐Acién, A., Güallar, E., Silbergeld, E. K., & Rothenberg, S. J. (2006) · Environmental Health Perspectives · doi:10.1289/ehp.9785 · Cited by 1,142
Arsenic: exposure and health effects
(1998) · Choice Reviews Online · doi:10.5860/choice.35-5073 · Cited by 802
Oparil, S., Zaman, M. A., & Calhoun, D. A. (2003) · Annals of Internal Medicine · doi:10.7326/0003-4819-139-9-200311040-00011 · Cited by 691
Wu, M., Kuo, T., HWANG, Y.-H., & Chen, C. (1989) · American Journal of Epidemiology · doi:10.1093/oxfordjournals.aje.a115439 · Cited by 648
The Primary Prevention of Myocardial Infarction
Manson, J. E., Tosteson, H., Ridker, P. M., Satterfield, S., Hebert, P., O'Connor, G. T., Buring, J. E., & Hennekens, C. H. (1992) · New England Journal of Medicine · doi:10.1056/nejm199205213262107 · Cited by 508
Cited by
Sorted by citations
Naujokas, M. F., Anderson, B., Ahsan, H., Aposhian, H. V., Graziano, J. H., Thompson, C., & Suk, W. A. (2013) · Environmental Health Perspectives · doi:10.1289/ehp.1205875 · Cited by 1,372
Heavy metals: toxicity and human health effects
Jomová, K., Alomar, S. Y., Nepovimová, E., Kuča, K., & Valko, M. (2024) · Archives of Toxicology · doi:10.1007/s00204-024-03903-2 · Cited by 1,229
Chowdhury, R., Ramond, A., O’Keeffe, L. M., Shahzad, S., Kunutsor, S. K., Muka, T., Gregson, J., Willeit, P., Warnakula, S., Khan, H., et al. (2018) · BMJ · doi:10.1136/bmj.k3310 · Cited by 638
Shankar, S., Shanker, U., & Shikha (2014) · The Scientific World Journal · doi:10.1155/2014/304524 · Cited by 616
“There are several pathways for arsenic-induced hypertension, including promotion of inflammation activity and endothelial dysfunction, alteration of vascular tone in blood vessels, andmalfunctioning of kidney [78].”
BackgroundEnvironmental factors in cardiovascular disease
Cosselman, K. E., Navas-Acien, A., & Kaufman, J. D. (2015) · Nature Reviews Cardiology · doi:10.1038/nrcardio.2015.152 · Cited by 613
Metadata
- Authors
- Abhyankar, L. N., Jones, M. R., Guallar, E., & Navas-Acien, A.
- Affiliations
- Johns Hopkins University (US)
- Department of Epidemiology and Welch Center for Prevention, Epidemiology and Clinical Research, Johns Hopkins Bloomberg School of Public Health, Baltimore, Maryland, USA
- Department of Environmental Health Sciences, and
- ORCID
- Jones, Miranda R.
- Venue
- Environmental Health Perspectives
- Publisher
- American Chemical Society (ACS)
- Published
- 2011-12-02
- Volume
- 120
- Issue
- 4
- Pages
- 494-500
- ISSN
- 0091-6765 (ISSN-L)
- 1552-9924
- PMC
- PMC3339454
- OpenAlex
- W1984271811
- Cited by
- 281
- References
- 53
- Citations by year
- 2026: 11 · 2025: 12 · 2024: 22 · 2023: 5 · 2022: 25 · 2021: 31 · 2020: 28 · 2019: 17 · 2018: 18 · 2017: 22 · 2016: 22 · 2015: 24 · 2014: 25 · 2013: 17 · 2012: 2
- FWCI
- 1.15
- Type
- journal article
- Language
- en
- Open access
- gold
- doi.org
- Licence
- public-domain
- creativecommons.org/licenses/by/4.0/ (vor, 2219 d)
- Locations
- Environmental Health Perspectives (publishedVersion, public-domain)
- Europe PMC (PubMed Central) (publishedVersion, public-domain)
- PubMed Central (publishedVersion, public-domain)
- PubMed (publishedVersion)
- Funders
- National Institutes of Health (5r01hl090863-04)
- National Heart, Lung, and Blood Institute (R01-HL-090863)
- Topics
- Physical Sciences › Environmental Science › Environmental Chemistry › Arsenic contamination and mitigation
- Physical Sciences › Environmental Science › Health, Toxicology and Mutagenesis › Heavy Metal Exposure and Toxicity
- Health Sciences › Medicine › Cardiology and Cardiovascular Medicine › Blood Pressure and Hypertension Studies
- Keywords
- arsenic exposure, hypertension, blood pressure, drinking water arsenic, dose-response relationship, arsenic endemic areas, environmental arsenic, systolic blood pressure, diastolic blood pressure
- MeSH terms
- Arsenic, Blood Pressure, Dose-Response Relationship, Drug, Environmental Exposure, Humans, Hypertension, Prevalence, Drinking Water
About these checks
Registry, retraction, Cites and statistics results are computed, not judged, with one exception: a printed reference that no index lists is read once by a model before it counts as a citation error. Claims are extracted by a model and kept only when their quote appears verbatim in the text; each cited source is then checked, with a model’s help, for whether it says what the claim relies on. Those verdicts can be wrong — read the claim’s quote and the cited source before relying on one.
Statistics and arithmetic are recomputed, not judged.
Confidence bands are shown only for fields calibrated on our annotated test set. None is calibrated yet, so no band is shown.
What counts as a claim ›How we measure confidence ›How we check this ›
Are you an author, or do you see a problem with this page? Request a review
