

The DOI matches its Crossref record; 75 of the 75 references it cites were found in a registry or an index.
Molecular Mechanisms of the Diabetogenic Effects of Arsenic: Inhibition of Insulin Signaling by Arsenite and Methylarsonous Acid
Open accessAbstract
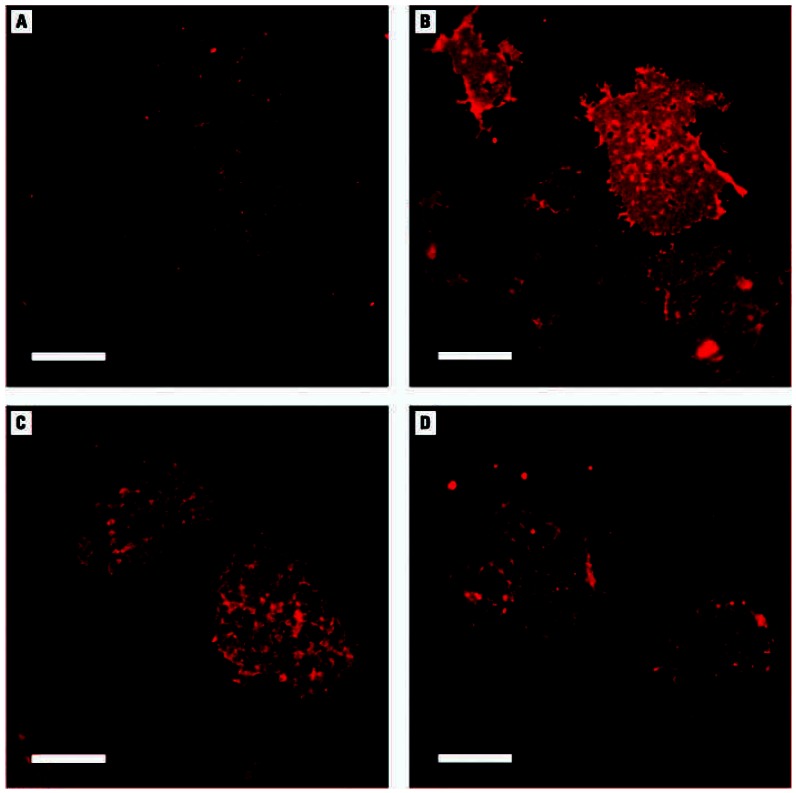
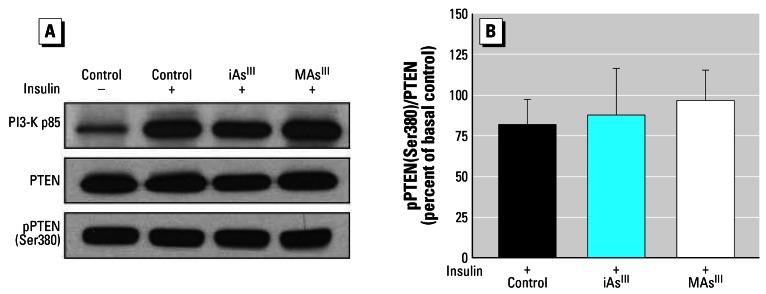
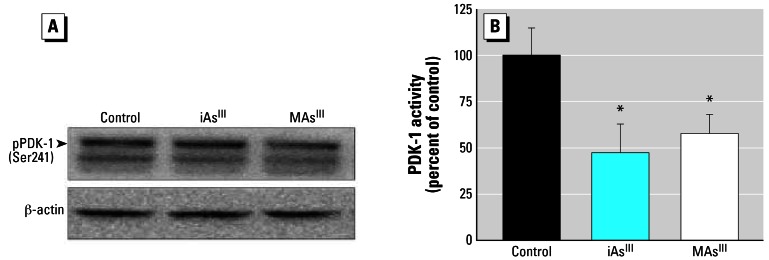
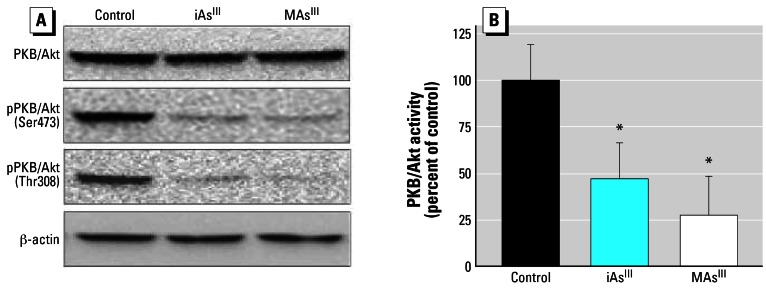
Background: Increased prevalences of diabetes mellitus have been reported among individuals chronically exposed to inorganic arsenic (iAs). However, the mechanisms underlying the diabetogenic effects of iAs have not been characterized. We have previously shown that trivalent metabolites of iAs, arsenite (iAsIII) and methylarsonous acid (MAsIII) inhibit insulin-stimulated glucose uptake (ISGU) in 3T3-L1 adipocytes by suppressing the insulin-dependent phosphorylation of protein kinase B (PKB/Akt). Objectives: Our goal was to identify the molecular mechanisms responsible for the suppression of PKB/Akt phosphorylation by iAsIII and MAsIII. Methods: The effects of iAsIII and MAsIII on components of the insulin-activated signal transduction pathway that regulate PKB/Akt phosphorylation were examined in 3T3-L1 adipocytes. Results: Subtoxic concentrations of iAsIII or MAsIII had little or no effect on the activity of phosphatidylinositol 3-kinase (PI-3K), which synthesizes phosphatidylinositol-3,4,5-triphosphate (PIP3), or on phosphorylation of PTEN (phosphatase and tensin homolog deleted on chromosome ten), a PIP3 phosphatase. Neither iAsIII nor MAsIII interfered with the phosphorylation of 3-phosphoinositide-dependent kinase-1 (PDK-1) located downstream from PI-3K. However, PDK-1 activity was inhibited by both iAsIII and MAsIII. Consistent with these findings, PDK-1-catalyzed phosphorylation of PKB/Akt(Thr308) and PKB/Akt activity were suppressed in exposed cells. In addition, PKB/Akt(Ser473) phosphorylation, which is catalyzed by a putative PDK-2, was also suppressed. Notably, expression of constitutively active PKB/Akt restored the normal ISGU pattern in adipocytes treated with either iAsIII or MAsIII. Conclusions: These results suggest that inhibition of the PDK-1/PKB/Akt-mediated transduction step is the key mechanism for the inhibition of ISGU in adipocytes exposed to iAsIII or MAsIII, and possibly for impaired glucose tolerance associated with human exposures to iAs.
Overview
The claims and statistics of this paper haven’t been checked yet.
Run the check — free, no account needed. It reads the open-access text and checks the sources it cites.
Integrity signals
Registry
Cites
Statistics
Figures
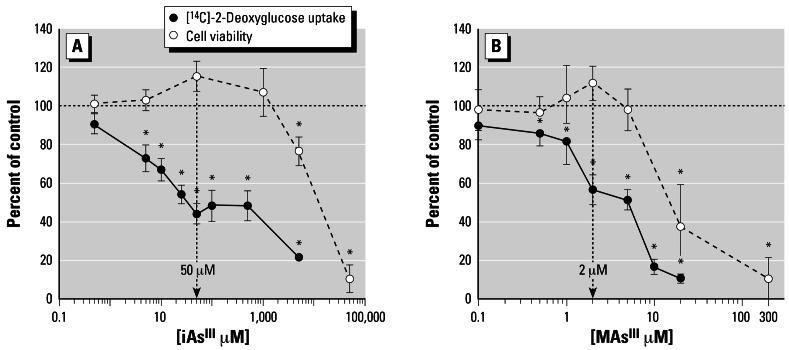
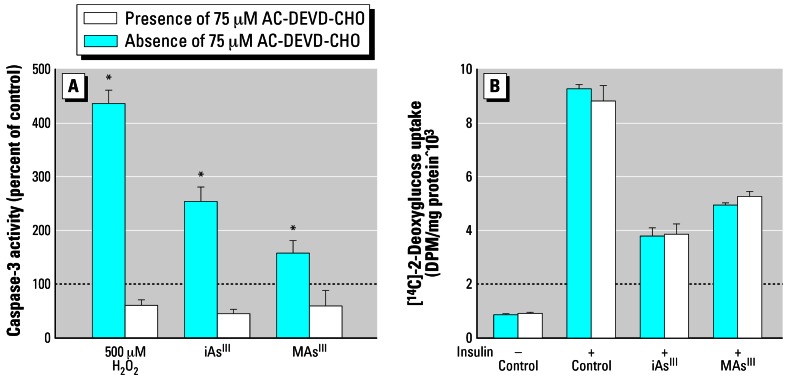
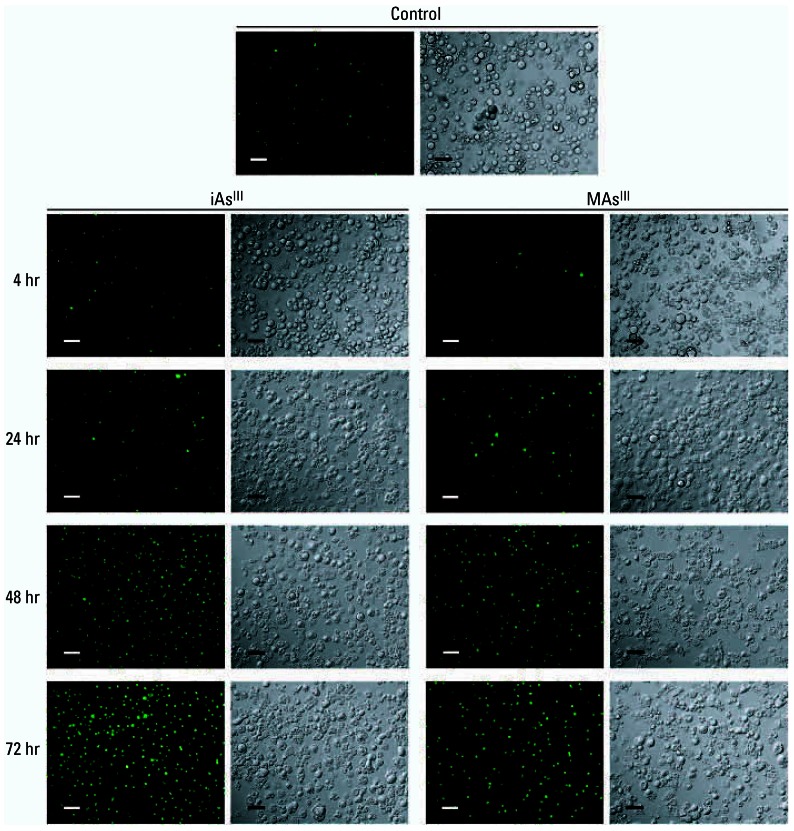
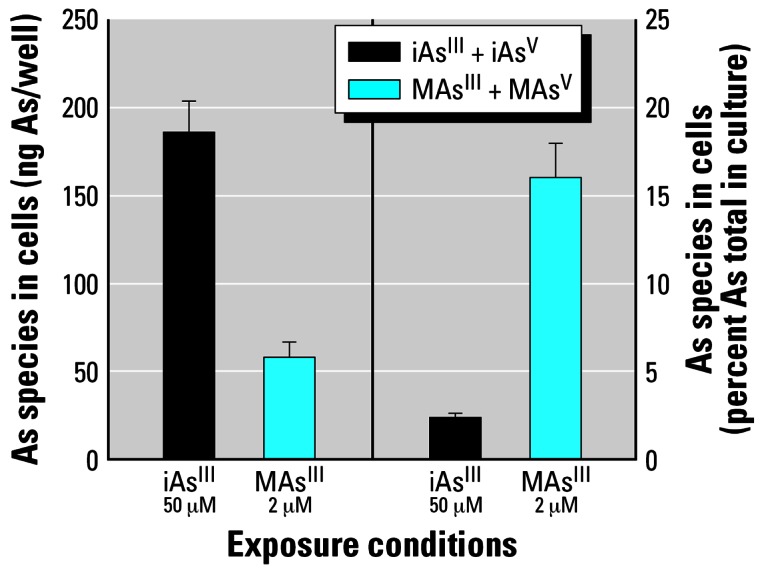
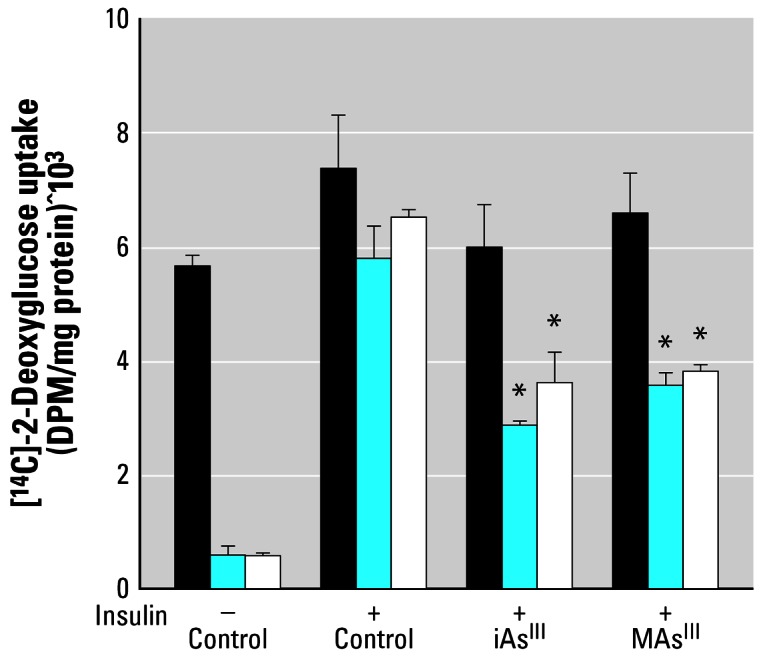
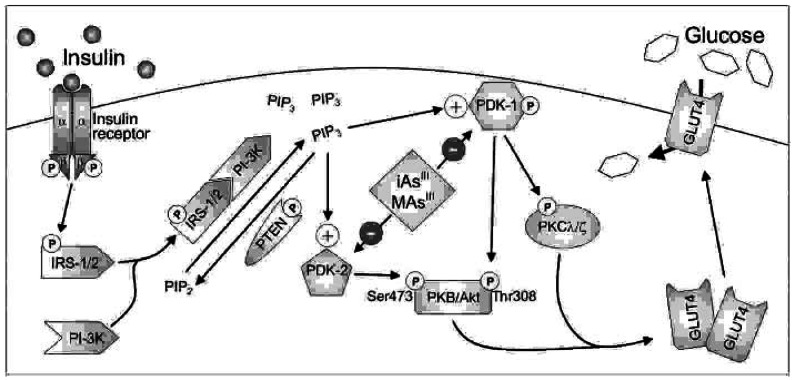
Verification
Claims the paper makes
The claims and statistics of this paper haven’t been checked yet.
Run the check — free, no account needed. It reads the open-access text and checks the sources it cites.
Claims other papers make about this one
Each is checked against this paper’s own text: does it say what the citing paper says it does?
The source backs part of the claim, not all of it — or backs it for a different population, condition or comparison.
In the citing paper
“Besides being well-known carcinogen, arsenic also causes a number of noncancerous multisystemic diseases including cardiovascular disease, dermal disease, hypertension, and diabetes mellitus [73, 74].”
From Arsenic Contamination of Groundwater: A Review of Sources, Prevalence, Health Risks, and Strategies for Mitigation (2014) · cites this paper as [73]
Experimental — accuracy not yet measured
Self-check
Percentages, sums and reported differences re-computed from the paper’s own numbers.
The self-check needs the paper’s full text.
Citations
Cites
Carmichael, J., DeGraff, W., Gazdar, A. F., Minna, J. D., & Mitchell, J. B. (1987) · PubMed · Cited by 3,813
Maehama, T., & Dixon, J. E. (1998) · Journal of Biological Chemistry · doi:10.1074/jbc.273.22.13375 · Cited by 3,104
White, M. F., & Kahn, C. R. (1994) · Journal of Biological Chemistry · doi:10.1016/s0021-9258(17)42297-6 · Cited by 1,707
Kohn, A. D., Summers, S. A., Birnbaum, M. J., & Roth, R. A. (1996) · Journal of Biological Chemistry · doi:10.1074/jbc.271.49.31372 · Cited by 1,284
Protein Kinase C Isotypes Controlled by Phosphoinositide 3-Kinase Through the Protein Kinase PDK1
Good, J. A. L., Ziegler, W. H., Parekh, D. B., Alessi, D. R., Cohen, P., & Parker, P. J. (1998) · Science · doi:10.1126/science.281.5385.2042 · Cited by 1,113
Overall evaluations of carcinogenicity: an updating of IARC Monographs volumes 1 to 42.
(1987) · PubMed · Cited by 850
Alessi, D. R., Deák, M., Casamayor, A., Caudwell, F. B., MORRICE, N. A., Norman, D. G., Gaffney, P. R. J., Reese, C. B., MacDougall, C. N., Harbison, D., et al. (1997) · Current Biology · doi:10.1016/s0960-9822(06)00336-8 · Cited by 755
The Tumor Suppressor PTEN Is Phosphorylated by the Protein Kinase CK2 at Its C Terminus
Torres, J., & Pulido, R. (2001) · Journal of Biological Chemistry · doi:10.1074/jbc.m009134200 · Cited by 630
Regulation of protein kinase C ζ by PI 3-kinase and PDK-1
Chou, M. M., Hou, W., Johnson, J. E., Graham, L. K., Lee, M. H., Chen, C., Newton, A. C., Schaffhausen, B. S., & Toker, A. (1998) · Current Biology · doi:10.1016/s0960-9822(98)70444-0 · Cited by 608
The Cellular Metabolism and Systemic Toxicity of Arsenic
Thomas, D. J., Stýblo, M., & Lin, S. (2001) · Toxicology and Applied Pharmacology · doi:10.1006/taap.2001.9258 · Cited by 592
Self-citation
Cited by
Sorted by citations
Metabolism disrupting chemicals and metabolic disorders
Heindel, J. J., Blumberg, B., Cave, M., Machtinger, R., Mantovani, A., Mendez, M. A., Nadal, A., Palanza, P., Panzica, G., Sargis, R., et al. (2017) · Reproductive Toxicology · doi:10.1016/j.reprotox.2016.10.001 · Cited by 1,101
Shankar, S., Shanker, U., & Shikha (2014) · The Scientific World Journal · doi:10.1155/2014/304524 · Cited by 616
“Researchers have pointed out that trivalent arsenicals (AsIII, MMAIII, and DMAIII) can induce diabetes via distortion of glucose metabolism based on intact pancreatic islets from mice [75, 76].”
BackgroundEndocrine-Disrupting Chemicals: Associated Disorders and Mechanisms of Action
Coster, S. D., & Larebeke, N. V. (2012) · Journal of Environmental and Public Health · doi:10.1155/2012/713696 · Cited by 622
Arsenic Exposure and Prevalence of Type 2 Diabetes in US Adults
Navas‐Acién, A. (2008) · JAMA · doi:10.1001/jama.300.7.814 · Cited by 467
Arsenic and selenium toxicity and their interactive effects in humans
Sun, H., Rathinasabapathi, B., Wu, B., Luo, J. H., Pu, L.-P., & Ma, L. Q. (2014) · Environment International · doi:10.1016/j.envint.2014.04.019 · Cited by 420
Metadata
- Authors
- Paul, D. S., Harmon, A. W., Devesa, V., Thomas, D. J., & Stýblo, M.
- Affiliations
- University of North Carolina at Chapel Hill (US)
- Department of Nutrition and
- Environmental Protection Agency (US)
- Corresponding author
- Stýblo, Miroslav
- Venue
- Environmental Health Perspectives
- Publisher
- American Chemical Society (ACS)
- Published
- 2007-01-29
- Volume
- 115
- Issue
- 5
- Pages
- 734-742
- ISSN
- 0091-6765 (ISSN-L)
- 1552-9924
- PMC
- PMC1867998
- OpenAlex
- W1987873876
- Cited by
- 161
- References
- 75
- Citations by year
- 2026: 3 · 2025: 2 · 2024: 6 · 2023: 11 · 2022: 8 · 2021: 11 · 2020: 5 · 2019: 8 · 2018: 5 · 2017: 15 · 2016: 9 · 2015: 12 · 2014: 9 · 2013: 11 · 2012: 13
- FWCI
- 5.54
- Type
- journal article
- Language
- en
- Open access
- gold
- doi.org
- Licence
- public-domain
- creativecommons.org/licenses/by/4.0/ (vor, 3987 d)
- Locations
- Environmental Health Perspectives (publishedVersion, public-domain)
- Europe PMC (PubMed Central) (publishedVersion, public-domain)
- PubMed Central (publishedVersion, public-domain)
- PubMed (publishedVersion)
- Funders
- U.S. Environmental Protection Agency
- National Institutes of Health (DK56350)
- National Institute of Diabetes and Digestive and Kidney Diseases (T32DK007686, 5 T32 DK07686, DK56350, P30DK056350)
- Topics
- Physical Sciences › Environmental Science › Environmental Chemistry › Arsenic contamination and mitigation
- Physical Sciences › Environmental Science › Health, Toxicology and Mutagenesis › Heavy Metal Exposure and Toxicity
- Life Sciences › Biochemistry, Genetics and Molecular Biology › Molecular Biology › Metabolism, Diabetes, and Cancer
- Keywords
- inorganic arsenic, arsenite, diabetogenic effect, insulin signaling, insulin-stimulated glucose uptake, adipocytes, 3T3-L1 cells, Akt/protein kinase B, PDK1, phosphatidylinositol 3-kinase, PTEN, phosphatidylinositol 3,4,5-trisphosphate, chronic arsenic exposure, diabetes mellitus, arsenic metabolites
- MeSH terms
- Animals, Arsenicals, Diabetes Mellitus, Glucose, Insulin, Microscopy, Fluorescence, Phosphorylation, Immunoblotting, Signal Transduction, 3T3 Cells, Protein Serine-Threonine Kinases, Adipocytes, Arsenites, Phosphatidylinositol 3-Kinases, Proto-Oncogene Proteins c-akt, PTEN Phosphohydrolase, Glucose Transporter Type 4, Mice, 3-Phosphoinositide-Dependent Protein Kinases
About these checks
Registry, retraction, Cites and statistics results are computed, not judged, with one exception: a printed reference that no index lists is read once by a model before it counts as a citation error. Claims are extracted by a model and kept only when their quote appears verbatim in the text; each cited source is then checked, with a model’s help, for whether it says what the claim relies on. Those verdicts can be wrong — read the claim’s quote and the cited source before relying on one.
Statistics and arithmetic are recomputed, not judged.
Confidence bands are shown only for fields calibrated on our annotated test set. None is calibrated yet, so no band is shown.
What counts as a claim ›How we measure confidence ›How we check this ›
Are you an author, or do you see a problem with this page? Request a review
