

Spatial Pattern Enhances Ecosystem Functioning in an African Savanna
Open accessThe DOI matches its Crossref record; 53 of the 53 references it cites were found in a registry or an index; none of the 22 sources its claims cite is checked for support yet.
Abstract
Termites indirectly enhance plant and animal productivity near their mounds, and the uniform spatial patterning of these mounds enhances the overall productivity of the entire landscape.
Overview
CoChat Summary
TL;DR
Termite mounds in an African savanna are evenly spaced, and this spatial pattern creates parallel patterning in tree-dwelling arthropods and geckos, increasing landscape-level productivity. The authors combine field surveys, experiments, and null-model simulations to argue that uniform mound spacing enhances ecosystem functioning across trophic levels.
Key findings
- Termite mounds were significantly over-dispersed at spatial scales <100 m, based on Ripley’s K analysis of mapped mounds.
- Aerial arthropods were more abundant at 10 m than 30 m from mounds, and trap sides facing mounds captured nearly 40% more arthropods than away-facing sides. Arboreal arthropod abundance and biomass, especially predatory taxa, decreased with distance from mound centers.
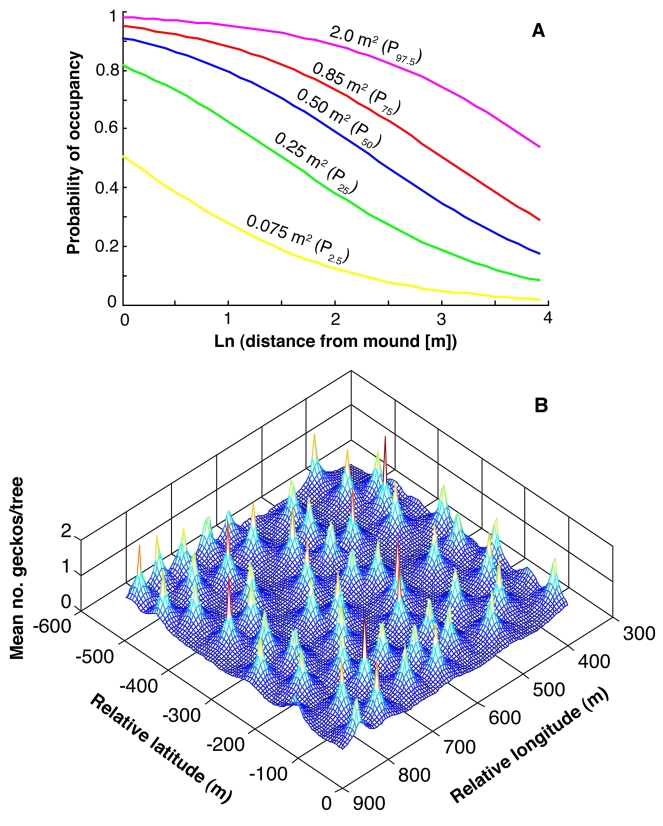
- Geckos were more likely to occupy trees closer to mounds: occupied trees had median distance 18.3 m (IQR 12.6–26.3) versus 26.4 m (IQR 15.4–31.4) for unoccupied trees (Wilcoxon Z = −3.6, p = 0.0003). Experimental prey supplementation nearly equalized gecko occupation at 10 m (0.799±0.064 geckos/post) and 30 m (0.771±0.046 geckos/post).
- Spider fecundity decreased with distance from mounds, and landscape simulations showed that the real over-dispersed mound landscape produced mean values for all response variables above the >99.9th percentile of 1,000 simulated random-mound landscapes.
Methods
- Fieldwork was conducted from June 2006 to August 2009 at Mpala Research Centre in central Kenya, in a wooded grassland on vertisol soils dominated by Acacia drepanolobium.
- The authors mapped termite mounds using Quickbird satellite imagery and Ripley’s K; sampled aerial arthropods with sticky traps and arboreal arthropods by insecticide spraying; surveyed geckos on 180 trees in 2006 and 477 trees in 2009; and reared egg masses from 110 female Cyclosa spiders.
- They used AICc-ranked regression models, ordinal logistic regression, repeated-measures MANOVA, and a null-model approach comparing the real over-dispersed mound landscape with 1,000 simulated random-mound landscapes.
Limitations
- The paper states that a direct field test of landscape-scale effects was not feasible because there were no control regions without patterned mounds and because eliminating termites would not remove mound structures for decades.
- The null-model simulations assume that multiple mounds do not have additive effects; the authors tested this by adding second-nearest mound distance, which did not improve the gecko model. They also assume trees are equally likely anywhere, but report that tree-density effects were weak and inconsistent, and weighted simulations gave qualitatively identical results.
- Evident from the text: several key results are observational or correlational, and the authors note that arthropod trophic categorization may miscategorize about 5% of insects; gecko reproductive output was difficult to measure because the species has a fixed clutch size.
Model-written summary. Check it against the paper before relying on it.
Integrity signals
Registry
Cites
Statistics
Figures



Verification
Claims the paper makes
0 Valid · 0 Not valid · 14 Not checked · 75 Own results and interpretations
A result the paper reports from its own data — it cites no other source for it, so there is none to check. The quote shows it is in the paper.
In the paper
“More than 96% (824 of 858) predatory arthropods in our samples were spiders, so our conclusions about predatory arthropods in general are also true for spiders in particular.”
§ Spatial Pattern Enhances Ecosystem Functioning in an African Savanna > Results/Discussion
plain- Asserted: passes — The authors put it forward as true.
- Checkable: passes — It can be checked against evidence.
- Load-bearing: passes — The paper’s conclusions depend on it.
- Based: passes — The paper gives a reason why it holds.
A result the paper reports from its own data — it cites no other source for it, so there is none to check. The quote shows it is in the paper.
In the paper
“Aerial arthropods (N = 3,277; 42% Hemiptera, 32% Diptera, 11% Coleoptera, 15% others) were significantly more abundant in sticky traps at 10 m than at 30 m from termite mounds (Figure 1B).”
§ Spatial Pattern Enhances Ecosystem Functioning in an African Savanna > Results/Discussion
plainstates an associationn = 3,277- Asserted: passes — The authors put it forward as true.
- Checkable: passes — It can be checked against evidence.
- Load-bearing: passes — The paper’s conclusions depend on it.
- Based: passes — The paper gives a reason why it holds.
A result the paper reports from its own data — it cites no other source for it, so there is none to check. The quote shows it is in the paper.
In the paper
“In fact, the response of tree density to mound proximity is weak and inconsistent, and a separate set of landscape simulations in which we accounted for these effects (see Materials and Methods) produced qualitatively identical results (Figure S5).”
§ Spatial Pattern Enhances Ecosystem Functioning in an African Savanna > Results/Discussion
plain- Asserted: passes — The authors put it forward as true.
- Checkable: passes — It can be checked against evidence.
- Load-bearing: passes — The paper’s conclusions depend on it.
- Based: passes — The paper gives a reason why it holds.
- Rests on an assumption not shown here.
A result the paper reports from its own data — it cites no other source for it, so there is none to check. The quote shows it is in the paper.
In the paper
“The log-transformed mound-proximity term was a better predictor of gecko abundance than the linear form.”
§ Spatial Pattern Enhances Ecosystem Functioning in an African Savanna > Materials and Methods > Regression Modeling of Response Variables
plainstates an association- Asserted: passes — The authors put it forward as true.
- Checkable: passes — It can be checked against evidence.
- Load-bearing: unclear — It is unclear whether the paper’s conclusions depend on it.
- Based: passes — The paper gives a reason why it holds.
In the paper
“Ranking these models using the sample-size-corrected Akaike Information Criterion (AICc) [29] revealed that the number of geckos on a tree was principally a function of the tree's size (estimated surface area of the main stem) and its proximity to the nearest termite mound (Table S1).”
§ Spatial Pattern Enhances Ecosystem Functioning in an African Savanna > Results/Discussion
What the sources say
- Not checked — no full text of the sourcecites [29] K. P Burnham, 2002, Model selection and multimodel inference: a practical information-theoretic approach. source
plainstates an associationn = 180- Asserted: passes — The authors put it forward as true.
- Checkable: passes — It can be checked against evidence.
- Load-bearing: passes — The paper’s conclusions depend on it.
- Based: passes — The paper gives a reason why it holds.
53 more claims
Create a free account to see all 89 claims and every source verdict.
- Probably not a substantial claim. 22
- The quote only partly states this claim. 1
- It may state two separate claims as one. 12
Statistics recomputed
Every reported test result, recomputed from its test statistic and degrees of freedom. A result shows as not adding up only once an independent check has confirmed it.
- Consistentz = -3.6reported p = .0003 · recomputed p < .001
“Z = −3.6, p = .0003”
Self-check
Percentages, sums and reported differences re-computed from the paper’s own numbers.
Each contradiction between two passages listed here was confirmed by an independent check.
Rated minor: it would not touch a result — a value no result rests on, a p-value that stays on the same side of the significance level, or a conflict that is clerical, resolved elsewhere in the paper, or outside its own findings.
In the paper
§ Spatial Pattern Enhances Ecosystem Functioning in an African Savanna > Materials and Methods > Gecko Surveys
“From July–August 2007, Pringle and two assistants exhaustively searched all trees for geckos”
§ Spatial Pattern Enhances Ecosystem Functioning in an African Savanna > Materials and Methods > Regression Modeling of Response Variables
“the original 180-tree dataset from 2006”
Citations
Cites
Model selection and multimodel inference: a practical information-theoretic approach.
Guthery, F. S., Burnham, K. P., & Anderson, D. R. (2003) · The Journal of Wildlife Management · doi:10.2307/3802723 · Cited by 41,495 · cited 2×
“Our notation and interpretation follow Burnham and Anderson [29].”
MethodSpatial Tessellations: Concepts and Applications of Voronoi Diagrams
Okabe, A., Boots, B. N., & Sugihara, K. (1992) · Cited by 3,546
Model selection and multimodel inference : a practical information-theoretic approach
Burnham, K. P., Anderson, D. R., & Burnham, K. P. (2002) · Thammasat University Digital Collections · Cited by 2,907
Ripley, B. D. (1977) · Journal of the Royal Statistical Society Series B: Statistical Methodology · doi:10.1111/j.2517-6161.1977.tb01615.x · Cited by 2,511 · cited 2×
“We quantitatively evaluated mound patterning at different spatial scales using Ripley’s K function [28].”
MethodSelf-Organized Patchiness and Catastrophic Shifts in Ecosystems
Rietkerk, M., Dekker, S. C., de Ruiter, P. C., & van de Koppel, J. (2004) · Science · doi:10.1126/science.1101867 · Cited by 1,413 · cited 1×
“range of ecosystems [7–10].”
Rings, circles and null models for point pattern analysis in ecology.
Wiegand, T., & A. Moloney, K. (2004) · Oikos · doi:10.1111/j.0030-1299.2004.12497.x · Cited by 1,157 · cited 2×
“coordinates of these mounds using Programita [40], establishing that the spacing of mounds is significantly uniform at spatial scales,100 m (Figure S2).”
MethodRegular and Irregular Patterns in Semiarid Vegetation
Klausmeier, C. A. (1999) · Science · doi:10.1126/science.284.5421.1826 · Cited by 993 · cited 1×
“Over the past decade, however, multiple studies have shown that regular patterns are both common and persistent across a range of ecosystems”
BackgroundRegular pattern formation in real ecosystems
Rietkerk, M., & van de Koppel, J. (2008) · Trends in Ecology & Evolution · doi:10.1016/j.tree.2007.10.013 · Cited by 894 · cited 1×
“unanswered [11].”
Spatial structure and chaos in insect population dynamics
Hassell, M. P., Comins, H. N., & Mayt, R. M. (1991) · Nature · doi:10.1038/353255a0 · Cited by 854 · cited 1×
“alone [1–3], with potentially profound implications for the maintenance of biodiversity and ecological stability [4,5].”
Background
Cited by
Desmond, M. (2014) · Theory and Society · doi:10.1007/s11186-014-9232-5 · Cited by 543
“…be explained by reference only to the large animals themselves; rather, the entire ecology of the savanna—the relations between large and small animals, between predator and prey, the availability and geography of insects, grassland, and water—must be taken into account (Pringle et al. 2010).”
BackgroundInfluence of termites on ecosystem functioning. Ecosystem services provided by termites
Jouquet, P., Traoré, S., Choosai, C., Hartmann, C., & Bignell, D. (2011) · European Journal of Soil Biology · doi:10.1016/j.ejsobi.2011.05.005 · Cited by 493
“tation and vegetation cover regeneration has been strikingly demonstrated in Africa and Asia [93,94,106,108].”
BackgroundInfluentialResearch trends in ecosystem services provided by insects
Noriega, J. A., Hortal, J., Azcárate, F. M., Berg, M. P., Bonada, N., Briones, M. J. I., Del Toro, I., Goulson, D., Ibanez, S., Landis, D. A., et al. (2018) · Basic and Applied Ecology · doi:10.1016/j.baae.2017.09.006 · Cited by 403
“This contrasts with the research on many ES of less obvious and/or indirect economic importance, such as dung removal, seed dispersal, soil aeration, pest control or soil water infiltration.”
Biogeography of global drylands
Maestre, F. T., Benito, B. M., Berdugo, M., Concostrina‐Zubiri, L., Delgado‐Baquerizo, M., Eldridge, D. J., Guirado, E., Gross, N., Kéfi, S., Le Bagousse‐Pinguet, Y., et al. (2021) · New Phytologist · doi:10.1111/nph.17395 · Cited by 394
Termite mounds can increase the robustness of dryland ecosystems to climatic change
Bonachela, J. A., Pringle, R. M., Sheffer, E., Coverdale, T. C., Guyton, J. A., Caylor, K. K., Levin, S. A., & Tarnita, C. E. (2015) · Science · doi:10.1126/science.1261487 · Cited by 268
Self-citationMaestre, F. T., Castillo‐Monroy, A. P., Bowker, M. A., & Ochoa‐Hueso, R. (2012) · Journal of Ecology · doi:10.1111/j.1365-2745.2011.01918.x · Cited by 261
Ants and termites increase crop yield in a dry climate
Evans, T. A., Dawes, T. Z., Ward, P. R., & Lo, N. (2011) · Nature Communications · doi:10.1038/ncomms1257 · Cited by 253
A theoretical foundation for multi-scale regular vegetation patterns
Tarnita, C. E., Bonachela, J. A., Sheffer, E., Guyton, J. A., Coverdale, T. C., Long, R. A., & Pringle, R. M. (2017) · Nature · doi:10.1038/nature20801 · Cited by 204
Self-citationPattern formation at multiple spatial scales drives the resilience of mussel bed ecosystems
Liu, Q.-X., Herman, P. M. J., Mooij, W. M., Huisman, J., Scheffer, M., Olff, H., & van de Koppel, J. (2014) · Nature Communications · doi:10.1038/ncomms6234 · Cited by 202
Uncovering Ecological Patterns with Convolutional Neural Networks
Brodrick, P. G., Davies, A. B., & Asner, G. P. (2019) · Trends in Ecology & Evolution · doi:10.1016/j.tree.2019.03.006 · Cited by 168
“Both high-resolution satellite and LiDAR data have been used to map termite mounds and reveal the importance of their spatial patterning across landscapes [79 – 82], but identifying individual mounds has remained a laborious and manual task, limiting the extent of possible analysis.”
MethodInteractions Among Ecosystem Services Across Land Uses in a Floodplain Agroecosystem
Felipe-Lucia, M. R., Comín, F. A., & Bennett, E. M. (2014) · Ecology and Society · doi:10.5751/es-06249-190120 · Cited by 158
Termites: The Neglected Soil Engineers of Tropical Soils
Jouquet, P., Bottinelli, N., Shanbhag, R. R., Bourguignon, T., Traoré, S., & Abbasi, S. A. (2016) · Soil Science · doi:10.1097/ss.0000000000000119 · Cited by 158
Edge‐Effect Interactions in Fragmented and Patchy Landscapes
Porensky, L. M., & Young, T. P. (2013) · Conservation Biology · doi:10.1111/cobi.12042 · Cited by 132
Sun, G., Wang, S.-L., Ren, Q., Jin, Z., & Wu, Y.-P. (2015) · Scientific Reports · doi:10.1038/srep11246 · Cited by 131
Predicting tropical insect herbivore abundance from host plant traits and phylogeny
Whitfeld, T. J. S., Novotný, V., Miller, S. E., Hrček, J., Klimeš, P., & Weiblen, G. D. (2012) · Ecology · doi:10.1890/11-0503.1 · Cited by 124
Spatial variability and abiotic determinants of termite mounds throughout a savanna catchment
Davies, A. B., Levick, S. R., Asner, G. P., Robertson, M. P., van Rensburg, B. J., & Parr, C. L. (2014) · Ecography · doi:10.1111/ecog.00532 · Cited by 126
Impacts of climate change on vegetation pattern: Mathematical modeling and data analysis
Sun, G., Li, L., Li, J., Liu, C., Wu, Y.-P., Gao, S., Wang, Z., & Feng, G. (2022) · Physics of Life Reviews · doi:10.1016/j.plrev.2022.09.005 · Cited by 117
Deterministic selection dominates microbial community assembly in termite mounds
Chen, Q., Hu, H., Yan, Z., Li, C., Nguyen, B. T., Sun, A., Zhu, Y., & He, J. (2020) · Soil Biology and Biochemistry · doi:10.1016/j.soilbio.2020.108073 · Cited by 110
Ecological correlates of the spatial co‐occurrence of sympatric mammalian carnivores worldwide
Davis, C. L., Rich, L. N., Farris, Z. J., Kelly, M. J., Bitetti, M. S. D., Blanco, Y. D., Albanesi, S. A., Farhadinia, M. S., Gholikhani, N., Hamel, S., et al. (2018) · Ecology Letters · doi:10.1111/ele.13124 · Cited by 122
Seymour, C. L., Milewski, A. V., Mills, A., Joseph, G. S., Cumming, G. S., Cumming, D. H. M., & Mahlangu, Z. (2013) · Soil Biology and Biochemistry · doi:10.1016/j.soilbio.2013.09.022 · Cited by 108
Pringle, R. M., & Tarnita, C. E. (2017) · Annual Review of Entomology · doi:10.1146/annurev-ento-031616-035413 · Cited by 110
Self-citationDealing with under‐ and over‐dispersed count data in life history, spatial, and community ecology
Lynch, H. J., Thorson, J. T., & Shelton, A. O. (2014) · Ecology · doi:10.1890/13-1912.1 · Cited by 99
Alternative mechanisms alter the emergent properties of self-organization in mussel beds
Liu, Q., Weerman, E. J., Herman, P. M. J., Olff, H., & van de Koppel, J. (2012) · Proceedings of the Royal Society B Biological Sciences · doi:10.1098/rspb.2012.0157 · Cited by 84
Roberts, E. M., Todd, C. N., Aanen, D. K., et al. (2016) · PLoS ONE · doi:10.1371/journal.pone.0156847 · Cited by 80
Behavioral self-organization underlies the resilience of a coastal ecosystem
de Paoli, H., van der Heide, T., van den Berg, A., Silliman, B. R., Herman, P. M. J., & van de Koppel, J. (2017) · Proceedings of the National Academy of Sciences · doi:10.1073/pnas.1619203114 · Cited by 84
Termite Mounds Increase Functional Diversity of Woody Plants in African Savannas
Joseph, G. S., Seymour, C. L., Cumming, G. S., Cumming, D. H. M., & Mahlangu, Z. (2014) · Ecosystems · doi:10.1007/s10021-014-9761-9 · Cited by 82
Termite mounds as islands: woody plant assemblages relative to termitarium size and soil properties
Joseph, G. S., Seymour, C. L., Cumming, G. S., Cumming, D. H. M., & Mahlangu, Z. (2012) · Journal of Vegetation Science · doi:10.1111/j.1654-1103.2012.01489.x · Cited by 79
Phase separation driven by density-dependent movement: A novel mechanism for ecological patterns
Liu, Q., Rietkerk, M., Herman, P. M. J., Piersma, T., Fryxell, J. M., & van de Koppel, J. (2016) · Physics of Life Reviews · doi:10.1016/j.plrev.2016.07.009 · Cited by 81
“Self-organized spatial 32 patterns are considered key to understanding ecological stability [10], diversity [1] and 33 ecosystems functioning [7, 9, 11-14].”
Ecosystem multifunctionality increases with beta diversity in restored prairies
Grman, E., Zirbel, C. R., Bassett, T. J., & Brudvig, L. A. (2018) · Oecologia · doi:10.1007/s00442-018-4248-6 · Cited by 72
Okullo, P., & Moe, S. R. (2011) · Journal of Ecology · doi:10.1111/j.1365-2745.2011.01889.x · Cited by 73
Termite mounds alter the spatial distribution of African savanna tree species
Davies, A. B., Baldeck, C. A., & Asner, G. P. (2015) · Journal of Biogeography · doi:10.1111/jbi.12633 · Cited by 73
Ecosystem Engineering by Seagrasses Interacts with Grazing to Shape an Intertidal Landscape
van der Heide, T., Eklöf, J., van Nes, E. H., van der Zee, E. M., Donadi, S., Weerman, E. J., Olff, H., & Eriksson, B. K. (2012) · PLoS ONE · doi:10.1371/journal.pone.0042060 · Cited by 80
The hidden order of Turing patterns in arid and semi‐arid vegetation ecosystems
Ge, Z. (2023) · Proceedings of the National Academy of Sciences · doi:10.1073/pnas.2306514120 · Cited by 85
“Through scale - dependent feedback, termite mounds in semi - arid regions form hyperuniform structures called hyperdispersed or overdispersion configurations (24, 25, 59).”
BackgroundAutomatic Counting of Large Mammals from Very High Resolution Panchromatic Satellite Imagery
Xue, Y., Wang, T., & Skidmore, A. K. (2017) · Remote Sensing · doi:10.3390/rs9090878 · Cited by 64
Computational pathology: Exploring the spatial dimension of tumor ecology
Nawaz, S., & Yuan, Y. (2016) · Cancer Letters · doi:10.1016/j.canlet.2015.11.018 · Cited by 59
“In ecology, spatial analyses of predator–prey relations have been used to shed new light on predatory behavior [63,64].”
Experimental landscape ecology
Jenerette, G. D., & Shen, W. (2012) · Landscape Ecology · doi:10.1007/s10980-012-9797-1 · Cited by 64
Bieng, M. A. N., Gidoin, C., Avelino, J., Cilas, C., Deheuvels, O., & Wéry, J. (2013) · Basic and Applied Ecology · doi:10.1016/j.baae.2013.03.003 · Cited by 59
Sustainable use of termite activity in agro-ecosystems with reference to earthworms. A review
Jouquet, P., Chaudhary, E., & Kumar, A. R. V. (2017) · Agronomy for Sustainable Development · doi:10.1007/s13593-017-0483-1 · Cited by 68
Zhao, L., Xu, C., Ge, Z., van de Koppel, J., & Liu, Q. (2019) · Proceedings of the Royal Society B Biological Sciences · doi:10.1098/rspb.2018.2859 · Cited by 60
Vegetation controls on channel network complexity in coastal wetlands
van de Vijsel, R. C., van Belzen, J., Bouma, T. J., van der Wal, D., Borsje, B. W., Temmerman, S., Cornacchia, L., Gourgue, O., & van de Koppel, J. (2023) · Nature Communications · doi:10.1038/s41467-023-42731-3 · Cited by 57
Synergistic effects of fire and elephants on arboreal animals in an A frican savanna
Pringle, R. M., Kimuyu, D. M., Sensenig, R. L., Palmer, T. M., Riginos, C., Veblen, K. E., & Young, T. P. (2015) · Journal of Animal Ecology · doi:10.1111/1365-2656.12404 · Cited by 69
“The factors driving gecko habitat selection at the scale of individual trees within burned patches (Table 2) were consistent with those from previous studies in unburned areas (Pringle 2008; Pringle et al. 2010; Donihue et al. 2013), suggesting that gecko microhabitat selection is independent of recent fire history.”
BackgroundResultInfluentialSelf-citationIbáñez, J. J., Krasilnikov, P. V., & Saldaña, A. (2012) · Journal of Applied Ecology · doi:10.1111/j.1365-2664.2012.02213.x · Cited by 52
Escaping the flames: large termitaria as refugia from fire in miombo woodland
Joseph, G. S., Seymour, C. L., Cumming, G. S., Mahlangu, Z., & Cumming, D. H. M. (2013) · Landscape Ecology · doi:10.1007/s10980-013-9897-6 · Cited by 50
“…et al. 2010), provide habitat structure and nesting sites for cavity-using birds (Joseph et al. 2011), important forage for herbivores (Loveridge and Moe 2004; Brody et al. 2010; Levick et al. 2010), and also increase primary, secondary and tertiary productivity of systems (Pringle et al. 2010).”
BackgroundInfluentialBifurcation analysis of an extended Klausmeier–Gray–Scott model with infiltration delay
Li, J., Sun, G., & Guo, Z. (2022) · Studies in Applied Mathematics · doi:10.1111/sapm.12482 · Cited by 45
Erpenbach, A., Bernhardt‐Römermann, M., Wittig, R., et al. (2012) · Journal of Tropical Ecology · doi:10.1017/s0266467412000703 · Cited by 45
Fifty years of ‘More is different’
Strogatz, S. H., Walker, S. I., Yeomans, J. M., Tarnita, C. E., Arcaute, E., Domenico, M. D., Artime, O., & Goh, K.-I. (2022) · Nature Reviews Physics · doi:10.1038/s42254-022-00483-x · Cited by 55
Uncovering cryptic species diversity of a termite community in a West African savanna
Hausberger, B., Kimpel, D., van Neer, A., & Korb, J. (2011) · Molecular Phylogenetics and Evolution · doi:10.1016/j.ympev.2011.08.015 · Cited by 42
Local properties of patterned vegetation: quantifying endogenous and exogenous effects
Penny, G., Daniels, K. E., & Thompson, S. (2013) · Philosophical Transactions of the Royal Society A Mathematical Physical and Engineering Sciences · doi:10.1098/rsta.2012.0359 · Cited by 40
“…where it has been linked to reaction-diffusion (Turing) type instabilities (Rietkerk et al., 2002), hydrodynamic instabilities (Thompson & Daniels, 2010), and potential (variational) dynamics that maximize or at least increase ecological productivity5 (Lefever et al., 2009; Pringle et al., 2010).”
BackgroundA global review of termite sampling methods
Davies, A. B., Parr, C. L., & Eggleton, P. (2021) · Insectes Sociaux · doi:10.1007/s00040-020-00797-y · Cited by 44
Spatial patterns in ecological systems: from microbial colonies to landscapes
Martínez‐García, R., Tarnita, C. E., & Bonachela, J. A. (2022) · Emerging Topics in Life Sciences · doi:10.1042/etls20210282 · Cited by 39
Herbivory by subterranean termite colonies and the development of fairy circles in SW N amibia
VLIEGHE, K., Picker, M. D., Ross‐Gillespie, V., & Erni, B. (2014) · Ecological Entomology · doi:10.1111/een.12157 · Cited by 37
Kelly, M., Blanchard, S. D., Kersten, E. E., & Koy, K. (2011) · Remote Sensing · doi:10.3390/rs3112321 · Cited by 37
Termite mounds may not be foraging hotspots for mega-herbivores in a nutrient-rich matrix
Muvengwi, J., Mbiba, M., & Nyenda, T. (2013) · Journal of Tropical Ecology · doi:10.1017/s0266467413000564 · Cited by 38
Microplastic leachates induce species‐specific trait strengthening in intertidal mussels
Seuront, L., Nicastro, K. R., McQuaid, C. D., & Zardi, G. I. (2020) · Ecological Applications · doi:10.1002/eap.2222 · Cited by 38
“…to move and aggregate, the trait reinforcement observed in the present work is likely to affect the formation and maintenance of spatial patterns in mussel beds, which are a key feature in the ability of mussels to withstand disturbances (Rietkerk and van de Koppel 2008, Pringle et al. 2010).”
BackgroundGlobal Relationships of Pedodiversity and Biodiversity
Ibáñez, J. J., & Feoli, E. (2013) · Vadose Zone Journal · doi:10.2136/vzj2012.0186 · Cited by 37
Fauna invertebrada e atributos físicos e químicos do solo em sistemas de integração lavoura-pecuária
Portilho, I. I. R., Crepaldi, R. A., Borges, C. D., et al. (2011) · Pesquisa Agropecuária Brasileira · doi:10.1590/s0100-204x2011001000027 · Cited by 35
Termite Taxonomy, Challenges and Prospects: West Africa, A Case Example
Korb, J., Kasseney, B. D., Cakpo, Y. T., et al. (2019) · Insects · doi:10.3390/insects10010032 · Cited by 35
Foraging behaviours lead to spatiotemporal self‐similar dynamics in grazing ecosystems
Ge, Z., & Liu, Q. (2021) · Ecology Letters · doi:10.1111/ele.13928 · Cited by 35
Franz, T. E., King, E. G., Caylor, K. K., & Robinson, D. A. (2011) · Water Resources Research · doi:10.1029/2010wr010127 · Cited by 36
Partitioning spatial, environmental, and community drivers of ecosystem functioning
Truchy, A., Göthe, E., Angeler, D. G., Ecke, F., Sponseller, R. A., Bundschuh, M., Johnson, R. K., & McKie, B. G. (2019) · Landscape Ecology · doi:10.1007/s10980-019-00894-9 · Cited by 36
Cumulative effects of an herbivorous ecosystem engineer in a heterogeneous landscape
Parsons, M. A., Barkley, T. C., Rachlow, J. L., Johnson-Maynard, J. L., Johnson, T. R., Milling, C. R., Hammel, J. E., & Leslie, I. N. (2016) · Ecosphere · doi:10.1002/ecs2.1334 · Cited by 35
Climatic variation modulates the indirect effects of large herbivores on small‐mammal habitat use
Long, R. A., Wambua, A., Goheen, J. R., Palmer, T. M., & Pringle, R. M. (2017) · Journal of Animal Ecology · doi:10.1111/1365-2656.12669 · Cited by 36
Self-citationThe global biogeography and environmental drivers of fairy circles
Guirado, E., Delgado‐Baquerizo, M., Benito, B. M., Molina-Pardo, J. L., Berdugo, M., Martínez‐Valderrama, J., & Maestre, F. T. (2023) · Proceedings of the National Academy of Sciences · doi:10.1073/pnas.2304032120 · Cited by 33
“The consequences of FCs for ecosystem functioning and stability also remain largely unexplored despite the known positive influence of regular vegetation patterns on key ecosystem properties such as vegetation productivity (26).”
Where do South-Indian termite mound soils come from?
Jouquet, P., Caner, L., Bottinelli, N., Chaudhary, E., Cheik, S., & Riotte, J. (2017) · Applied Soil Ecology · doi:10.1016/j.apsoil.2017.05.010 · Cited by 32
Termites facilitate and ungulates limit savanna tree regeneration
Støen, O., Okullo, P., Eid, T., & Moe, S. R. (2012) · Oecologia · doi:10.1007/s00442-012-2561-z · Cited by 34
Spatial patterning of soil microbial communities created by fungus‐farming termites
Baker, C. C. M., Vardaro, J. A. C., Doak, D. F., Pansu, J., Puissant, J., Pringle, R. M., & Tarnita, C. E. (2020) · Molecular Ecology · doi:10.1111/mec.15585 · Cited by 27
Self-citationDonihue, C. M., Porensky, L. M., Foufopoulos, J. B., Riginos, C., & Pringle, R. M. (2012) · Ecology · doi:10.1890/12-0856.1 · Cited by 32
Self-citationJouquet, P., Airola, E., Guilleux, N., Harit, A. K., Chaudhary, E., Grellier, S., & Riotte, J. (2016) · Ecosystems · doi:10.1007/s10021-016-0060-5 · Cited by 30
Zhou, Y., Boutton, T. W., Wu, X. B., & Yang, C. (2017) · Landscape Ecology · doi:10.1007/s10980-017-0496-9 · Cited by 31
Large herbivores maintain termite‐caused differences in herbaceous species diversity patterns
Okullo, P., & Moe, S. R. (2012) · Ecology · doi:10.1890/11-2011.1 · Cited by 30
Antwi, M., Duker, A. A., Fosu, M., & Abaidoo, R. C. (2016) · Cogent Geoscience · doi:10.1080/23312041.2016.1201906 · Cited by 30
Shipley, O. N., Gallagher, A., Shiffman, D., Kaufman, L., & Hammerschlag, N. (2019) · Marine Ecology Progress Series · doi:10.3354/meps12982 · Cited by 27
Termite Communities along A Disturbance Gradient in a West African Savanna
Schyra, J., & Korb, J. (2019) · Insects · doi:10.3390/insects10010017 · Cited by 28
Allometry of behavior and niche differentiation among congeneric African antelopes
Daskin, J. H., Becker, J. A., Kartzinel, T. R., Potter, A. B., Walker, R. H., Eriksson, F. A. A., Buoncore, C., Getraer, A., Long, R. A., & Pringle, R. M. (2022) · Ecological Monographs · doi:10.1002/ecm.1549 · Cited by 29
Self-citationO'Connor, D. A., Butt, B., & Foufopoulos, J. B. (2015) · African Journal of Ecology · doi:10.1111/aje.12204 · Cited by 28
Ecology of Floodplain Campos de Murundus Savanna in Southern Amazonia
Marimon, B. S., Colli, G. R., Marimon-Junior, B. H., Mews, H. A., Eisenlohr, P. V., Feldpausch, T. R., & Phillips, O. L. (2015) · International Journal of Plant Sciences · doi:10.1086/682079 · Cited by 27
Termite cohabitation: the relative effect of biotic and abiotic factors on mound biodiversity
Marins, A., Costa, D. A., Russo, L., Campbell, C., DeSouza, O., Bjørnstad, O. N., & Shea, K. (2016) · Ecological Entomology · doi:10.1111/een.12323 · Cited by 28
McAuliffe, J. R., Hoffman, M. T., McFadden, L. D., et al. (2018) · Journal of Arid Environments · doi:10.1016/j.jaridenv.2018.11.010 · Cited by 27
DiFiore, B. P., Queenborough, S., Madin, E., Paul, V. J., Decker, M., & Stier, A. C. (2019) · Marine Ecology Progress Series · doi:10.3354/meps13074 · Cited by 34
Resistance of mound-building termites to anthropogenic land-use change
Davies, A. B., Brodrick, P. G., Parr, C. L., & Asner, G. P. (2020) · Environmental Research Letters · doi:10.1088/1748-9326/aba0ff · Cited by 30
Six, D. L., Poulsen, M., Hansen, A. K., Wingfield, M. J., Roux, J., Eggleton, P., Slippers, B., & Paine, T. D. (2011) · Symbiosis · doi:10.1007/s13199-011-0119-1 · Cited by 30
“Termites, their fungi, and their mounds, also provide shelter and food for many organisms occurring within and around their mounds (Sileshi et al. 2009; Pringle et al. 2010).”
BackgroundHabitat-specific AMF symbioses enhance drought tolerance of a native Kenyan grass
Petipas, R. H., González, J. B., Palmer, T. M., & Brody, A. K. (2017) · Acta Oecologica · doi:10.1016/j.actao.2016.12.005 · Cited by 27
Self-citationThe Impact of Anthropogenic Disturbance on Assembly Patterns of Termite Communities
Hausberger, B., & Korb, J. (2016) · Biotropica · doi:10.1111/btp.12278 · Cited by 25
Impacts of fungus-growing termites on surficial geology parameters: A review
Thuyne, J. V., & Verrecchia, É. P. (2021) · Earth-Science Reviews · doi:10.1016/j.earscirev.2021.103862 · Cited by 27
Biophysical effects on soil crack morphology in a faunally active dryland vertisol
DeCarlo, K. F., & Caylor, K. K. (2018) · Geoderma · doi:10.1016/j.geoderma.2018.07.042 · Cited by 25
Bioengineering promotes habitat heterogeneity and biodiversity on mussel reefs
Ouderaa, I. V. D., Claassen, J. R., van de Koppel, J., Bishop, M. J., & Eriksson, B. K. (2021) · Journal of Experimental Marine Biology and Ecology · doi:10.1016/j.jembe.2021.151561 · Cited by 26
Joseph, G., Makumbe, M. T., Seymour, C., Cumming, G., Mahlangu, Z., & Cumming, D. (2015) · Landscape Ecology · doi:10.1007/s10980-015-0238-9 · Cited by 25
Castillo‐Monroy, A. P., Bowker, M. A., García‐Palacios, P., et al. (2014) · Plant and Soil · doi:10.1007/s11104-014-2256-9 · Cited by 23
Elephants, termites and mound thermoregulation in a progressively warmer world
Joseph, G. S., Seymour, C. L., Coetzee, B. W. T., et al. (2018) · Landscape Ecology · doi:10.1007/s10980-018-0629-9 · Cited by 23
Geology drives the spatial patterning and structure of termite mounds in an African savanna
Muvengwi, J., Davies, A. B., Parrini, F., & Witkowski, E. T. F. (2018) · Ecosphere · doi:10.1002/ecs2.2148 · Cited by 26
Termites Assemblages in Oil Palm Plantation in Sarawak, Malaysia
Bong, J. C. F., King, P. J. H., Ong, K. H., et al. (2011) · Journal of Entomology · doi:10.3923/je.2012.68.78 · Cited by 22
Dibner, R. R., Doak, D. F., & Lombardi, E. M. (2015) · Ecosphere · doi:10.1890/es14-00415.1 · Cited by 22
Self-citationErpenbach, A., Bernhardt‐Römermann, M., Wittig, R., & Hahn, K. (2016) · Journal of Vegetation Science · doi:10.1111/jvs.12463 · Cited by 23
Sileshi, G. W., & Arshad, M. A. (2011) · Journal of Arid Environments · doi:10.1016/j.jaridenv.2011.09.008 · Cited by 22
Termite mounds reduce soil microbial diversity by filtering rare microbial taxa
Chen, Q., Hu, H., Yan, Z., et al. (2021) · Environmental Microbiology · doi:10.1111/1462-2920.15507 · Cited by 21
Animal effects on dissolved organic carbon bioavailability in an algal controlled ecosystem
Parr, T. B., Vaughn, C. C., & Gido, K. B. (2019) · Freshwater Biology · doi:10.1111/fwb.13438 · Cited by 21
Wang, Y., Yu, Q., Avirmed, B., Zhao, J., Sun, W., Liu, Y., Cui, H., Khishigjargal, M., Sharavjamts, O., Naranbat, D., et al. (2025) · Ecological Indicators · doi:10.1016/j.ecolind.2025.113300 · Cited by 23
Buitenwerf, R., Stevens, N., Gosling, C. M., Anderson, T. M., & Olff, H. (2011) · Journal of Tropical Ecology · doi:10.1017/s0266467411000125 · Cited by 19
Coetsee, C., Jacobs, S. M., & Govender, N. (2011) · Environmental Management · doi:10.1007/s00267-011-9779-0 · Cited by 23
Cascading effects of termite mounds in African savannas
Muvengwi, J., & Witkowski, E. T. F. (2020) · New Zealand Journal of Botany · doi:10.1080/0028825x.2020.1767162 · Cited by 21
Metadata
- Authors
- Pringle, R. M., Doak, D. F., Brody, A. K., Jocqué, R., & Palmer, T. M.
- Affiliations
- Harvard University (US)
- University of Wyoming (US)
- University of Vermont (US)
- Royal Museum for Central Africa (BE)
- University of Florida (US)
- Corresponding author
- Pringle, Robert M.
- Venue
- PLoS Biology
- Publisher
- Public Library of Science (PLoS)
- Published
- 2010-05-25
- Volume
- 8
- Issue
- 5
- Pages
- e1000377
- ISSN
- 1544-9173 (ISSN-L)
- 1545-7885
- PMC
- PMC2876046
- OpenAlex
- W2121038964
- Semantic Scholar
- 52d7a522cb3c373afffe5a4bf1c85114e6ca803c
- Cited by
- 245
- References
- 53
- Citations by year
- 2026: 8 · 2025: 11 · 2024: 10 · 2023: 10 · 2022: 16 · 2021: 17 · 2020: 21 · 2019: 19 · 2018: 17 · 2017: 20 · 2016: 24 · 2015: 12 · 2014: 13 · 2013: 14 · 2012: 15
- FWCI
- 8.44
- Type
- journal article
- Language
- en
- Open access
- gold
- doi.org
- Locations
- PLoS Biology (publishedVersion, cc-by)
- PubMed Central (publishedVersion, cc-by)
- PubMed (publishedVersion)
- Digital Access to Scholarship at Harvard (DASH) (Harvard University) (submittedVersion, cc-by)
- DOAJ (DOAJ: Directory of Open Access Journals) (submittedVersion)
- Figshare (submittedVersion, cc-by)
- Greater South Information System
- Funders
- National Science Foundation (0444071, 0709880, 0852961, 0519223)
- Government of the Republic of Kenya
- National Commission for Science and Technology
- Office of International Science and Engineering
- Topics
- Life Sciences › Agricultural and Biological Sciences › Insect Science › Insect and Arachnid Ecology and Behavior
- Physical Sciences › Environmental Science › Nature and Landscape Conservation › Ecology and Vegetation Dynamics Studies
- Physical Sciences › Environmental Science › Global and Planetary Change › Ecosystem dynamics and resilience
- Keywords
- spatial patterns, ecosystem functioning, termite mounds, savanna, primary productivity, secondary production, insect abundance, trophic levels, nearest neighbor distance, null models, arid ecosystems, habitat restoration, ecosystem services
- MeSH terms
- Acacia, Africa, Animals, Ants, Arthropods, Feeding Behavior, Poaceae, Insecta, Kenya, Lizards, Population Dynamics, Predatory Behavior, Spiders, Ecosystem, Isoptera
About these checks
Registry, retraction, Cites and statistics results are computed, not judged, with one exception: a printed reference that no index lists is read once by a model before it counts as a citation error. Claims are extracted by a model and kept only when their quote appears verbatim in the text; each cited source is then checked, with a model’s help, for whether it says what the claim relies on. Those verdicts can be wrong — read the claim’s quote and the cited source before relying on one.
A language model drew the claims from the paper on 2026-10-10, under version 3 of the claim definition (model deepseek-v4.1-flash, prompt extract-v3).
A second model labelled each claim on 2026-10-10 (model jev-1.13-20260917, definition revision gold-guideline-v0.2).
Statistics and arithmetic are recomputed, not judged.
Confidence bands are shown only for fields calibrated on our annotated test set. None is calibrated yet, so no band is shown.
What counts as a claim ›How we measure confidence ›How we check this ›
Are you an author, or do you see a problem with this page? Request a review
Data sources
Bibliographic data: Semantic Scholar, OpenAlex, Crossref.
Contains information from the Semantic Scholar Academic Graph Datasets, made available under the ODC Attribution License (ODC-BY 1.0).
Semantic Scholar’s data is described in: Kinney, R., et al. (2023). The Semantic Scholar Open Data Platform. arXiv:2301.10140.
