

The DOI matches its Crossref record; 2 of the 2 references it cites were found in a registry or an index.
The actin remodeling protein cofilin is crucial for thymic αβ but not γδ T-cell development
Overview
The claims and statistics of this paper haven’t been checked yet.
Run the check — free, no account needed. It reads the open-access text and checks the sources it cites.
Integrity signals
Registry
Cites
Statistics
Figures
Verification
Claims the paper makes
The claims and statistics of this paper haven’t been checked yet.
Run the check — free, no account needed. It reads the open-access text and checks the sources it cites.
Claims other papers make about this one
Each is checked against this paper’s own text: does it say what the citing paper says it does?
In the citing paper
“Several mutations affecting actin remodeling have been implicated in T-cell lymphopenia, including cofilin (Cfl1), 40 coronin 1a (CORO1A), 41 Dock8, 42 WASp (WAS), 43 and ARPC1B, 44 each affecting thymocyte development differently.”
From Dominant activating RAC2 mutation with lymphopenia, immunodeficiency, and cytoskeletal defects (2019) · cites this paper as [40]
In the citing paper
“Different mutations within Coro1a cause lymphopenia by different mechanisms; T cells from Ptcd mice have impaired thymic egress, whereas Koy mice, with unstable Coro1a protein, have reduced thymocyte survival.40”
From Dominant activating RAC2 mutation with lymphopenia, immunodeficiency, and cytoskeletal defects (2019) · cites this paper as [40]
In the citing paper
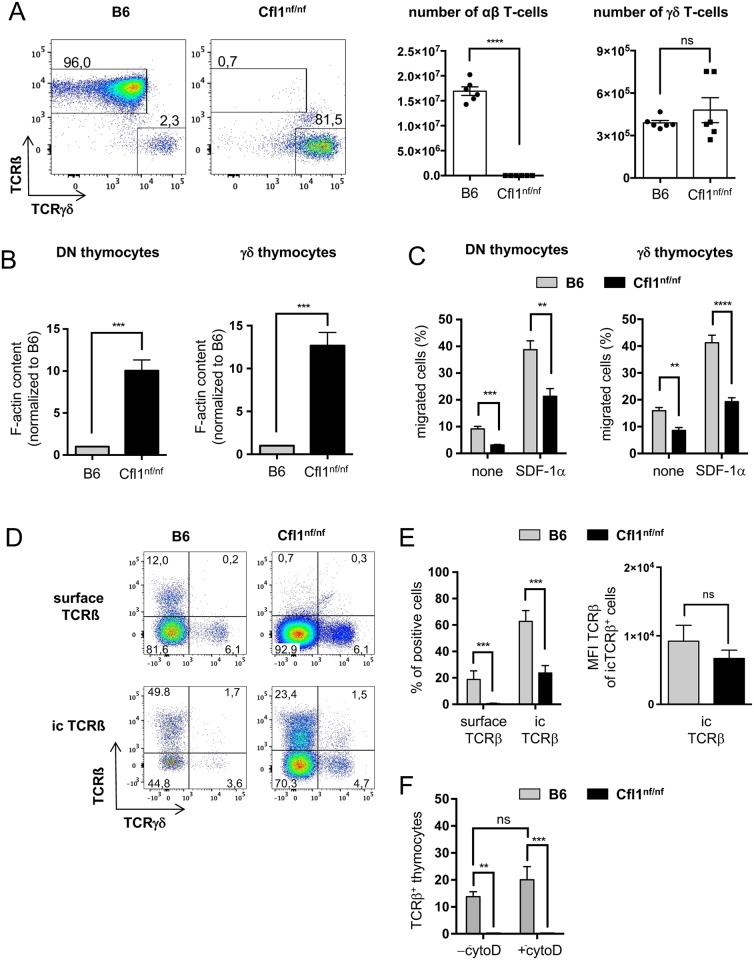
“Nonfunctional cofilin leads to a developmental arrest during DN2 to DN3 stage of thymocyte maturation resulting from failure of TCRb surface expression.40”
From Dominant activating RAC2 mutation with lymphopenia, immunodeficiency, and cytoskeletal defects (2019) · cites this paper as [40]
Self-check
Percentages, sums and reported differences re-computed from the paper’s own numbers.
The self-check needs the paper’s full text.
Citations
Cites
ADF/Cofilin: a functional node in cell biology
Bernstein, B. W., & Bamburg, J. R. (2010) · Trends in Cell Biology · doi:10.1016/j.tcb.2010.01.001 · Cited by 704
Signaling mechanisms and functional roles of cofilin phosphorylation and dephosphorylation
Mizuno, K. (2013) · Cellular Signalling · doi:10.1016/j.cellsig.2012.11.001 · Cited by 396
Research works printed but not linked: 58
- JK Burkhardt, 2008, The actin cytoskeleton in T cell activation, Annu Rev Immunol, 26, 233, 10.1146/annurev.immunol.26.021607.090347 · DOI
- KL Angus, 2013, Cell polarisation and the immunological synapse, Curr Opin Cell Biol, 25, 85, 10.1016/j.ceb.2012.08.013 · DOI
- I Piragyte, 2012, Actin engine in immunological synapse, Immune Netw, 12, 71, 10.4110/in.2012.12.3.71 · DOI
- Y Samstag, 2003, Actin cytoskeletal dynamics in T lymphocyte activation and migration, J Leukoc Biol, 73, 30, 10.1189/jlb.0602272 · DOI
- S Kumari, 2014, T cell antigen receptor activation and actin cytoskeleton remodeling, Biochim Biophys Acta, 1838, 546, 10.1016/j.bbamem.2013.05.004 · DOI
- MK Vartiainen, 2002, The three mouse actin-depolymerizing factor/cofilins evolved to fulfill cell-type-specific requirements for actin dynamics, Mol Biol Cell, 13, 183, 10.1091/mbc.01-07-0331 · DOI
- E Nishida, 1984, Cofilin, a protein in porcine brain that binds to actin filaments and inhibits their interactions with myosin and tropomyosin, Biochemistry, 23, 5307, 10.1021/bi00317a032 · DOI
- H Abe, 1989, A cofilin-like protein is involved in the regulation of actin assembly in developing skeletal muscle, J Biochem, 106, 696, 10.1093/oxfordjournals.jbchem.a122919 · DOI
- K Moriyama, 1990, Destrin, a mammalian actin-depolymerizing protein, is closely related to cofilin. Cloning and expression of porcine brain destrin cDNA, J Biol Chem, 265, 5768, 10.1016/S0021-9258(19)39429-3 · DOI
- Y Samstag, 1994, Costimulatory signals for human T-cell activation induce nuclear translocation of pp19/cofilin, Proc Natl Acad Sci U S A, 91, 4494, 10.1073/pnas.91.10.4494 · DOI
- J Condeelis, 2001, How is actin polymerization nucleated in vivo?, Trends Cell Biol, 11, 288, 10.1016/S0962-8924(01)02008-6 · DOI · Paper page
- Y Samstag, 1991, A serine phosphatase is involved in CD2-mediated activation of human T lymphocytes and natural killer cells, J Immunol, 147, 788, 10.4049/jimmunol.147.3.788 · DOI
- Y Samstag, 1992, Dephosphorylation of pp19: a common second signal for human T cell activation mediated through different accessory molecules, Int Immunol, 4, 1255, 10.1093/intimm/4.11.1255 · DOI
- SM Eibert, 2004, Cofilin peptide homologs interfere with immunological synapse formation and T cell activation, Proc Natl Acad Sci U S A, 101, 1957, 10.1073/pnas.0308282100 · DOI
- KH Lee, 2000, Cofilin: a missing link between T cell co-stimulation and rearrangement of the actin cytoskeleton, Eur J Immunol, 30, 892, 10.1002/1521-4141(200003)30:3<892::AID-IMMU892>3.0.CO;2-U · DOI
- Y Samstag, 2013, Cofilin: a redox sensitive mediator of actin dynamics during T-cell activation and migration, Immunol Rev, 256, 30, 10.1111/imr.12115 · DOI
- A Pendleton, 2003, Latrunculin B or ATP depletion induces cofilin-dependent translocation of actin into nuclei of mast cells, J Biol Chem, 278, 14394, 10.1074/jbc.M206393200 · DOI
- K Falahzadeh, 2015, The potential roles of actin in the nucleus, Cell J, 17, 7
- M Klemke, 2010, An MEK-cofilin signalling module controls migration of human T cells in 3D but not 2D environments, EMBO J, 29, 2915, 10.1038/emboj.2010.153 · DOI
- P Friedl, 1998, CD4+ T lymphocytes migrating in three-dimensional collagen lattices lack focal adhesions and utilize beta1 integrin-independent strategies for polarization, interaction with collagen fibers and locomotion, Eur J Immunol, 28, 2331, 10.1002/(SICI)1521-4141(199808)28:08<2331::AID-IMMU2331>3.0.CO;2-C · DOI
- K Wolf, 2003, Amoeboid shape change and contact guidance: T-lymphocyte crawling through fibrillar collagen is independent of matrix remodeling by MMPs and other proteases, Blood, 102, 3262, 10.1182/blood-2002-12-3791 · DOI
- E Woolf, 2007, Lymph node chemokines promote sustained T lymphocyte motility without triggering stable integrin adhesiveness in the absence of shear forces, Nat Immunol, 8, 1076, 10.1038/ni1499 · DOI
- T Lammermann, 2008, Rapid leukocyte migration by integrin-independent flowing and squeezing, Nature, 453, 51, 10.1038/nature06887 · DOI · Paper page
- GH Wabnitz, 2010, Mitochondrial translocation of oxidized cofilin induces caspase-independent necrotic-like programmed cell death of T cells, Cell Death Dis, 1, e58, 10.1038/cddis.2010.36 · DOI
- M Klemke, 2008, Oxidation of cofilin mediates T cell hyporesponsiveness under oxidative stress conditions, Immunity, 29, 404, 10.1016/j.immuni.2008.06.016 · DOI
- B Schulte, 2013, A reducing milieu renders cofilin insensitive to phosphatidylinositol 4,5-bisphosphate (PIP2) inhibition, J Biol Chem, 288, 29430, 10.1074/jbc.M113.479766 · DOI
- AT De Souza, 2006, Transcriptional and phenotypic comparisons of Ppara knockout and siRNA knockdown mice, Nucleic Acids Res, 34, 4486, 10.1093/nar/gkl609 · DOI
- A Rossi, 2015, Genetic compensation induced by deleterious mutations but not gene knockdowns, Nature, 524, 230, 10.1038/nature14580 · DOI
- MD Ryan, 1991, Cleavage of foot-and-mouth disease virus polyprotein is mediated by residues located within a 19 amino acid sequence, Journal of General Virology, 72, 2727, 10.1099/0022-1317-72-11-2727 · DOI
- MD Ryan, 1999, A model for nonstoichiometric, cotranslational protein scission in eukaryotic ribosomes, Bioorganic Chemistry, 27, 55, 10.1006/bioo.1998.1119 · DOI
- MLL Donnelly, 2001, Analysis of the aphthovirus 2A/2B polyprotein 'cleavage' mechanism indicates not a proteolytic reaction, but a novel translational effect: a putative ribosomal 'skip', Journal of General Virology, 82, 1013, 10.1099/0022-1317-82-5-1013 · DOI
- PC Orban, 1992, Tissue- and site-specific DNA recombination in transgenic mice, Proc Natl Acad Sci U S A, 89, 6861, 10.1073/pnas.89.15.6861 · DOI
- C Shimizu, 2001, Progression of T cell lineage restriction in the earliest subpopulation of murine adult thymus visualized by the expression of lck proximal promoter activity, Int Immunol, 13, 105, 10.1093/intimm/13.1.105 · DOI
- DI Godfrey, 1993, A developmental pathway involving four phenotypically and functionally distinct subsets of CD3-CD4-CD8- triple-negative adult mouse thymocytes defined by CD44 and CD25 expression, J Immunol, 150, 4244, 10.4049/jimmunol.150.10.4244 · DOI
- RM Laird, 2010, Roles of the Src tyrosine kinases Lck and Fyn in regulating gammadeltaTCR signal strength, PLoS One, 5, e8899, 10.1371/journal.pone.0008899 · DOI
- Y Cai, 2011, Pivotal role of dermal IL-17-producing gammadelta T cells in skin inflammation, Immunity, 35, 596, 10.1016/j.immuni.2011.08.001 · DOI
- B Becher, 2012, Hiding under the skin: Interleukin-17-producing gammadelta T cells go under the skin?, Nat Med, 18, 1748, 10.1038/nm.3016 · DOI
- S Pantelyushin, 2012, Rorgammat+ innate lymphocytes and gammadelta T cells initiate psoriasiform plaque formation in mice, J Clin Invest, 122, 2252, 10.1172/JCI61862 · DOI
- EF Lind, 2001, Mapping precursor movement through the postnatal thymus reveals specific microenvironments supporting defined stages of early lymphoid development, J Exp Med, 194, 127, 10.1084/jem.194.2.127 · DOI · Paper page
- J Plotkin, 2003, Critical role for CXCR4 signaling in progenitor localization and T cell differentiation in the postnatal thymus, J Immunol, 171, 4521, 10.4049/jimmunol.171.9.4521 · DOI
- T Ara, 2003, A role of CXC chemokine ligand 12/stromal cell-derived factor-1/pre-B cell growth stimulating factor and its receptor CXCR4 in fetal and adult T cell development in vivo, J Immunol, 170, 4649, 10.4049/jimmunol.170.9.4649 · DOI
- DD Billadeau, 2007, Regulation of T-cell activation by the cytoskeleton, Nat Rev Immunol, 7, 131, 10.1038/nri2021 · DOI
- AT Ritter, 2013, The role of the cytoskeleton at the immunological synapse, Immunol Rev, 256, 107, 10.1111/imr.12117 · DOI
- TJ Thauland, 2017, Cytoskeletal adaptivity regulates T cell receptor signaling, Sci Signal, 10, 10.1126/scisignal.aah3737 · DOI
- HJ Fehling, 1995, Crucial role of the pre-T-cell receptor alpha gene in development of alpha beta but not gamma delta T cells, Nature, 375, 795, 10.1038/375795a0 · DOI
- M Malissen, 1995, Altered T cell development in mice with a targeted mutation of the CD3-epsilon gene, EMBO J, 14, 4641, 10.1002/j.1460-2075.1995.tb00146.x · DOI
- H vonBoehmer, 1995, Control of T-cell development by the Pre-T and alpha beta T-cell, Receptor Activation by Antigens, Cytokines, Hormones, and Growth Factors, 766, 52
- I Aifantis, 2006, Regulation of T-cell progenitor survival and cell-cycle entry by the pre-T-cell receptor, Immunol Rev, 209, 159, 10.1111/j.0105-2896.2006.00343.x · DOI
- P Zarin, 2015, Gamma delta T-cell differentiation and effector function programming, TCR signal strength, when and how much?, Cell Immunol, 296, 70, 10.1016/j.cellimm.2015.03.007 · DOI
- D Sakata, 2007, Impaired T lymphocyte trafficking in mice deficient in an actin-nucleating protein, mDia1, J Exp Med, 204, 2031, 10.1084/jem.20062647 · DOI
- SC Morley, 2010, The actin-bundling protein L-plastin dissociates CCR7 proximal signaling from CCR7-induced motility, J Immunol, 184, 3628, 10.4049/jimmunol.0903851 · DOI
- N Foger, 2006, Requirement for coronin 1 in T lymphocyte trafficking and cellular homeostasis, Science, 313, 839, 10.1126/science.1130563 · DOI
- LR Shiow, 2008, The actin regulator coronin 1A is mutant in a thymic egress-deficient mouse strain and in a patient with severe combined immunodeficiency, Nat Immunol, 9, 1307, 10.1038/ni.1662 · DOI · Paper page
- J Zhang, 1999, Antigen receptor-induced activation and cytoskeletal rearrangement are impaired in Wiskott-Aldrich syndrome protein-deficient lymphocytes, Journal of Experimental Medicine, 190, 1329, 10.1084/jem.190.9.1329 · DOI
- SB Snapper, 1998, Wiskott-Aldrich syndrome protein-deficient mice reveal a role for WASP in T but not B cell activation, Immunity, 9, 81, 10.1016/S1074-7613(00)80590-7 · DOI
- JY Zhang, 2002, WASp verprolin homology, cofilin homology, and acidic region domain-mediated actin polymerization is required for T cell development, Proc Natl Acad Sci U S A, 99, 2240, 10.1073/pnas.042686099 · DOI
- K El Malki, 2013, An alternative pathway of imiquimod-induced psoriasis-like skin inflammation in the absence of interleukin-17 receptor a signaling, J Invest Dermatol, 133, 441, 10.1038/jid.2012.318 · DOI
- M Kondo, 1997, Identification of clonogenic common lymphoid progenitors in mouse bone marrow, Cell, 91, 661, 10.1016/S0092-8674(00)80453-5 · DOI · Paper page
Cited by
Dominant activating RAC2 mutation with lymphopenia, immunodeficiency, and cytoskeletal defects
Hsu, A. P., Donkó, A., Arrington, M. E., Swamydas, M., Fink, D., Das, A., Escobedo, O., Bonagura, V., Szabolcs, P., Steinberg, H. N., et al. (2019) · Blood · doi:10.1182/blood-2018-11-886028 · Cited by 92
Metadata
- Authors
- Seeland, I., Xiong, Y., Orlik, C., Deibel, D., Prokosch, S., Küblbeck, G., Jahraus, B., De Stefano, D., Moos, S., Kurschus, F. C., Arnold, B., & Samstag, Y.
- Venue
- PLOS Biology
- Publisher
- Public Library of Science (PLoS)
- Published
- 2018-07-09
- Volume
- 16
- Issue
- 7
- Pages
- e2005380
- ISSN
- 1545-7885
- PMC
- PMC6053251
- Cited by
- 12
- References
- 2
- Language
- en
- Update notices
- new_version (2018-07-19)
About these checks
Registry, retraction, Cites and statistics results are computed, not judged, with one exception: a printed reference that no index lists is read once by a model before it counts as a citation error. Claims are extracted by a model and kept only when their quote appears verbatim in the text; each cited source is then checked, with a model’s help, for whether it says what the claim relies on. Those verdicts can be wrong — read the claim’s quote and the cited source before relying on one.
Statistics and arithmetic are recomputed, not judged.
Confidence bands are shown only for fields calibrated on our annotated test set. None is calibrated yet, so no band is shown.
What counts as a claim ›How we measure confidence ›How we check this ›
Are you an author, or do you see a problem with this page? Request a review
