

The DOI matches its Crossref record; 55 of the 55 references it cites were found in a registry or an index.
Efficiency and Cost of Economical Brain Functional Networks
Open accessAbstract
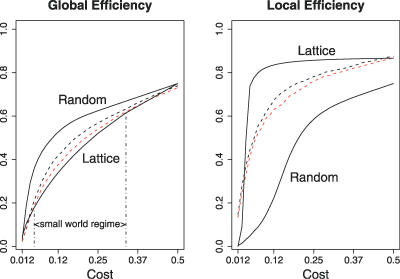
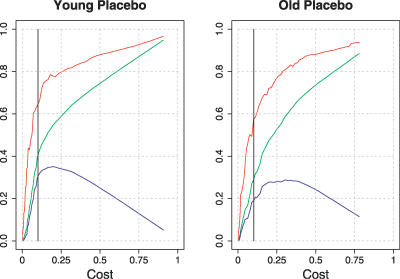
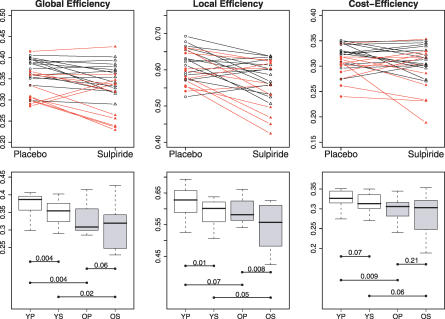
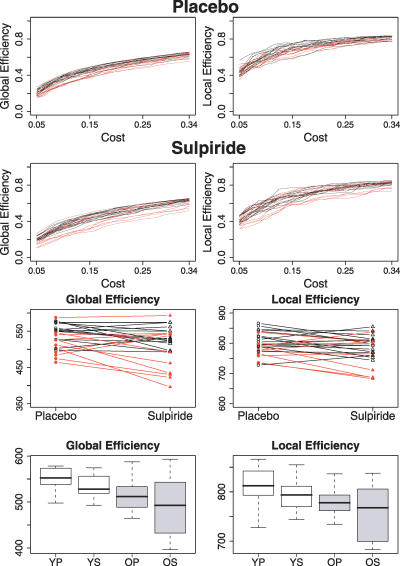
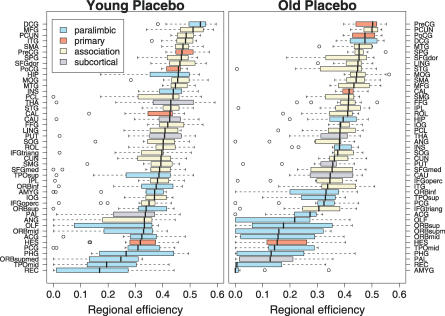
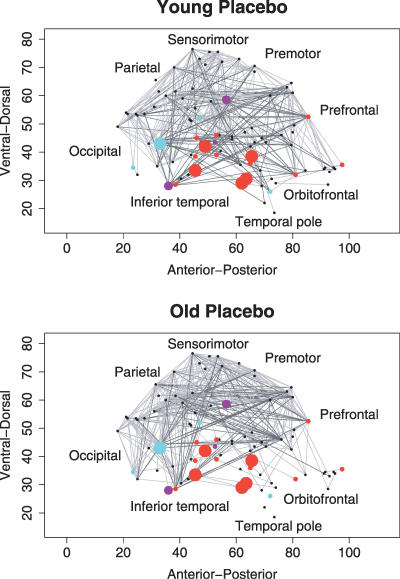
Brain anatomical networks are sparse, complex, and have economical small-world properties. We investigated the efficiency and cost of human brain functional networks measured using functional magnetic resonance imaging (fMRI) in a factorial design: two groups of healthy old (N = 11; mean age = 66.5 years) and healthy young (N = 15; mean age = 24.7 years) volunteers were each scanned twice in a no-task or "resting" state following placebo or a single dose of a dopamine receptor antagonist (sulpiride 400 mg). Functional connectivity between 90 cortical and subcortical regions was estimated by wavelet correlation analysis, in the frequency interval 0.06-0.11 Hz, and thresholded to construct undirected graphs. These brain functional networks were small-world and economical in the sense of providing high global and local efficiency of parallel information processing for low connection cost. Efficiency was reduced disproportionately to cost in older people, and the detrimental effects of age on efficiency were localised to frontal and temporal cortical and subcortical regions. Dopamine antagonism also impaired global and local efficiency of the network, but this effect was differentially localised and did not interact with the effect of age. Brain functional networks have economical small-world properties-supporting efficient parallel information transfer at relatively low cost-which are differently impaired by normal aging and pharmacological blockade of dopamine transmission.
Overview
The claims and statistics of this paper haven’t been checked yet.
Run the check — free, no account needed. It reads the open-access text and checks the sources it cites.
Integrity signals
Registry
Cites
Statistics
Figures
Verification
Claims the paper makes
The claims and statistics of this paper haven’t been checked yet.
Run the check — free, no account needed. It reads the open-access text and checks the sources it cites.
Claims other papers make about this one
Each is checked against this paper’s own text: does it say what the citing paper says it does?
The cited source says what the claim attributes to it.
In the citing paper
“A related measure is global efficiency, which is the inverse of path length, 60 but which has a greater relative contribution from short-distance connections. 1”
From Graph theory analysis of complex brain networks: new concepts in brain mapping applied to neurosurgery (2016) · cites this paper as [1]
The cited source says what the claim attributes to it.
In the citing paper
“The total number of connections in a network can also be regarded as an estimate of the cost in establishing a particular configuration. 1”
From Graph theory analysis of complex brain networks: new concepts in brain mapping applied to neurosurgery (2016) · cites this paper as [1]
The cited source says what the claim attributes to it.
In the citing paper
“Efficiency and path length are related measures (Achard & Bullmore, 2007).”
From Functional and structural connectome properties in the 5XFAD transgenic mouse model of Alzheimer’s disease (2018) · cites this paper as Achard & Bullmore, 2007
Self-check
Percentages, sums and reported differences re-computed from the paper’s own numbers.
The self-check needs the paper’s full text.
Citations
Cites
Folstein, M. F., Folstein, S. E., & McHugh, P. R. (1975) · Journal of Psychiatric Research · doi:10.1016/0022-3956(75)90026-6 · Cited by 88,282
Collective dynamics of ‘small-world’ networks
Watts, D. J., & Strogatz, S. H. (1998) · Nature · doi:10.1038/30918 · Cited by 43,060
Hirono, N., Mori, E., Ikejiri, Y., Imamura, T., Shimomura, T., Hashimoto, M., Yamashita, H., & Ikeda, M. (1997) · PubMed · Cited by 21,012
Kok, J. S., Berg, I. J., & Scherder, E. J. A. (2013) · Dementia and Geriatric Cognitive Disorders Extra · doi:10.1159/000353441 · Cited by 20,589
Statistical mechanics of complex networks
Albert, R., & Barabási, A.-L. (2002) · Reviews of Modern Physics · doi:10.1103/revmodphys.74.47 · Cited by 20,471
Older Adults' Reasons for Using Technology while Aging in Place
Peek, S. T. M., Luijkx, K. G., Rijnaard, M. D., Nieboer, M. E., van der Voort, C. S., Aarts, S., van Hoof, J., Vrijhoef, H. J., & Wouters, E. (2015) · Gerontology · doi:10.1159/000430949 · Cited by 19,852
Sensitivity and False Alarm Rate of a Fall Sensor in Long-Term Fall Detection in the Elderly
Kangas, M., Korpelainen, R., Vikman, I., Nyberg, L., & Jämsä, T. J. (2014) · Gerontology · doi:10.1159/000362720 · Cited by 19,007
Tzourio-Mazoyer, N., Landeau, B., Papathanassiou, D., Crivello, F., Etard, O., Delcroix, N., Mazoyer, B., & Joliot, M. (2002) · NeuroImage · doi:10.1006/nimg.2001.0978 · Cited by 16,319
Functional connectivity in the motor cortex of resting human brain using echo‐planar mri
Biswal, B., Zerrin Yetkin, F., Haughton, V. M., & Hyde, J. S. (1995) · Magnetic Resonance in Medicine · doi:10.1002/mrm.1910340409 · Cited by 9,812
Strogatz, S. H. (2001) · Nature · doi:10.1038/35065725 · Cited by 8,236
Research works printed but not linked: 1
- LezakMD 1995 Neuropsychological assessment New York Oxford University Press 1026
Cited by
Sorted by citations
Complex brain networks: graph theoretical analysis of structural and functional systems
Bullmore, E., & Sporns, O. (2009) · Nature Reviews Neuroscience · doi:10.1038/nrn2575 · Cited by 11,820
Self-citationComplex network measures of brain connectivity: Uses and interpretations
Rubinov, M., & Sporns, O. (2010) · NeuroImage · doi:10.1016/j.neuroimage.2009.10.003 · Cited by 11,522
Spontaneous fluctuations in brain activity observed with functional magnetic resonance imaging
Fox, M. D., & Raichle, M. E. (2007) · Nature Reviews Neuroscience · doi:10.1038/nrn2201 · Cited by 6,700
Conn : A Functional Connectivity Toolbox for Correlated and Anticorrelated Brain Networks
Whitfield-Gabrieli, S., & Nieto-Castanon, A. (2012) · Brain Connectivity · doi:10.1089/brain.2012.0073 · Cited by 4,885
Mapping the structural core of human cerebral cortex
Hagmann, P., Cammoun, L., Gigandet, X., Meuli, R., Honey, C. J., Wedeen, V. J., & Sporns, O. (2008) · PLoS Biology · doi:10.1371/journal.pbio.0060159 · Cited by 4,173
Metadata
- Authors
- Achard, S., & Bullmore, E.
- Affiliations
- University of Cambridge (GB)
- ORCID
- Achard, Sophie
- Venue
- PLoS Computational Biology
- Publisher
- Public Library of Science (PLoS)
- Published
- 2007-02-02
- Volume
- 3
- Issue
- 2
- Pages
- e17
- ISSN
- 1553-734X (ISSN-L)
- 1553-7358
- PMC
- PMC1794324
- OpenAlex
- W1974764791
- Cited by
- 2,553
- References
- 55
- Citations by year
- 2026: 103 · 2025: 147 · 2024: 150 · 2023: 142 · 2022: 162 · 2021: 201 · 2020: 169 · 2019: 162 · 2018: 185 · 2017: 175 · 2016: 157 · 2015: 144 · 2014: 130 · 2013: 143 · 2012: 115
- FWCI
- 26.22
- Type
- journal article
- Language
- en
- Open access
- gold
- doi.org
- Locations
- PLoS Computational Biology (publishedVersion, cc-by)
- Europe PMC (PubMed Central) (publishedVersion, cc-by)
- PubMed Central (publishedVersion, cc-by)
- PubMed (publishedVersion)
- DOAJ (DOAJ: Directory of Open Access Journals) (submittedVersion, cc-by-sa)
- Figshare (submittedVersion, cc-by)
- Funders
- Wellcome Trust
- Medical Research Council
- National Institute of Mental Health
- Topics
- Life Sciences › Neuroscience › Cognitive Neuroscience › Functional Brain Connectivity Studies
- Physical Sciences › Physics and Astronomy › Statistical and Nonlinear Physics › Complex Network Analysis Techniques
- Health Sciences › Medicine › Radiology, Nuclear Medicine and Imaging › Advanced Neuroimaging Techniques and Applications
- Keywords
- functional brain networks, small-world networks, network efficiency, network cost, aging, sulpiride, dopamine receptor antagonism, functional connectivity, resting state, wavelet correlation, graph theory, frontal cortex, temporal cortex, subcortical structures
- MeSH terms
- Adult, Aged, Aging, Brain, Brain Mapping, Computer Simulation, Female, Humans, Magnetic Resonance Imaging, Male, Models, Neurological, Nerve Net, Neurons, Dopamine Antagonists
About these checks
Registry, retraction, Cites and statistics results are computed, not judged, with one exception: a printed reference that no index lists is read once by a model before it counts as a citation error. Claims are extracted by a model and kept only when their quote appears verbatim in the text; each cited source is then checked, with a model’s help, for whether it says what the claim relies on. Those verdicts can be wrong — read the claim’s quote and the cited source before relying on one.
Statistics and arithmetic are recomputed, not judged.
Confidence bands are shown only for fields calibrated on our annotated test set. None is calibrated yet, so no band is shown.
What counts as a claim ›How we measure confidence ›How we check this ›
Are you an author, or do you see a problem with this page? Request a review
